
Market Breadth: Percentage of Stocks Above their 50 Day, 150 Day & 200 Day Moving Averages Combined
The full post is available to view by members only. For immediate access:
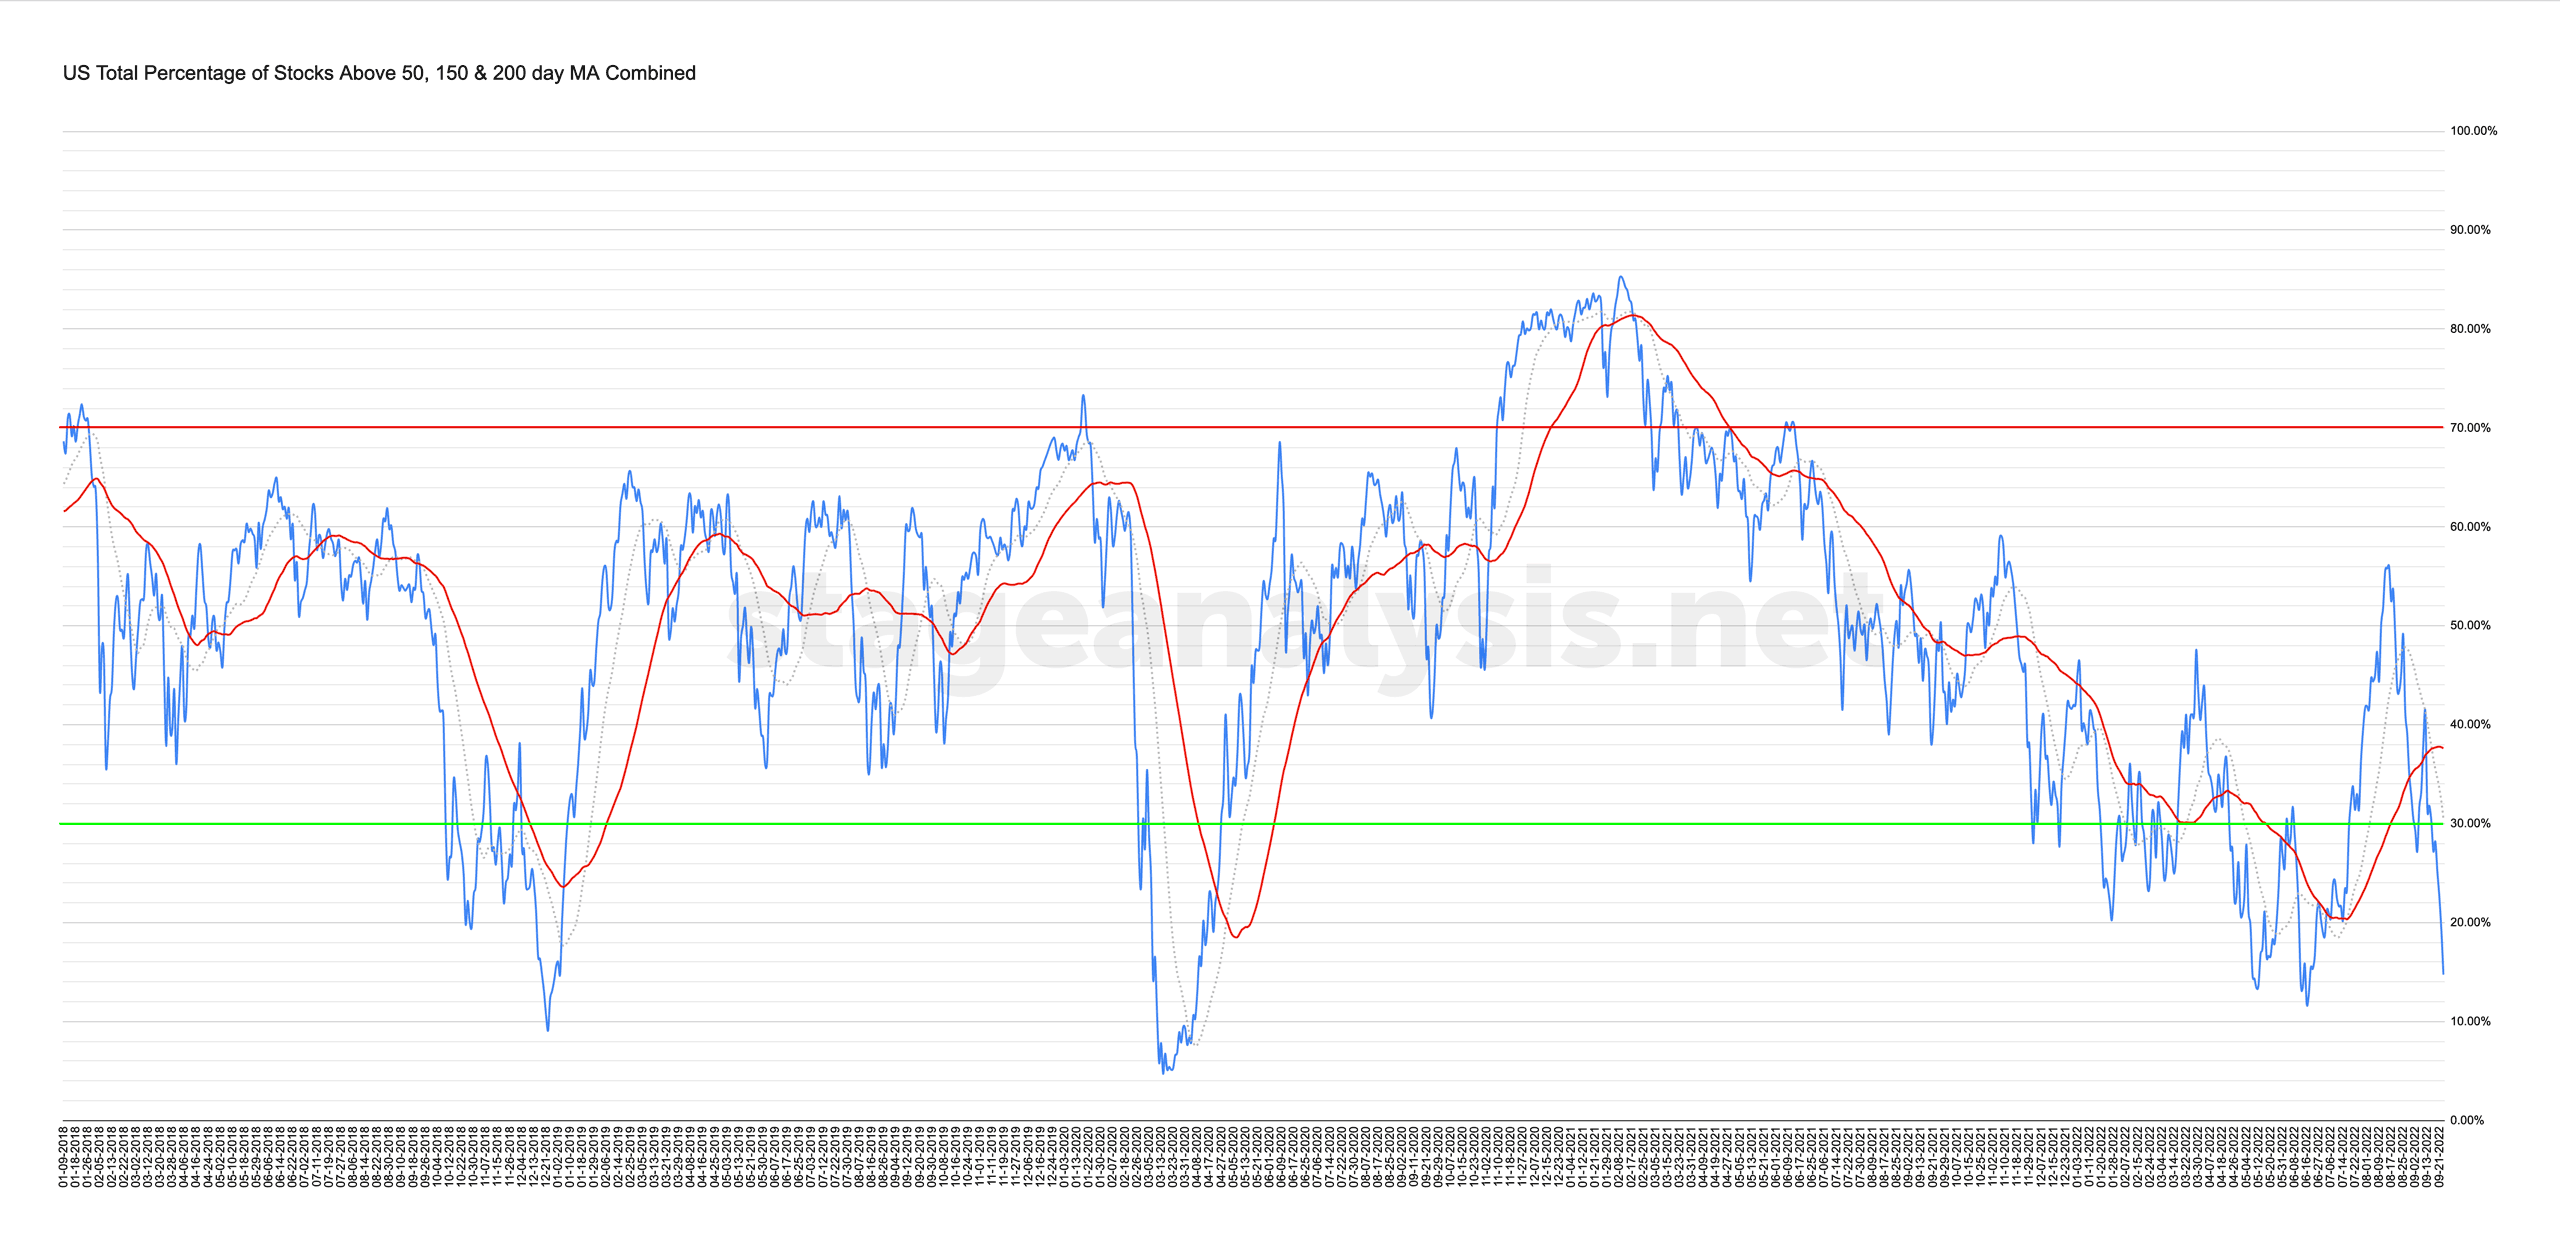
14.74% (-12.47% 1wk)
Status: Difficult Environment in the Stage 4 zone
The US Total Percentage of Stocks above their 50 Day, 150 Day & 200 Day Moving Averages (shown above) had a further decline of -12.47% to finish the week at just 14.74%. Which is an extremely low level, and is a fairly rare level in the last 20 years, with the overall average only trading lower than this level for brief periods except in late 2008, when it held below for multiple months.
So the current status from the line chart continues to be a Difficult Environment in the Stage 4 zone.
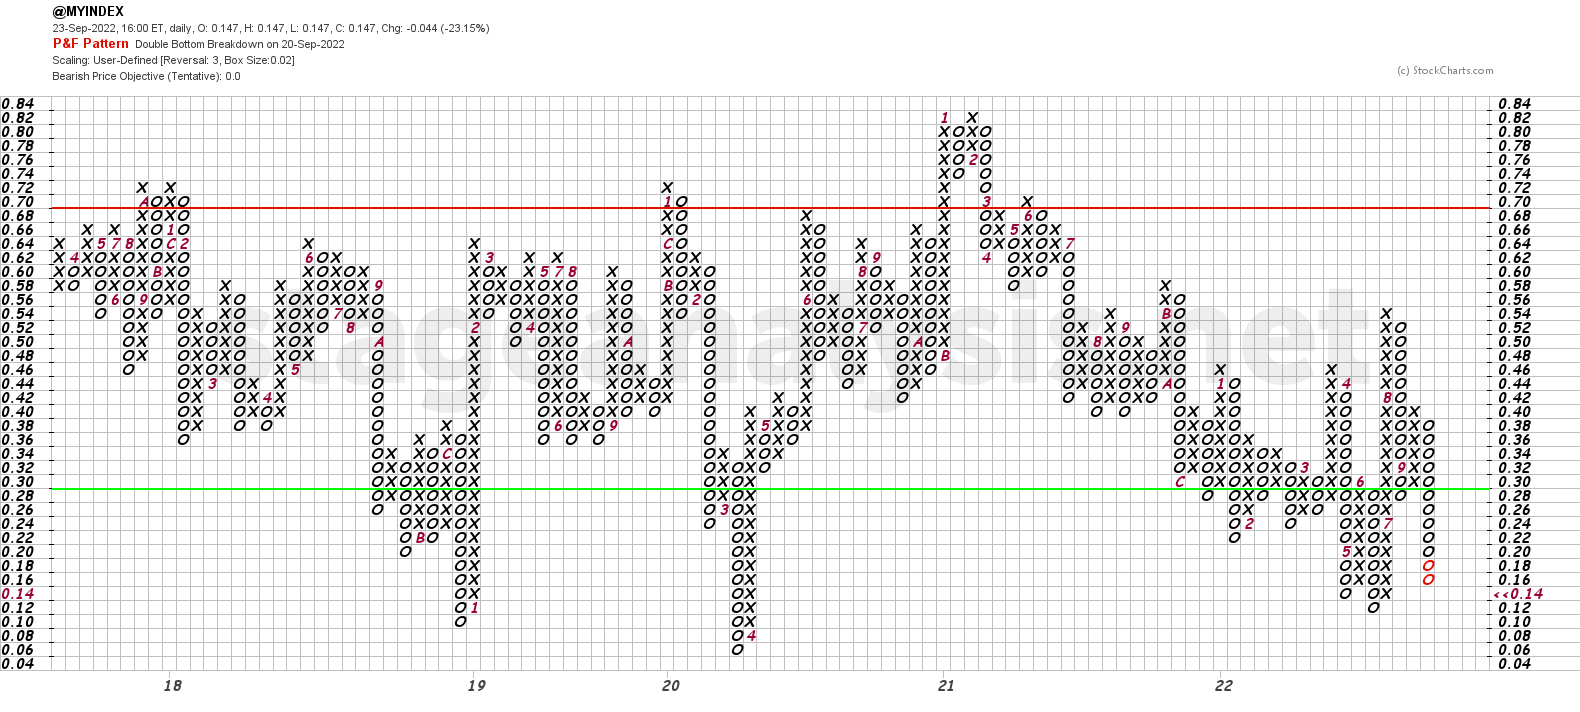
The Point and Figure chart (shown below) declined by a further 6 boxes, with a P&F status changing back to Bear Confirmed on Monday 19th (which it's spent much of this year on) with a double bottom breakdown, and then continued lower into the end of the week. So the P&F chart remains in a column of Os, and hence the strategy continues to be Defense.
I will talk more about these charts and all of the other combined moving average breadth charts from the full members post in detail during the Stage Analysis Members weekend video – which is scheduled for later on Sunday afternoon EST.
Become a Stage Analysis Member:
To see more like this – US Stocks watchlist posts, detailed videos each weekend, use our unique Stage Analysis tools, such as the US Stocks & ETFs Screener, Charts, Market Breadth, Group Relative Strength and more...
Join Today
Disclaimer: For educational purpose only. Not investment advice. Seek professional advice from a financial advisor before making any investing decisions.