
Market Breadth: Percentage of Stocks Above their 50 Day, 150 Day & 200 Day Moving Averages Combined
The full post is available to view by members only. For immediate access:
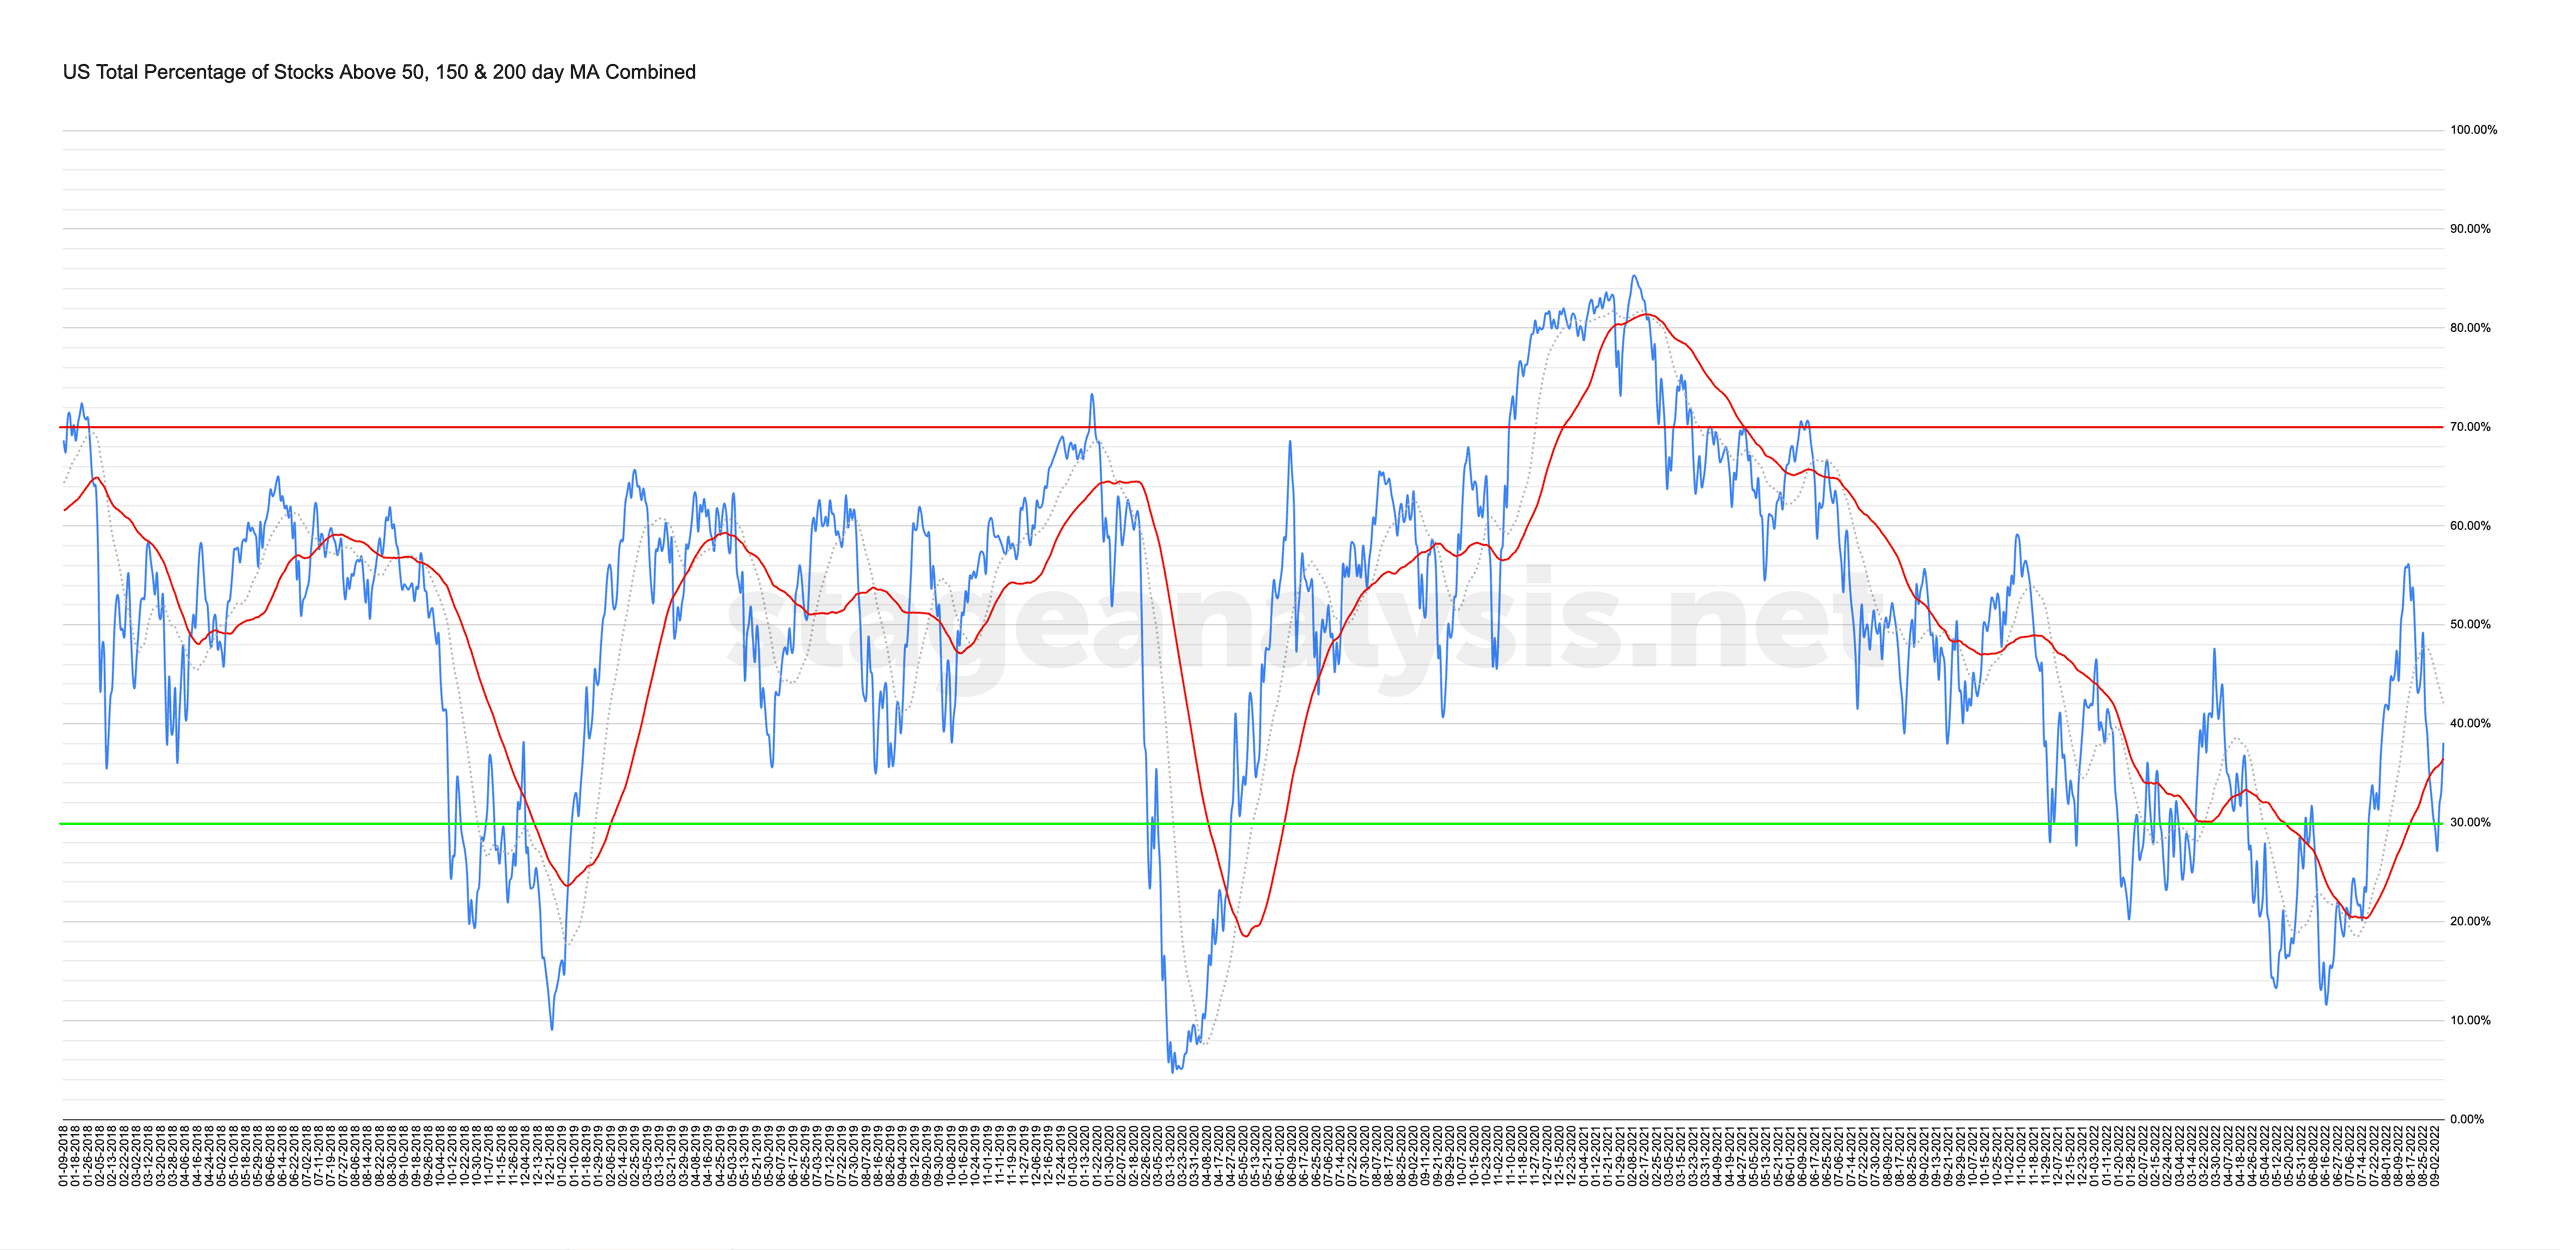
38.08% (+8.77% 1wk)
Status: Neutral Environment in the Stage 4 zone
The US Total Percentage of Stocks above their 50 Day, 150 Day & 200 Day Moving Averages bounced +8.77% this week to end the week at 38.08%. So it recovered from the lower zone, but as its under 40% still, it remains in the Stage 4 zone. But any continuation of the strength this week could push it back into the Stage 1 territory (between 40% to 60%).
The rebound also took it back above its own 50 day MA – which is used as the signal line – but it remains -4.04% below its 20 day MA, and so the status changes to Neutral Environment.
I will talk more about this and all of the other combined moving average breadth charts from the full members post in detail during the Stage Analysis Members weekend video – which is scheduled for later on Sunday afternoon EST.
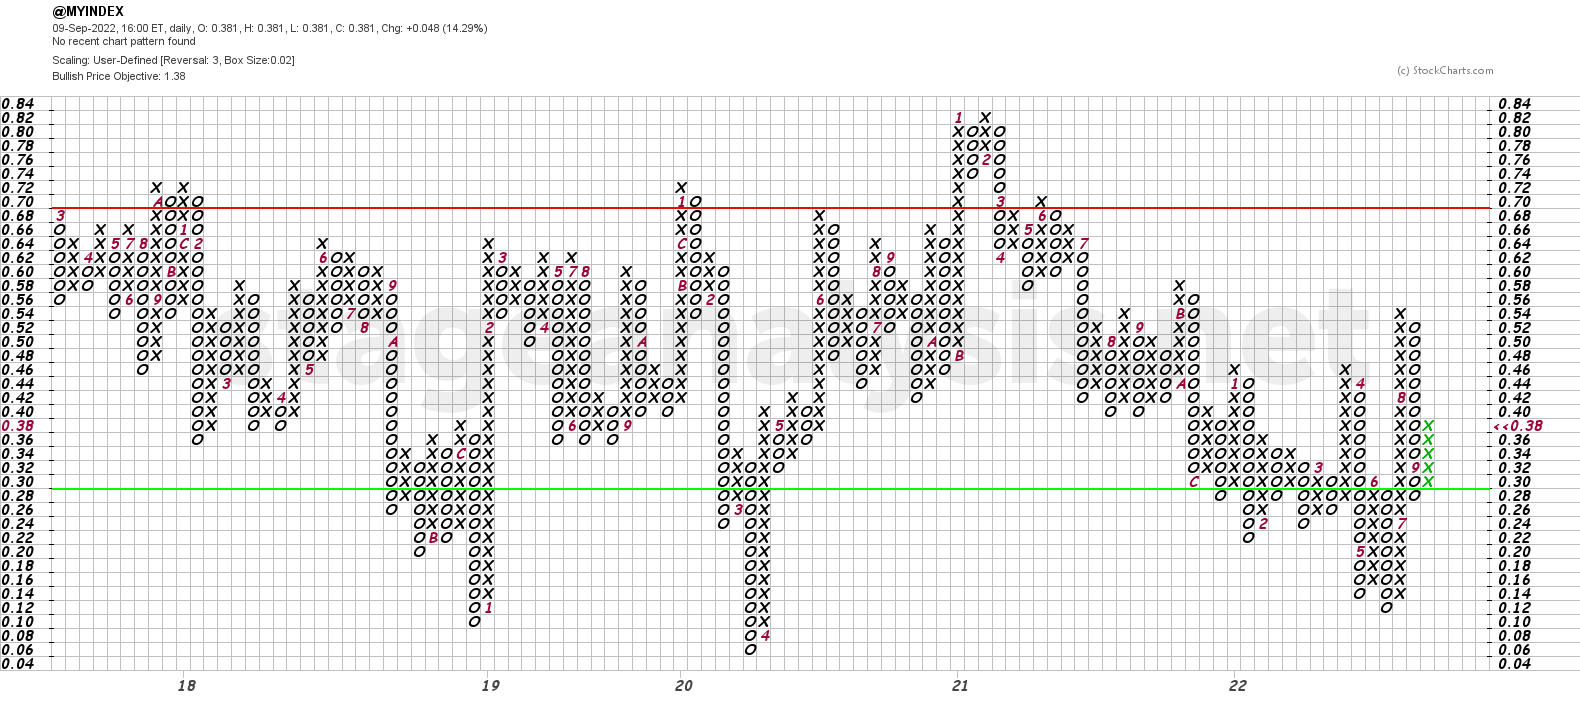
The Point & Figure chart reversed columns, to a column of Xs, and added 5 Xs, with a reversal through the key 30% level. Hence it changes the P&F signal to Bull Alert status and so the strategy shifts to Offense once more.
Become a Stage Analysis Member:
To see more like this – US Stocks watchlist posts, detailed videos each weekend, use our unique Stage Analysis tools, such as the US Stocks & ETFs Screener, Charts, Market Breadth, Group Relative Strength and more...
Join Today
Disclaimer: For educational purpose only. Not investment advice. Seek professional advice from a financial advisor before making any investing decisions.