
Sector Breadth: Percentage of US Stocks Above Their 150 day (30 Week) Moving Averages
The full post is available to view by members only. For immediate access:
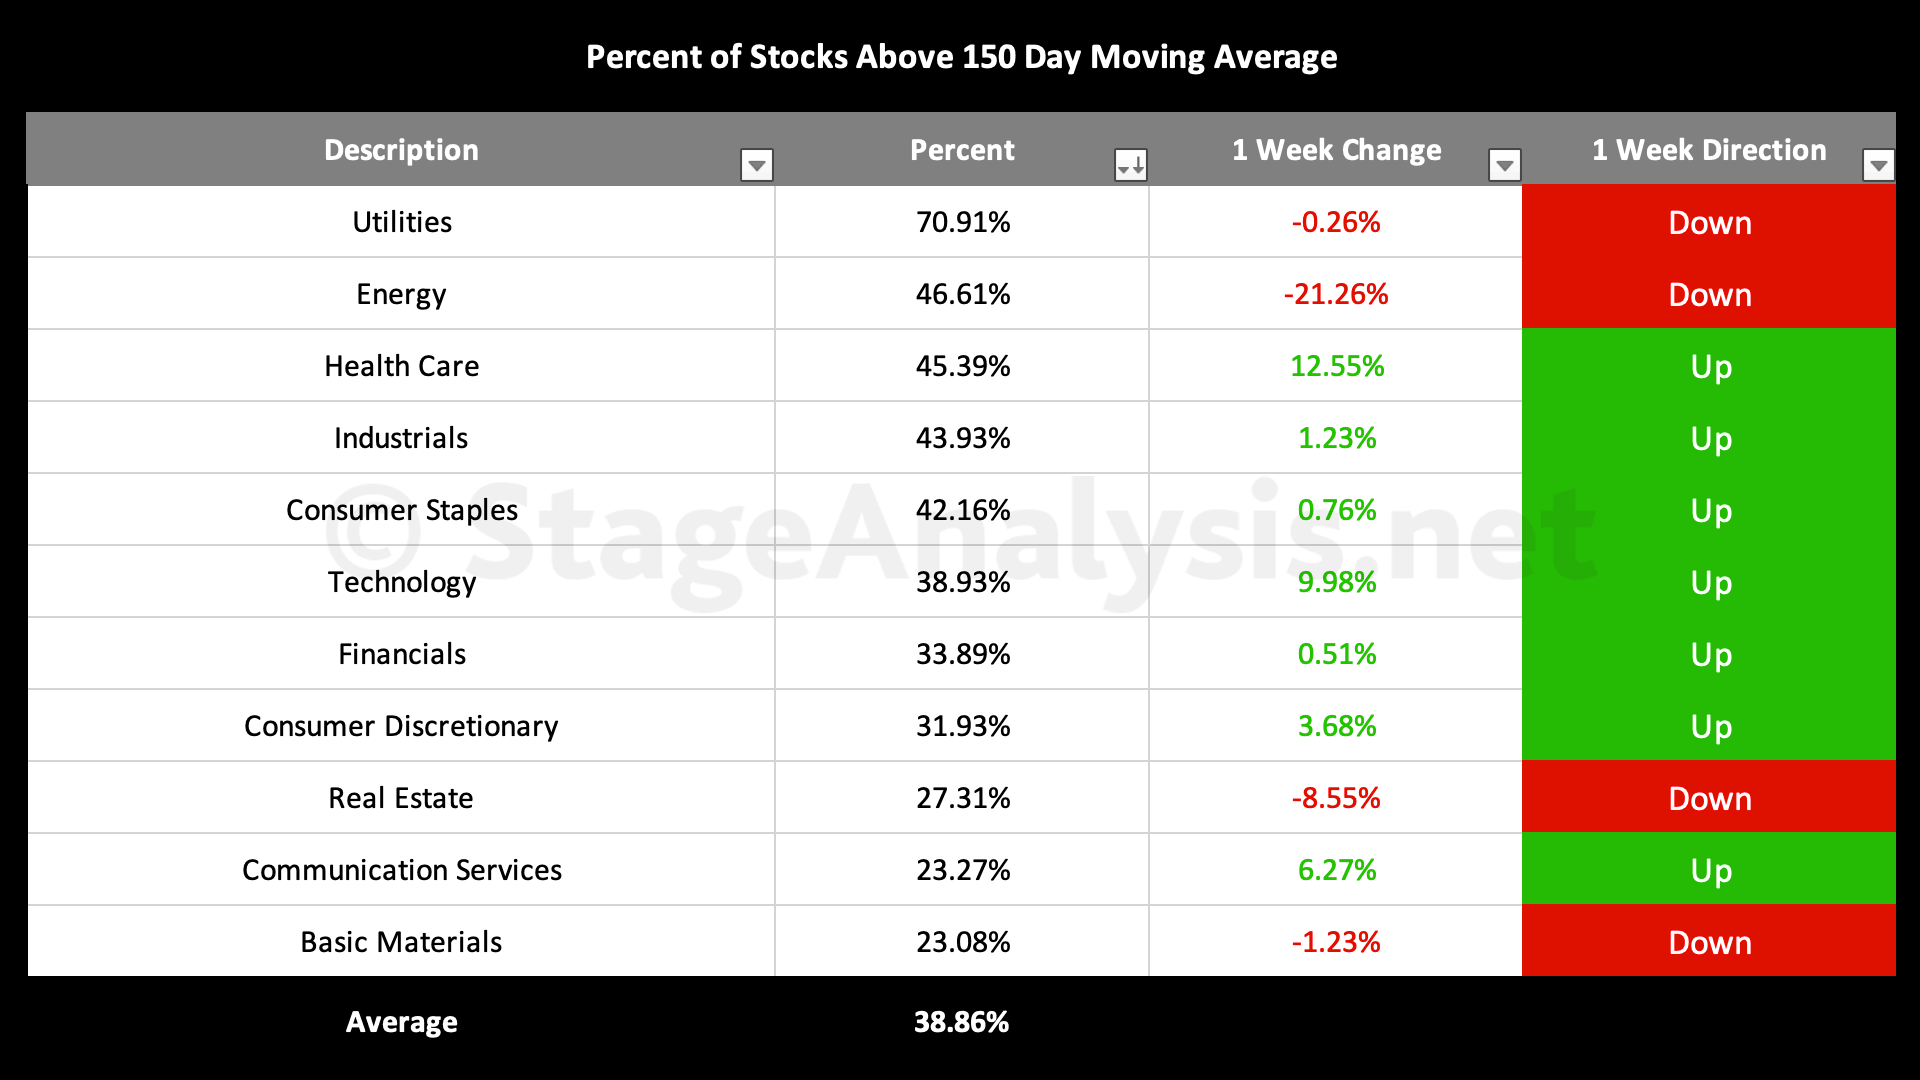
Average: 38.86% (+15.91% 5wks)
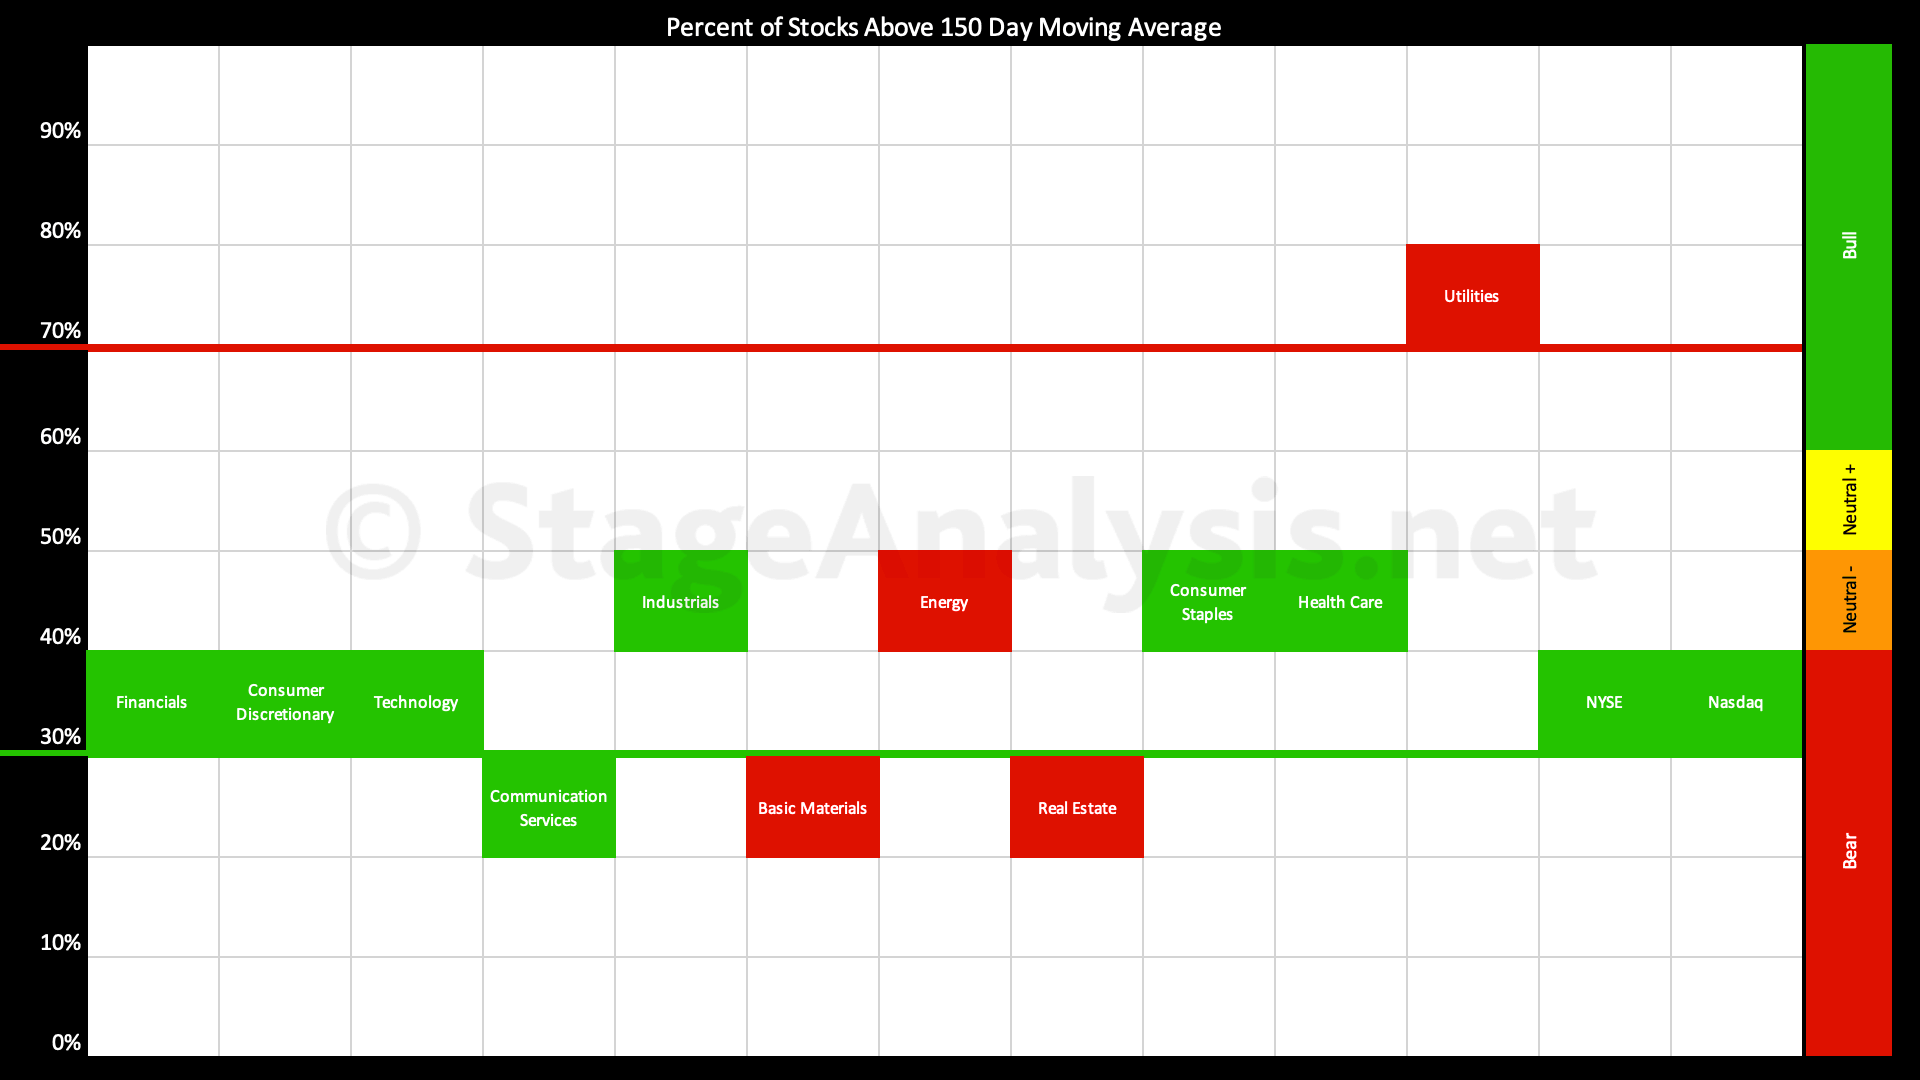
- 1 sector in the Stage 2 zone (Utilities)
- 4 sectors are in Stage 1 / 3 zone (Energy, Health Care, Industrials, Consumer Staples)
- 6 sectors are in Stage 4 zone (Technology, Financials, Consumer Discretionary, Real Estate, Communication Services, Basic Materials)
There has been steady improvement in the Percentage of US Stocks Above Their 150 day Moving Averages over the last 5 weeks since I produced the sector breadth diagram and table, with a +15.91% improvement over the period and a few more sectors moving into the Stage 1 zone (40% to 60% range), and one sector moving into the Stage 2 zone (above 60%). So the overall average is now only 1.14% below the 40% level and so the sector breadth suggests that the market is potentially transitioning into early Stage 1. But it needs further confirmation still, from continued improvement into the middle range ideally.
But even if it is transitioning to Stage 1 – and it's still a big if at this point – that doesn't rule out another significant down swing in the market to test the June low, or even multiple swings as a base develops, as the early part of Stage 1 is highly volatile. So caution remains prudent.
Become a Stage Analysis Member:
To see more like this – US Stocks watchlist posts, detailed videos each weekend, use our unique Stage Analysis tools, such as the US Stocks & ETFs Screener, Charts, Market Breadth, Group Relative Strength and more...
Join Today
Disclaimer: For educational purpose only. Not investment advice. Seek professional advice from a financial advisor before making any investing decisions.