
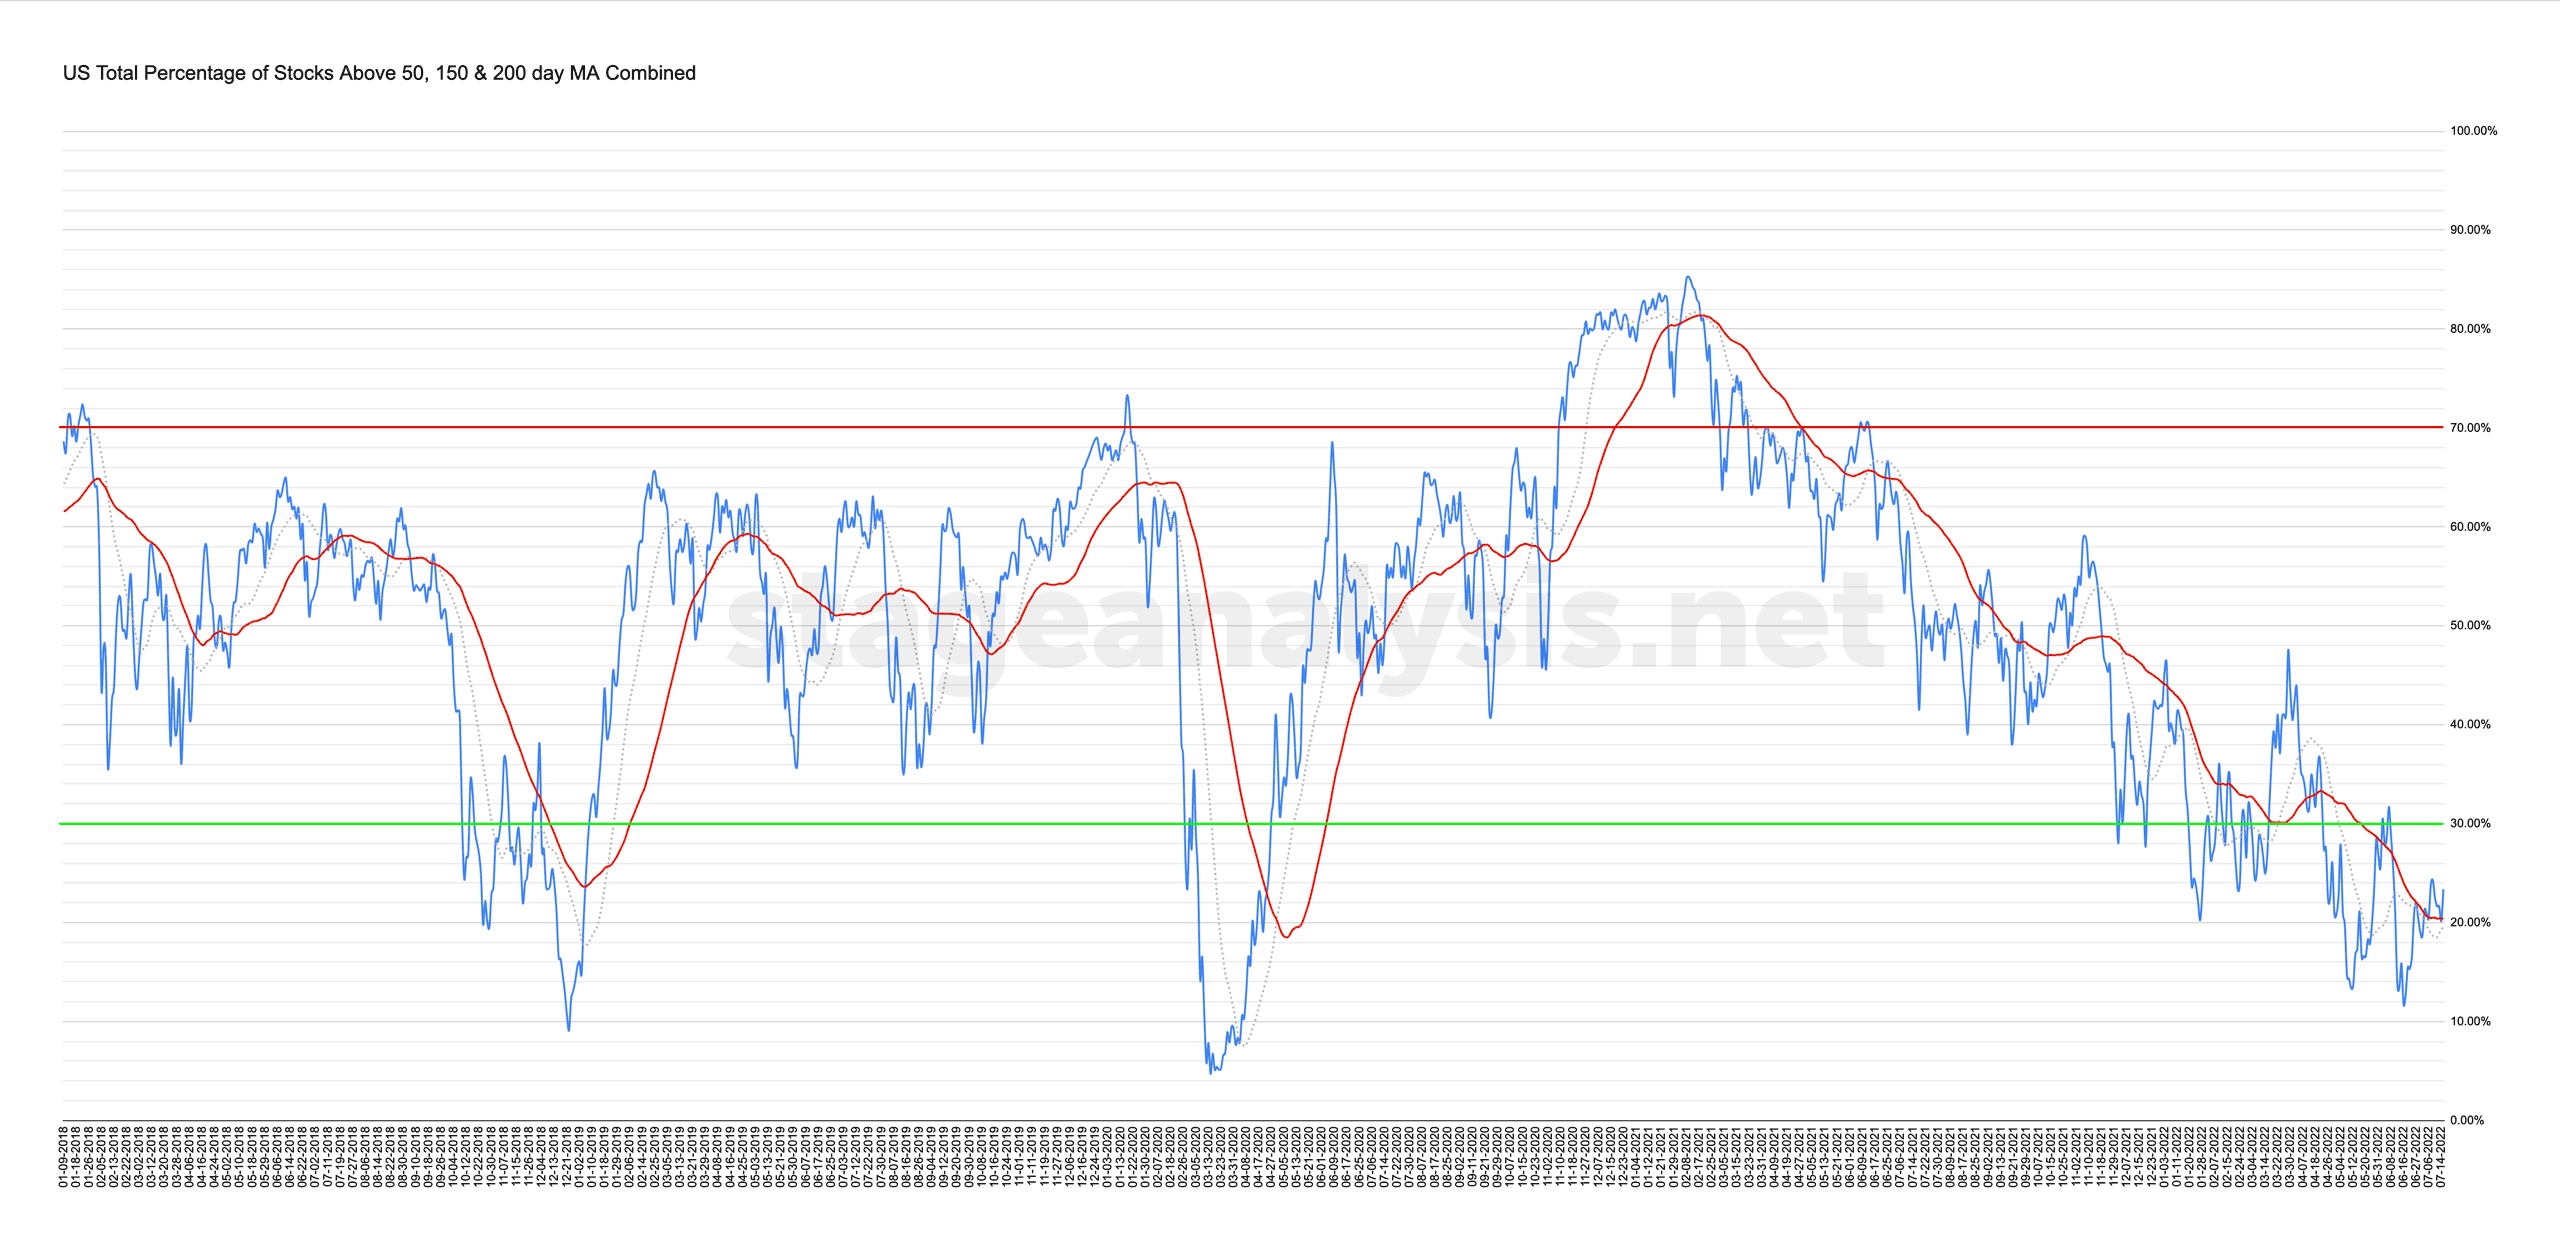
Market Breadth: Percentage of Stocks Above their 50 Day, 150 Day & 200 Day Moving Averages Combined
The full post is available to view by members only. For immediate access:
23.38% (-0.88% 1wk)
Status: Neutral / Tentative Positive Environment in Stage 4 zone
The US Total Percentage of Stocks Above their 50 Day, 150 Day & 200 Day Moving Averages tested its 50 day MA on Thursday, but managed to rebound on Friday to close the week +2.96% above it at 23.38%. So, no change in the status which remains on Neutral / Tentative Positive Environment with the Nasdaq stocks continuing to show the most relative strength in the near term.
Hence, it remains in a fragile position that could easily flip back to a Difficult Environment. But if it can continue to hold above the 50 day MA and the breadth expands further, then there's potential for it change to a Positive Environment status. So the focus at this point is looking for signs of any emerging group themes with stocks in late Stage 1 / early Stage 2, as if the market is attempting to turn around then we want to start to look for any potential early leaders or group themes in order to be ready for if they move into potential entry zones.
I'll discuss the combined moving average breadth in detail during the Stage Analysis Members weekend video – which is scheduled for later on Sunday afternoon EST.
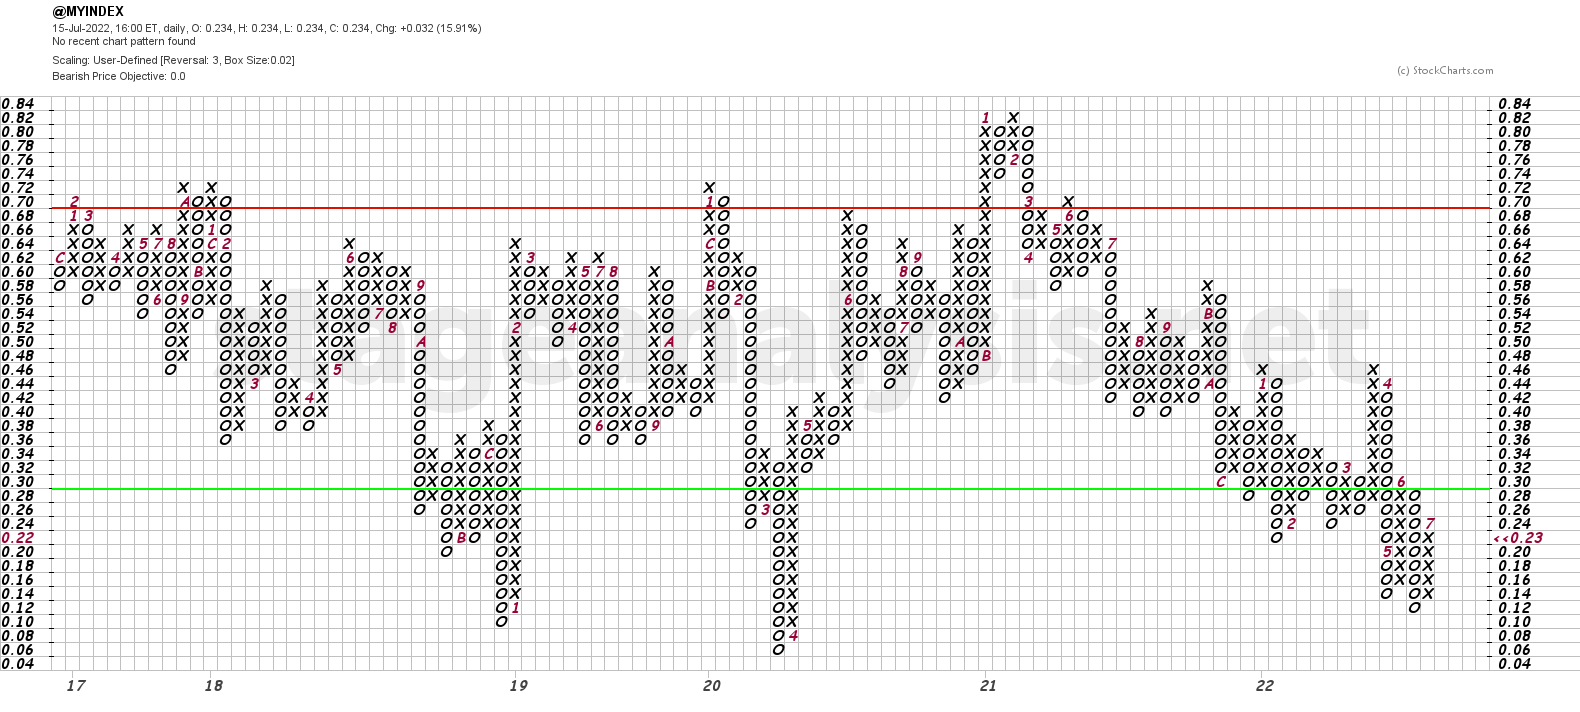
The Point and Figure chart didn't have changes to the boxes or columns this week. So it remains on Bull Alert status in the lower zone, with the 32% level, still the level to watch, in order for it to be able to change to Bull Confirmed status.
Become a Stage Analysis Member:
To see more like this – US Stocks watchlist posts, detailed videos each weekend, use our unique Stage Analysis tools, such as the US Stocks & ETFs Screener, Charts, Market Breadth, Group Relative Strength and more...
Join Today
Disclaimer: For educational purpose only. Not investment advice. Seek professional advice from a financial advisor before making any investing decisions.