
Market Breadth: Percentage of Stocks Above their 50 Day, 150 Day & 200 Day Moving Averages Combined
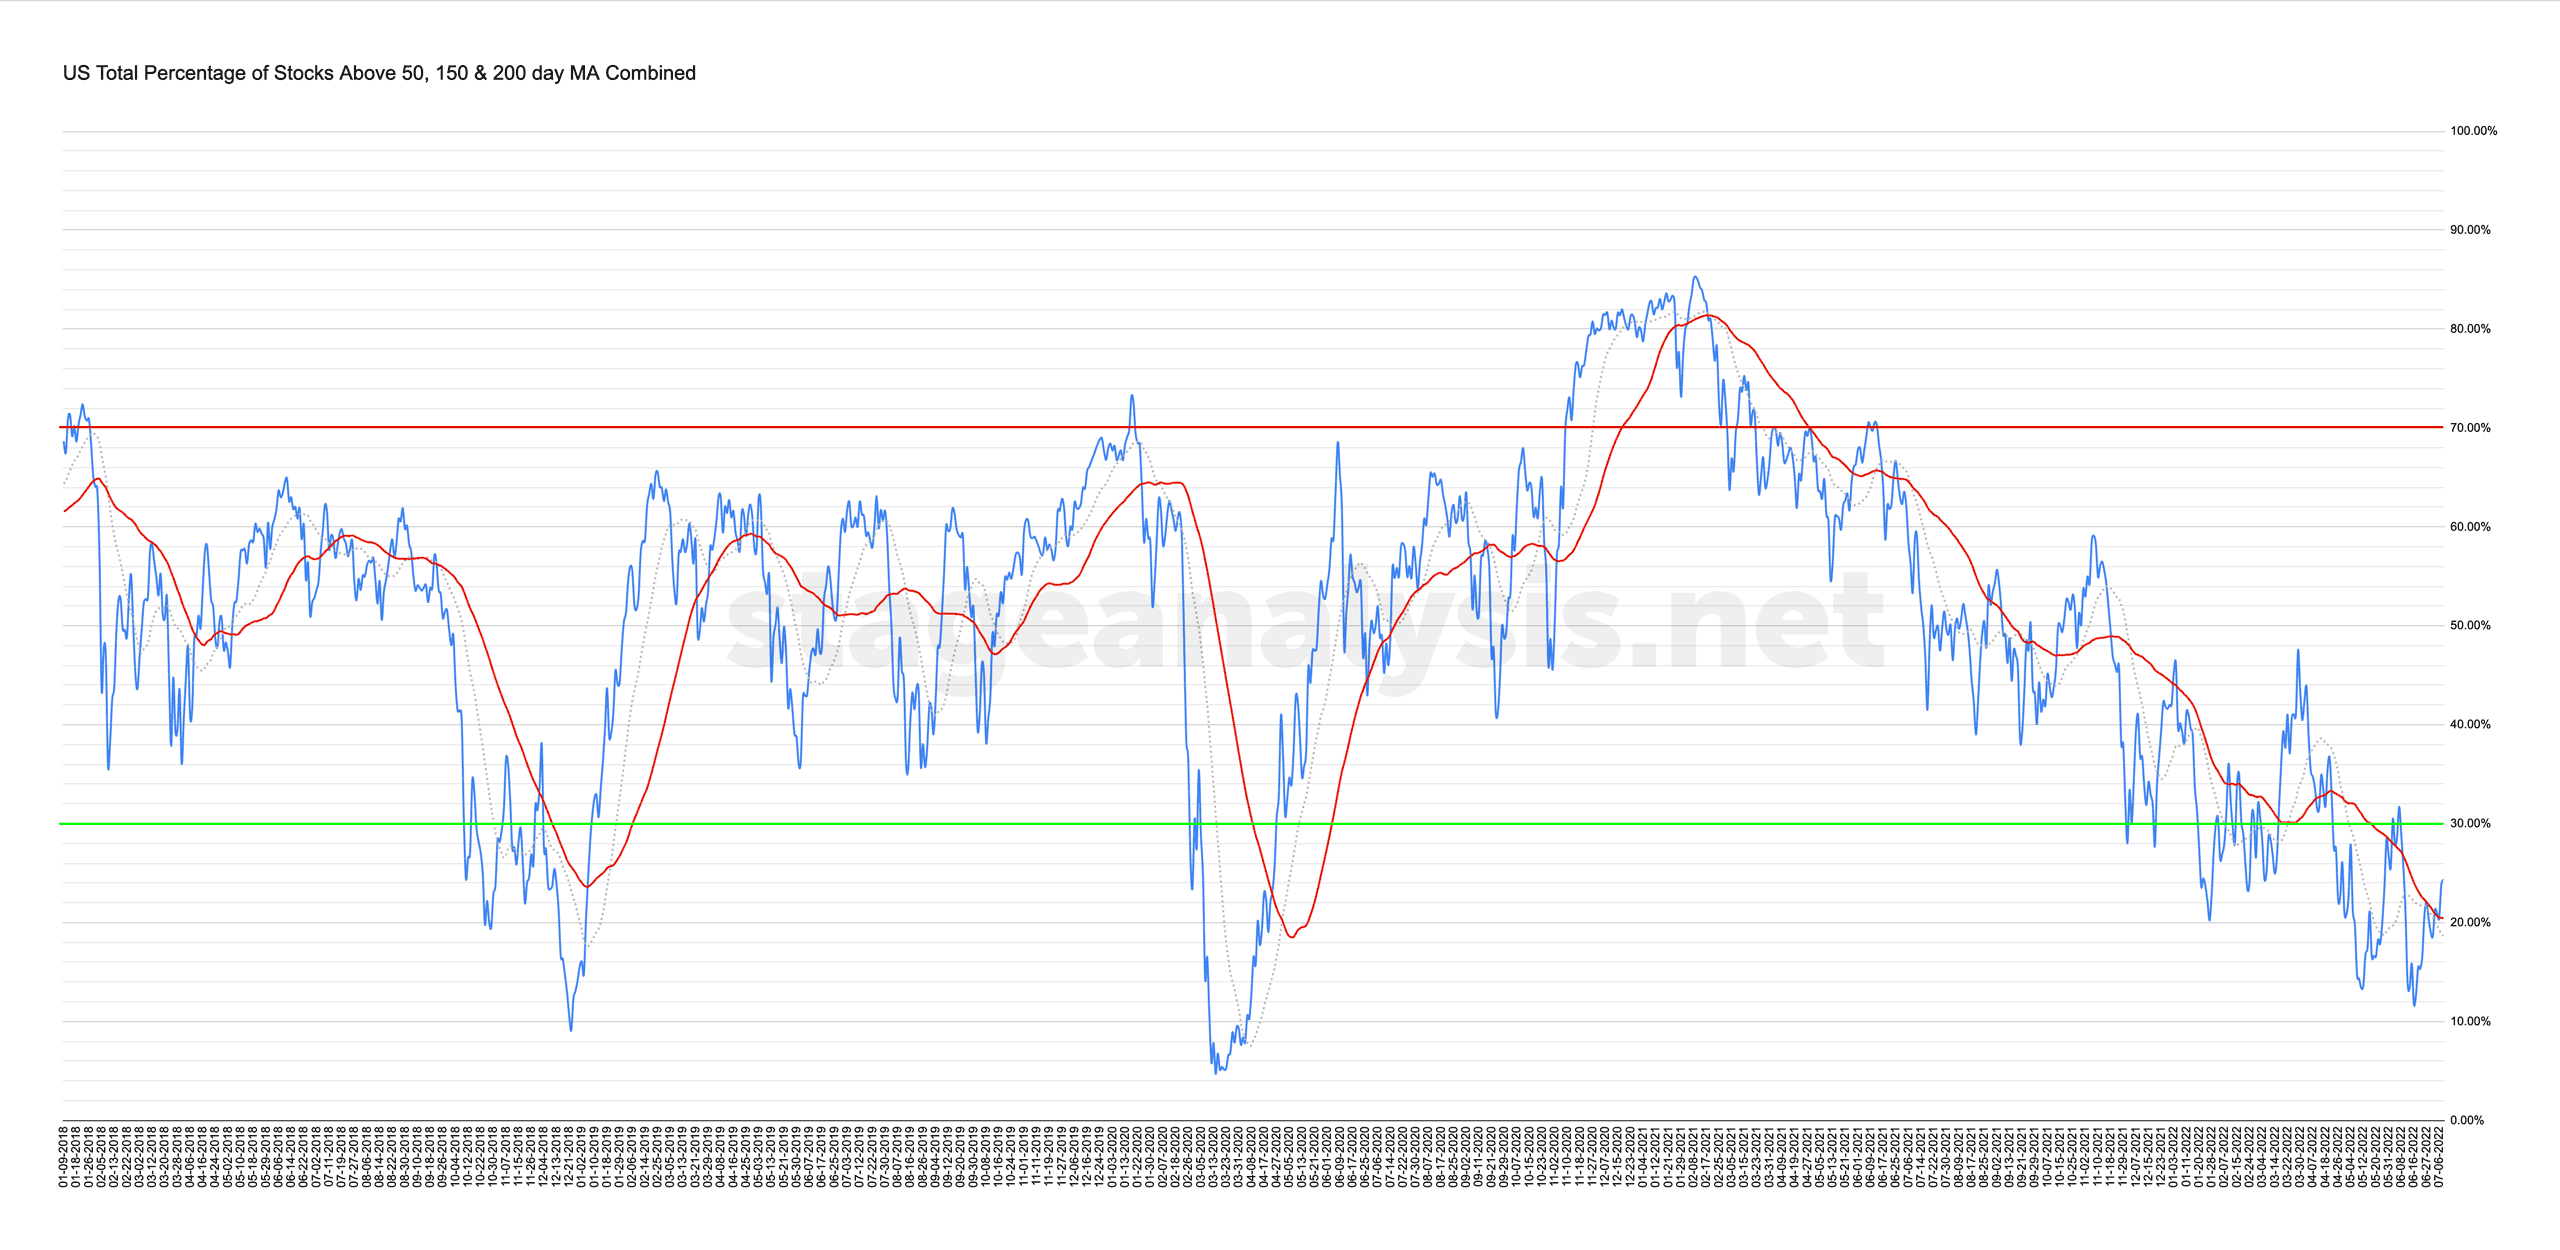
24.26% (+2.99% 1wk)
Status: Neutral / Tentative Positive Environment in Stage 4 zone
The US Total Percentage of Stocks Above their 50 Day, 150 Day & 200 Day Moving Averages consolidated around its own 50 day MA that we use for the signal line until Wednesday, and then moved more convincingly above on Thursday and Friday, closing at the high of the week. So last weeks status change a Neutral environment again gets upgraded to a slightly better Neutral / Tentative Positive Environment, but with the caveat that it's still in the lower zone in Stage 4, and so it's by no means confirmed and could easily flip the other way again. But it does show an attempt by the market to rebound, so look for further expansion, especially a breadth thrust, which would give more confidence that it is turning. Until then it is another baby step and suggests looking for stocks in late Stage 1 / early Stage 2 – if you can find them, there aren't many – to start to look for potential early leaders if the breadth continues to improve.
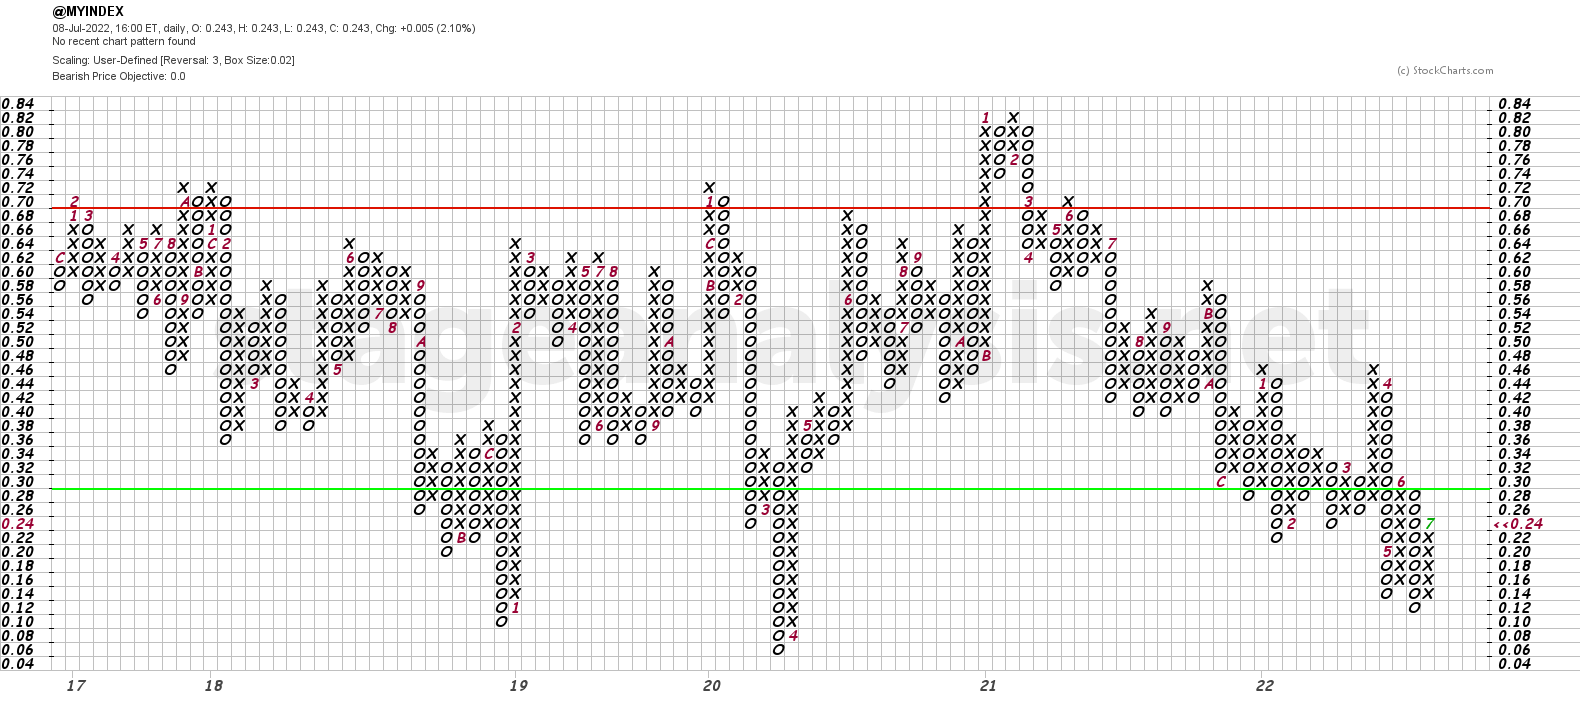
The Point and Figure chart added another X to its current column and remains on Bull Alert status in the lower zone. To move to Bull Confirmed status currently it would need to move a further 4 boxes, above 32%. Which is around another 8% higher yet.
Strategy:
Improvement to Neutral / Tentative Positive Environment with P&F column in Xs in the lower zone in Stage 4
- Offense (column of Xs)
- Point & Figure Bull Alert status
- Progressive Exposure – potentially starting to add some long exposure with small test positions. But only increasing exposure if account progress is made. i.e. no need to get more than 25% invested unless positive account progress is giving you a reason to increase your exposure.
- High cash level, but starting to deploy some cash via progressive exposure technique.
- ETFs can be a lower-risk way to get exposure to certain groups or indexes if setups are lacking.
- On watch for signs of developing relative strength (i.e. stocks outperforming the market averages near term since the low) – this may come from more speculative areas of the market that have been appearing in the watchlist scans recently.
- Build watchlists in groups showing signs of accumulation and building constructive bases with strong volume coming into the stocks in the group. So that you are ready to act when the stocks reach proper entry zones in Phases C to E of the bases. Or late Stage 1 / early Stage 2
- Swing/Day traders environment (long and short)
- Focus on risk management
- Risk remains extremely high as price action remains in a declining trend in Stage 4. So caution remains prudent. But the combined breadth continues to make progress higher in the short-term, so be on alert, as earnings kick off this week on Thursday with the financials, and so we could start to see a directional move develop out of the recent sideways range.
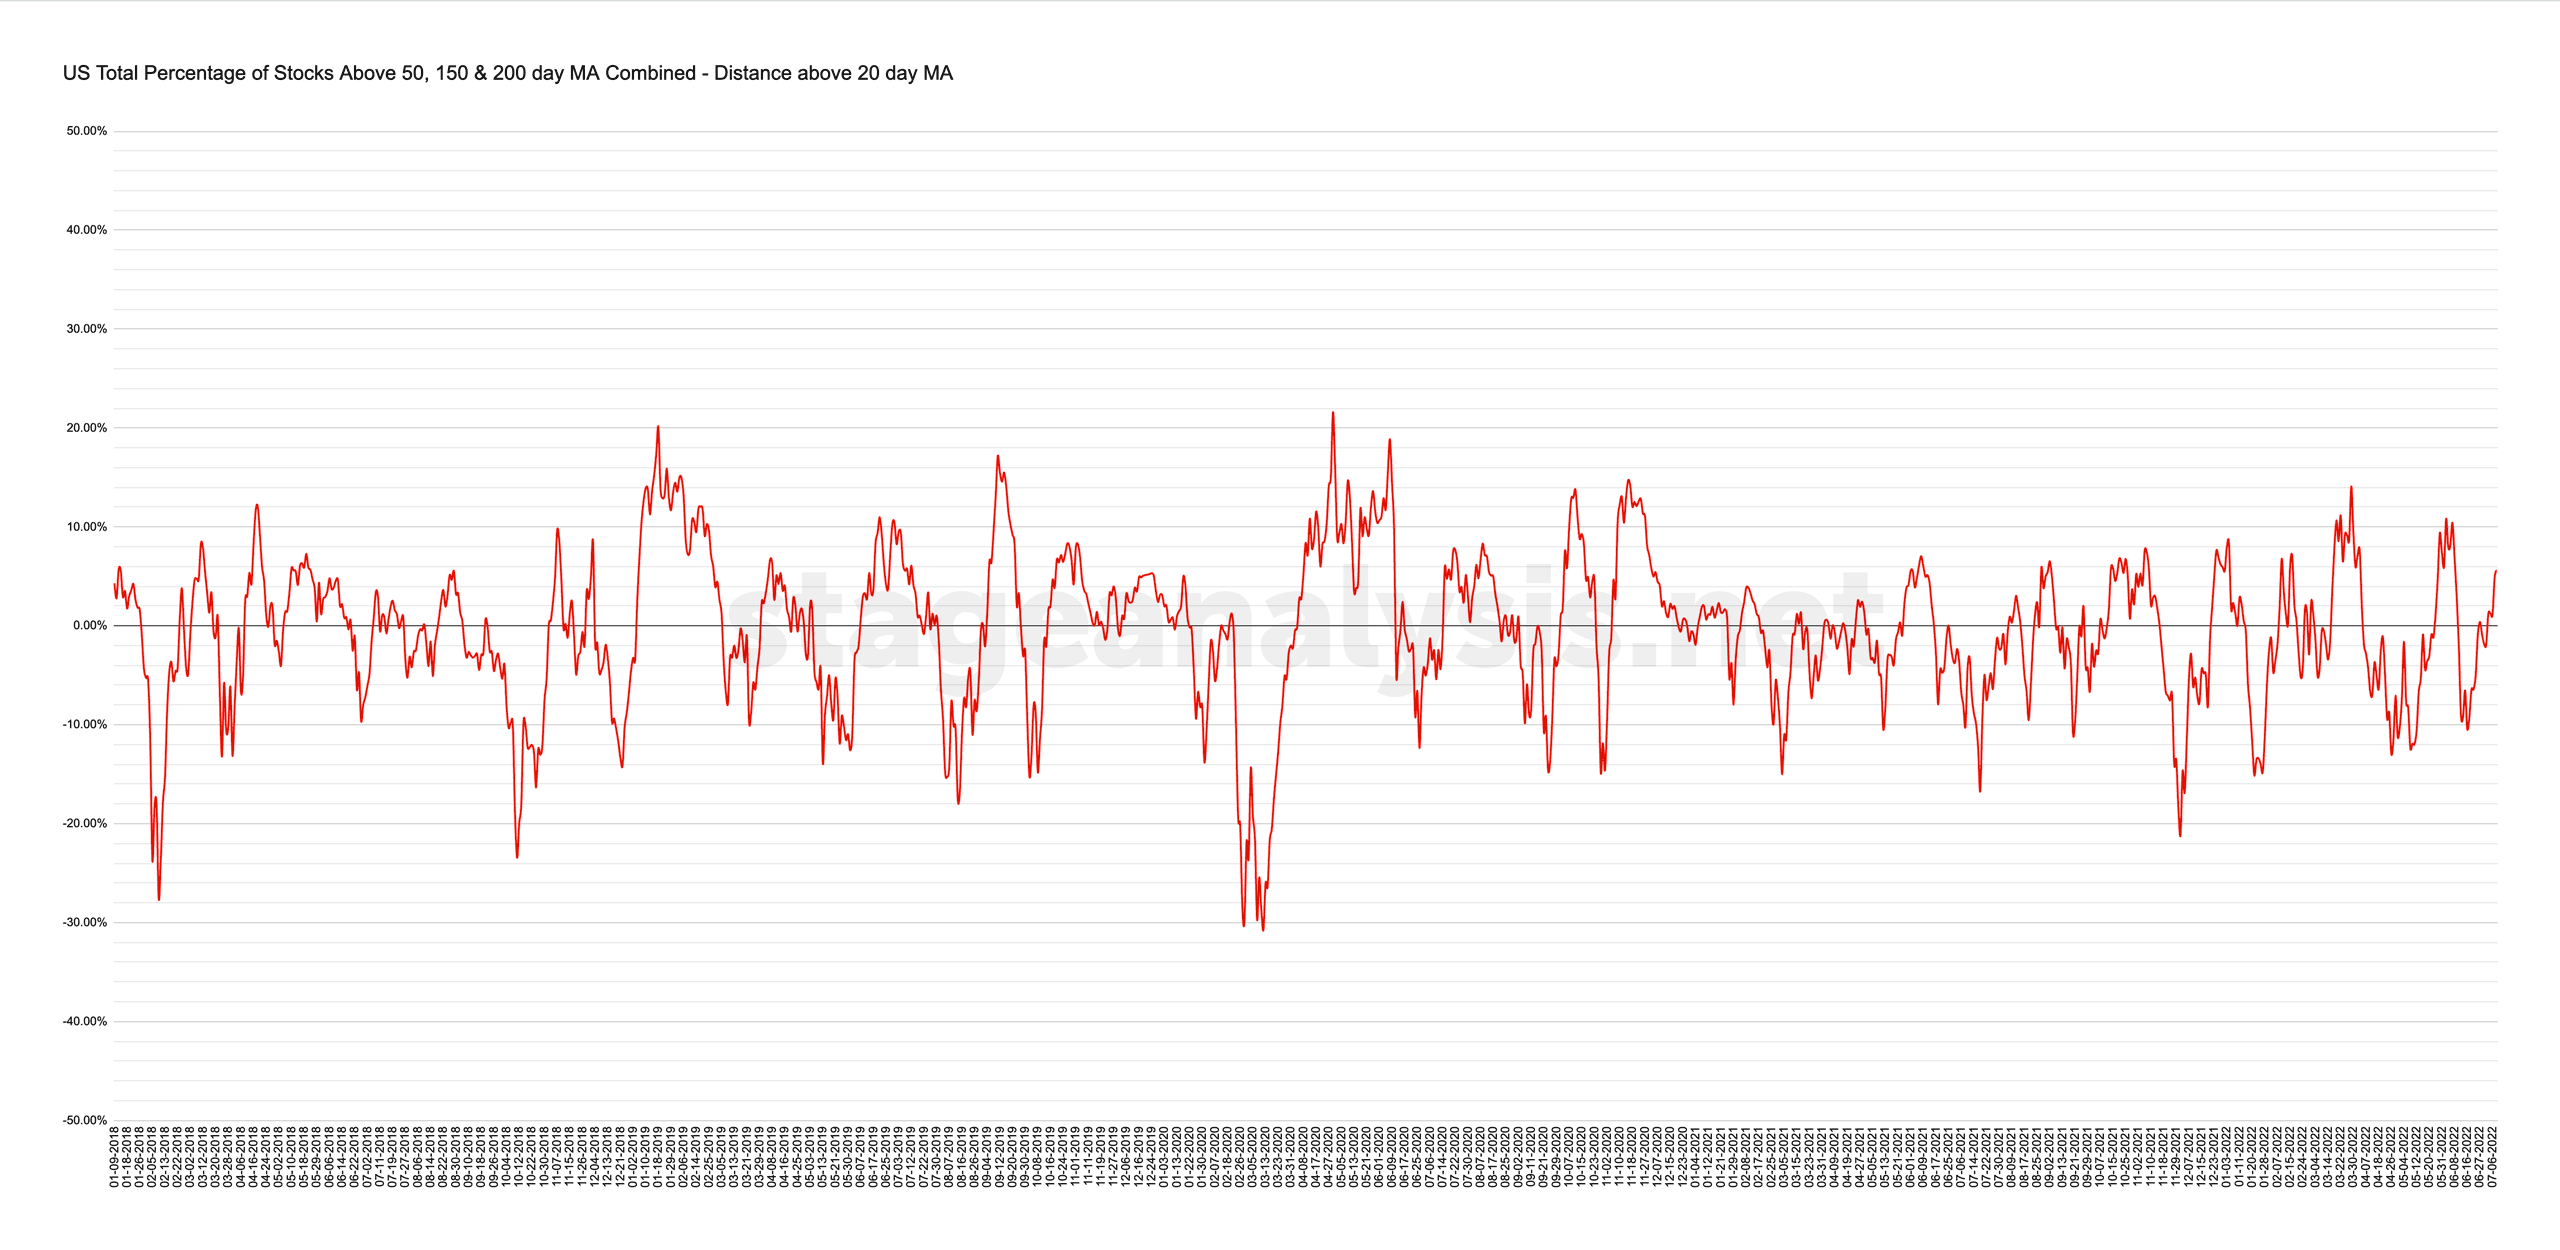
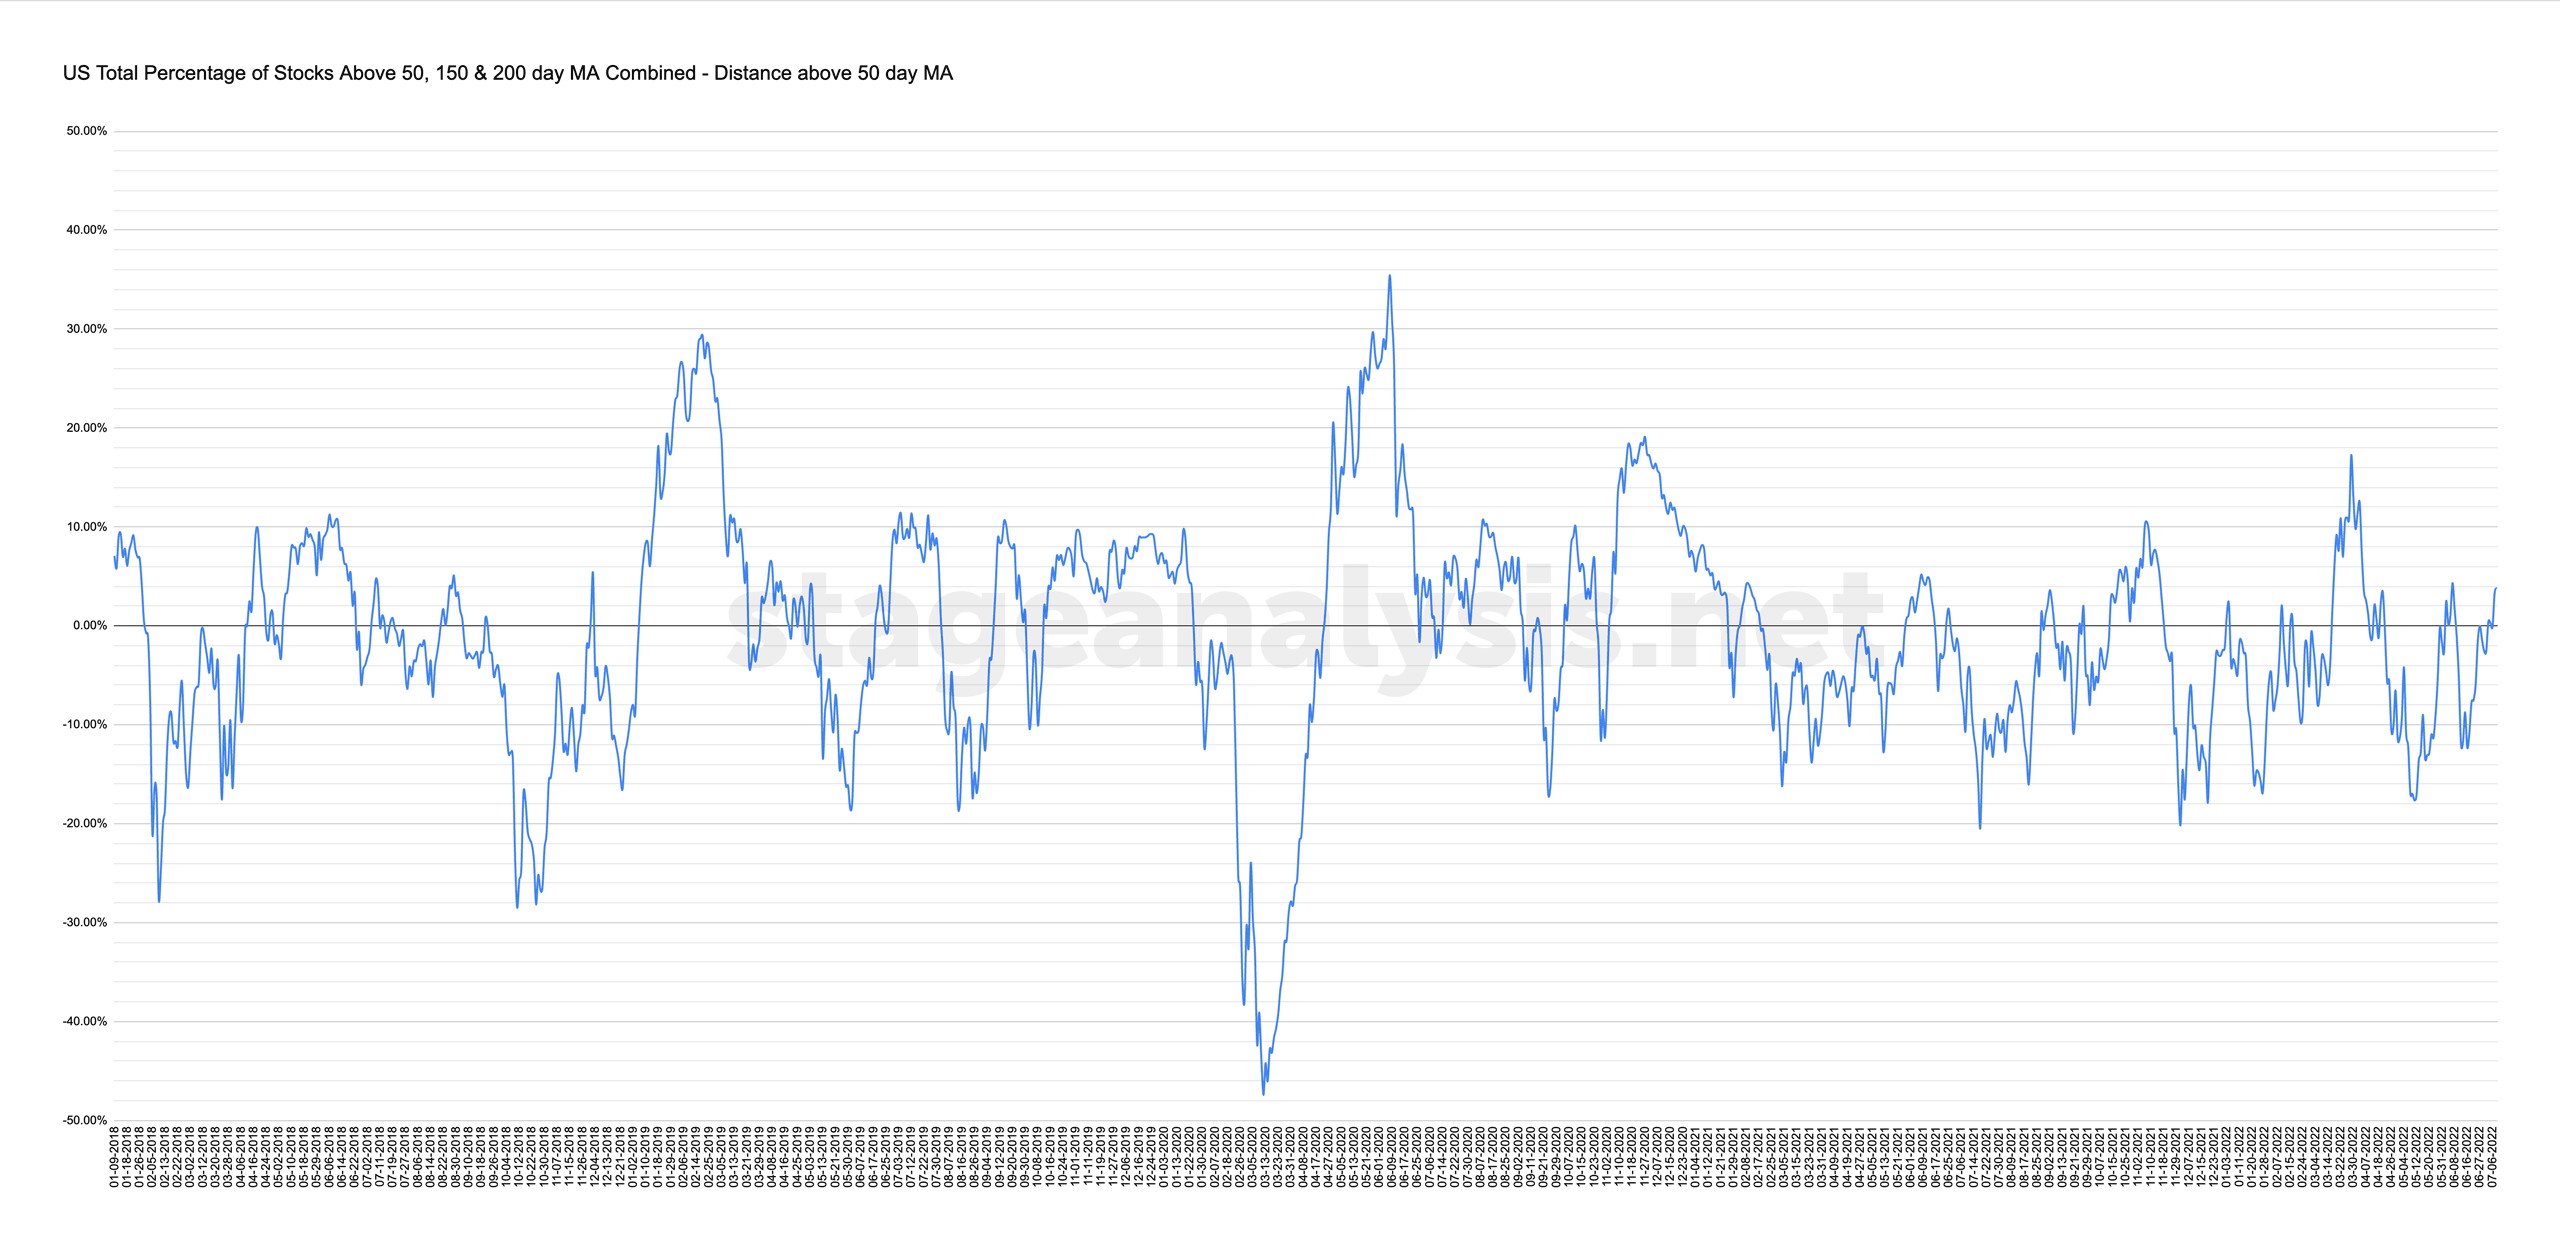
20 and 50-day Oscillator
These show the distance that the combined chart is from the 20-day MA and 50-day MA on the chart. Above the zero is a positive environment and below is a difficult/negative environment.
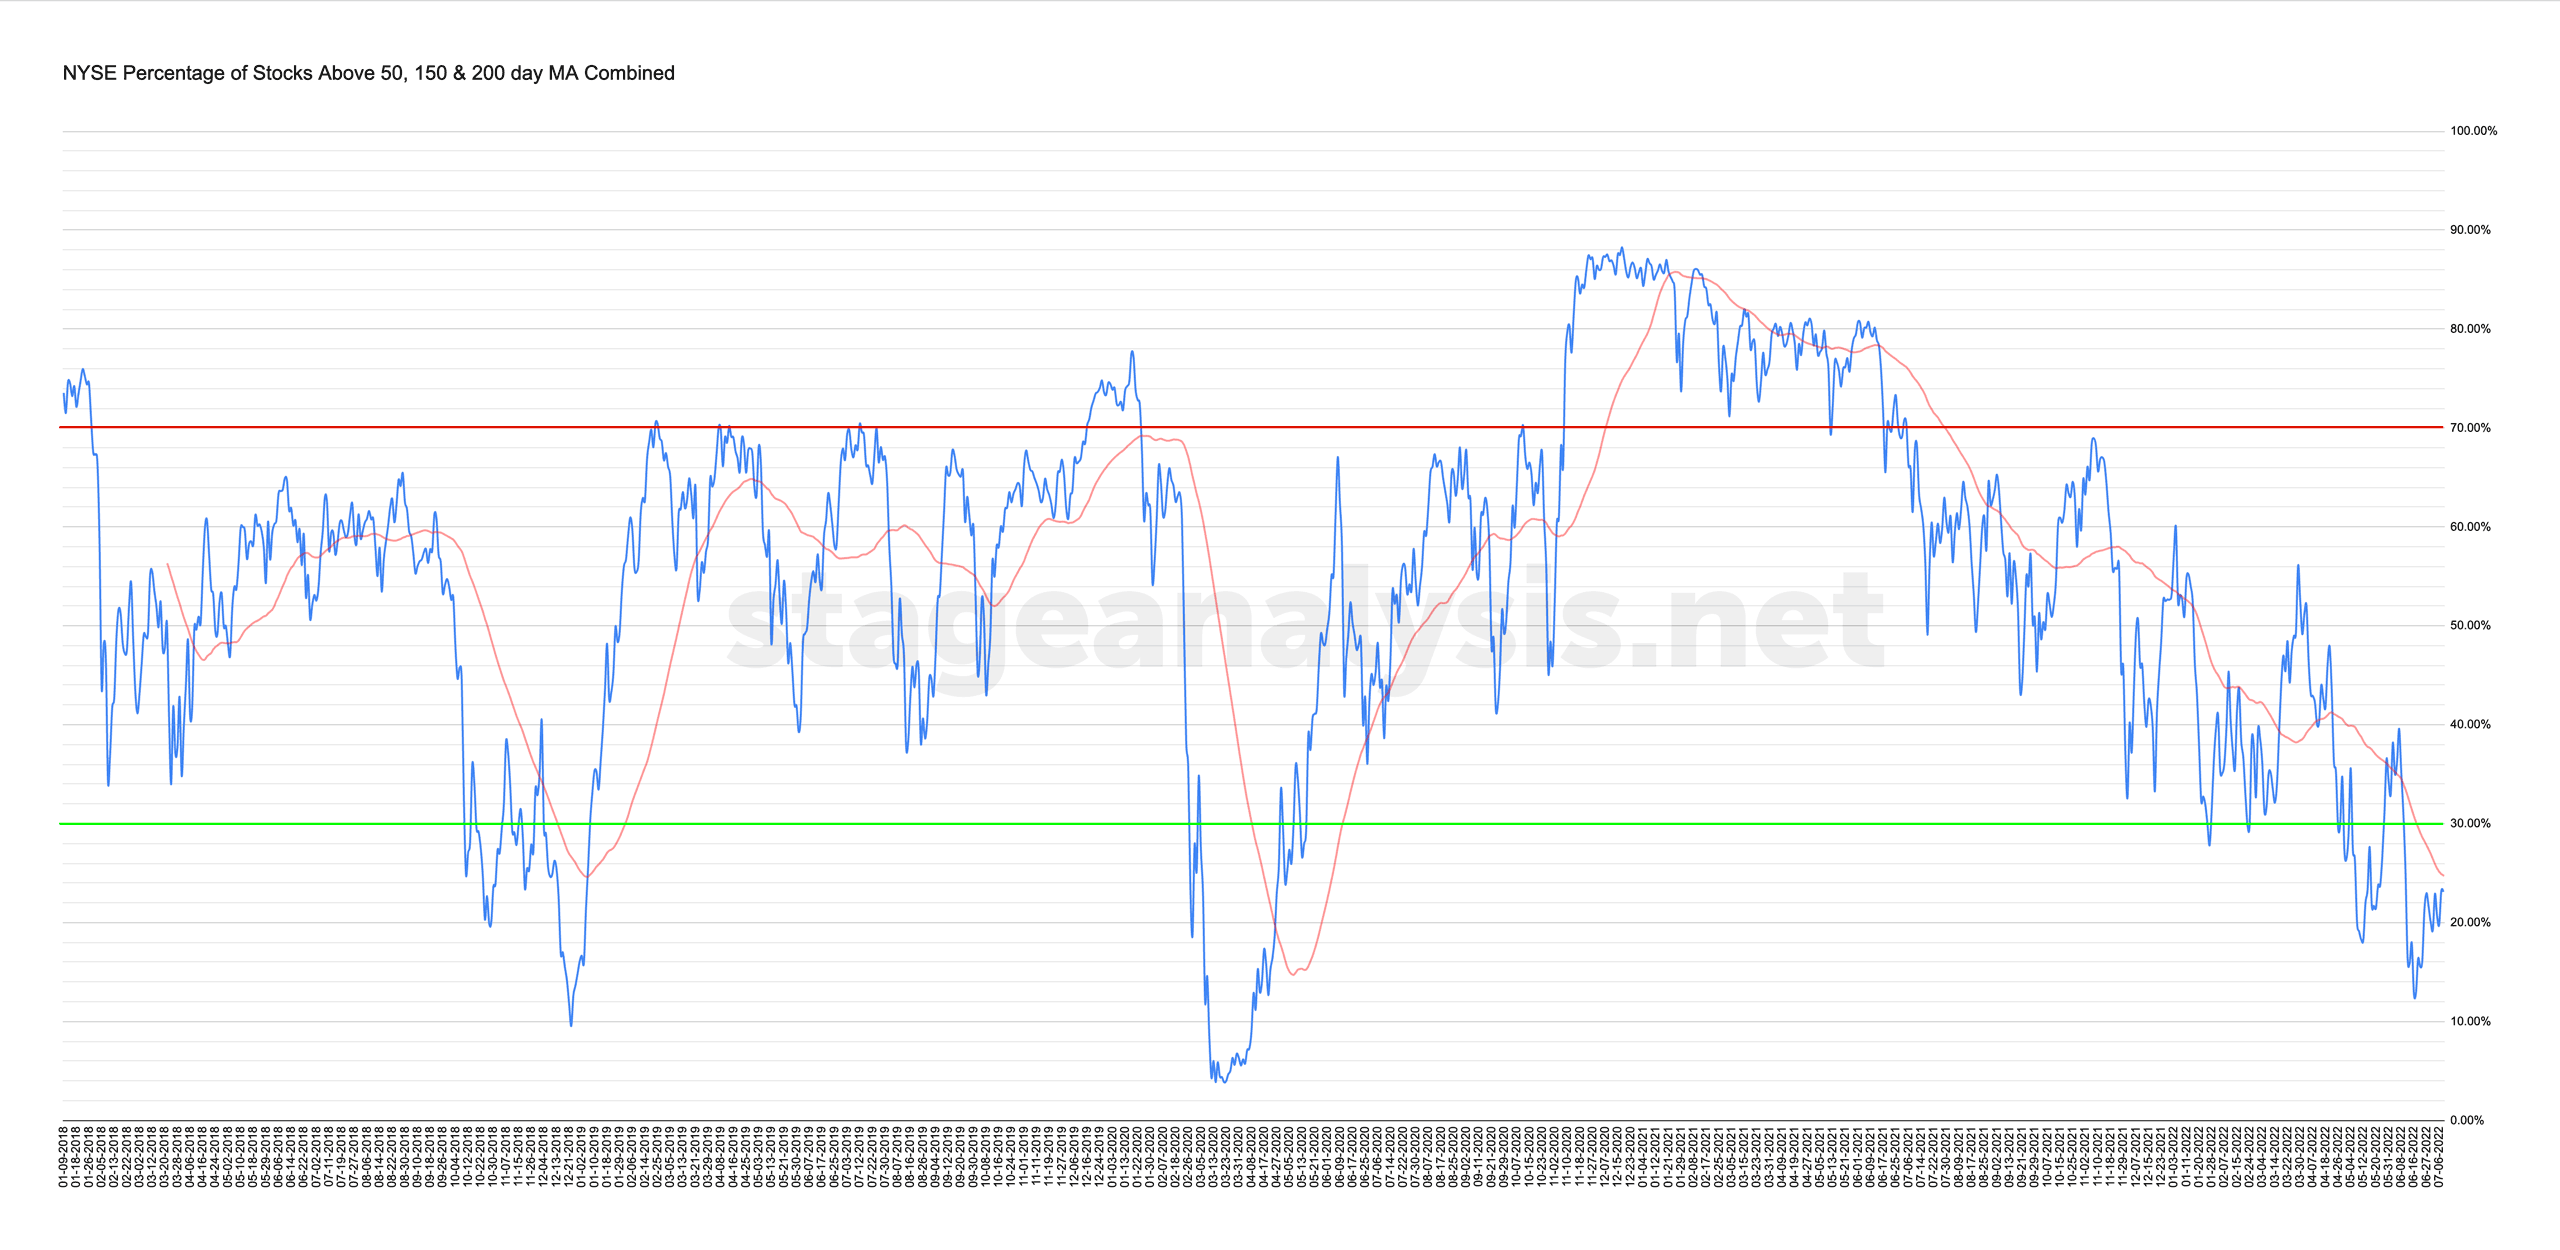
NYSE Total % Stocks Above their 50 Day, 150 Day & 200 Day Moving Averages Combined
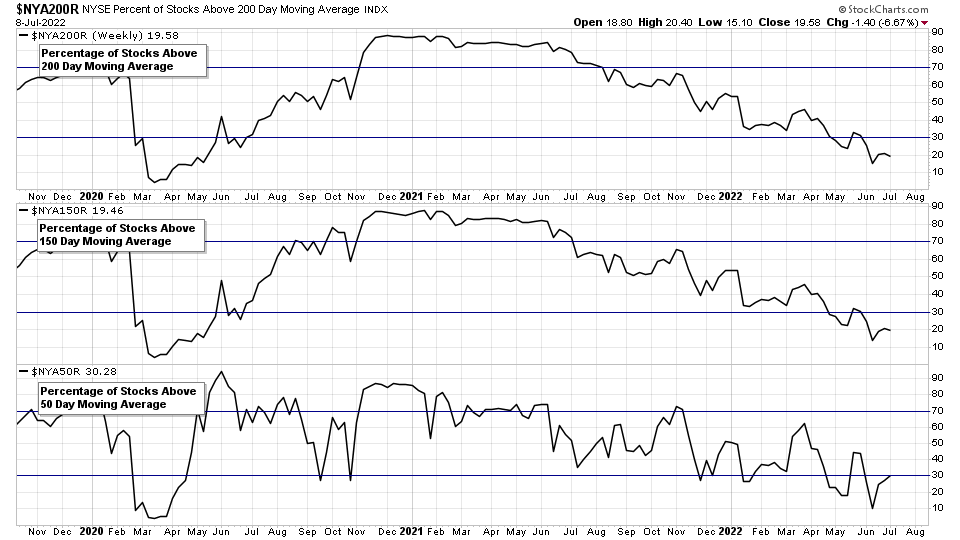
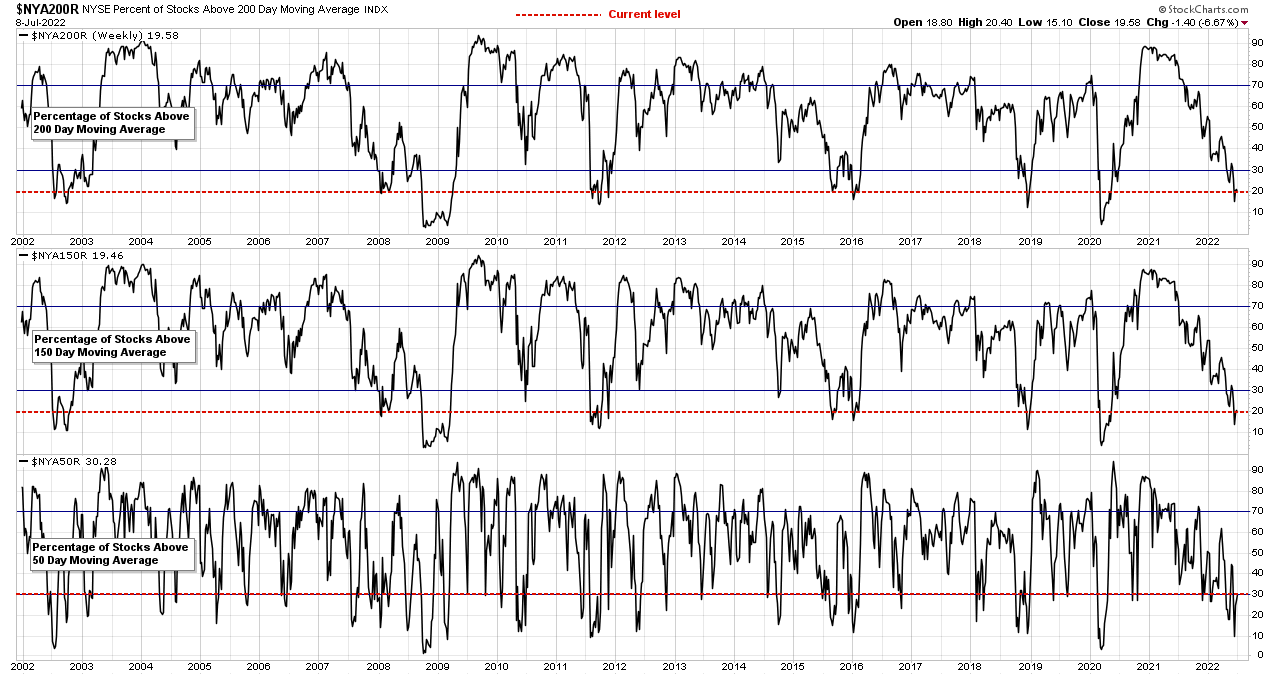
- Long Term: Stocks Above 200 Day MA: 19.58%
- Medium Term: Stocks Above 150 Day MA: 19.46%
- Short Term: Stocks Above 50 Day MA: 30.28%
23.10% (+0.19% 1wk)
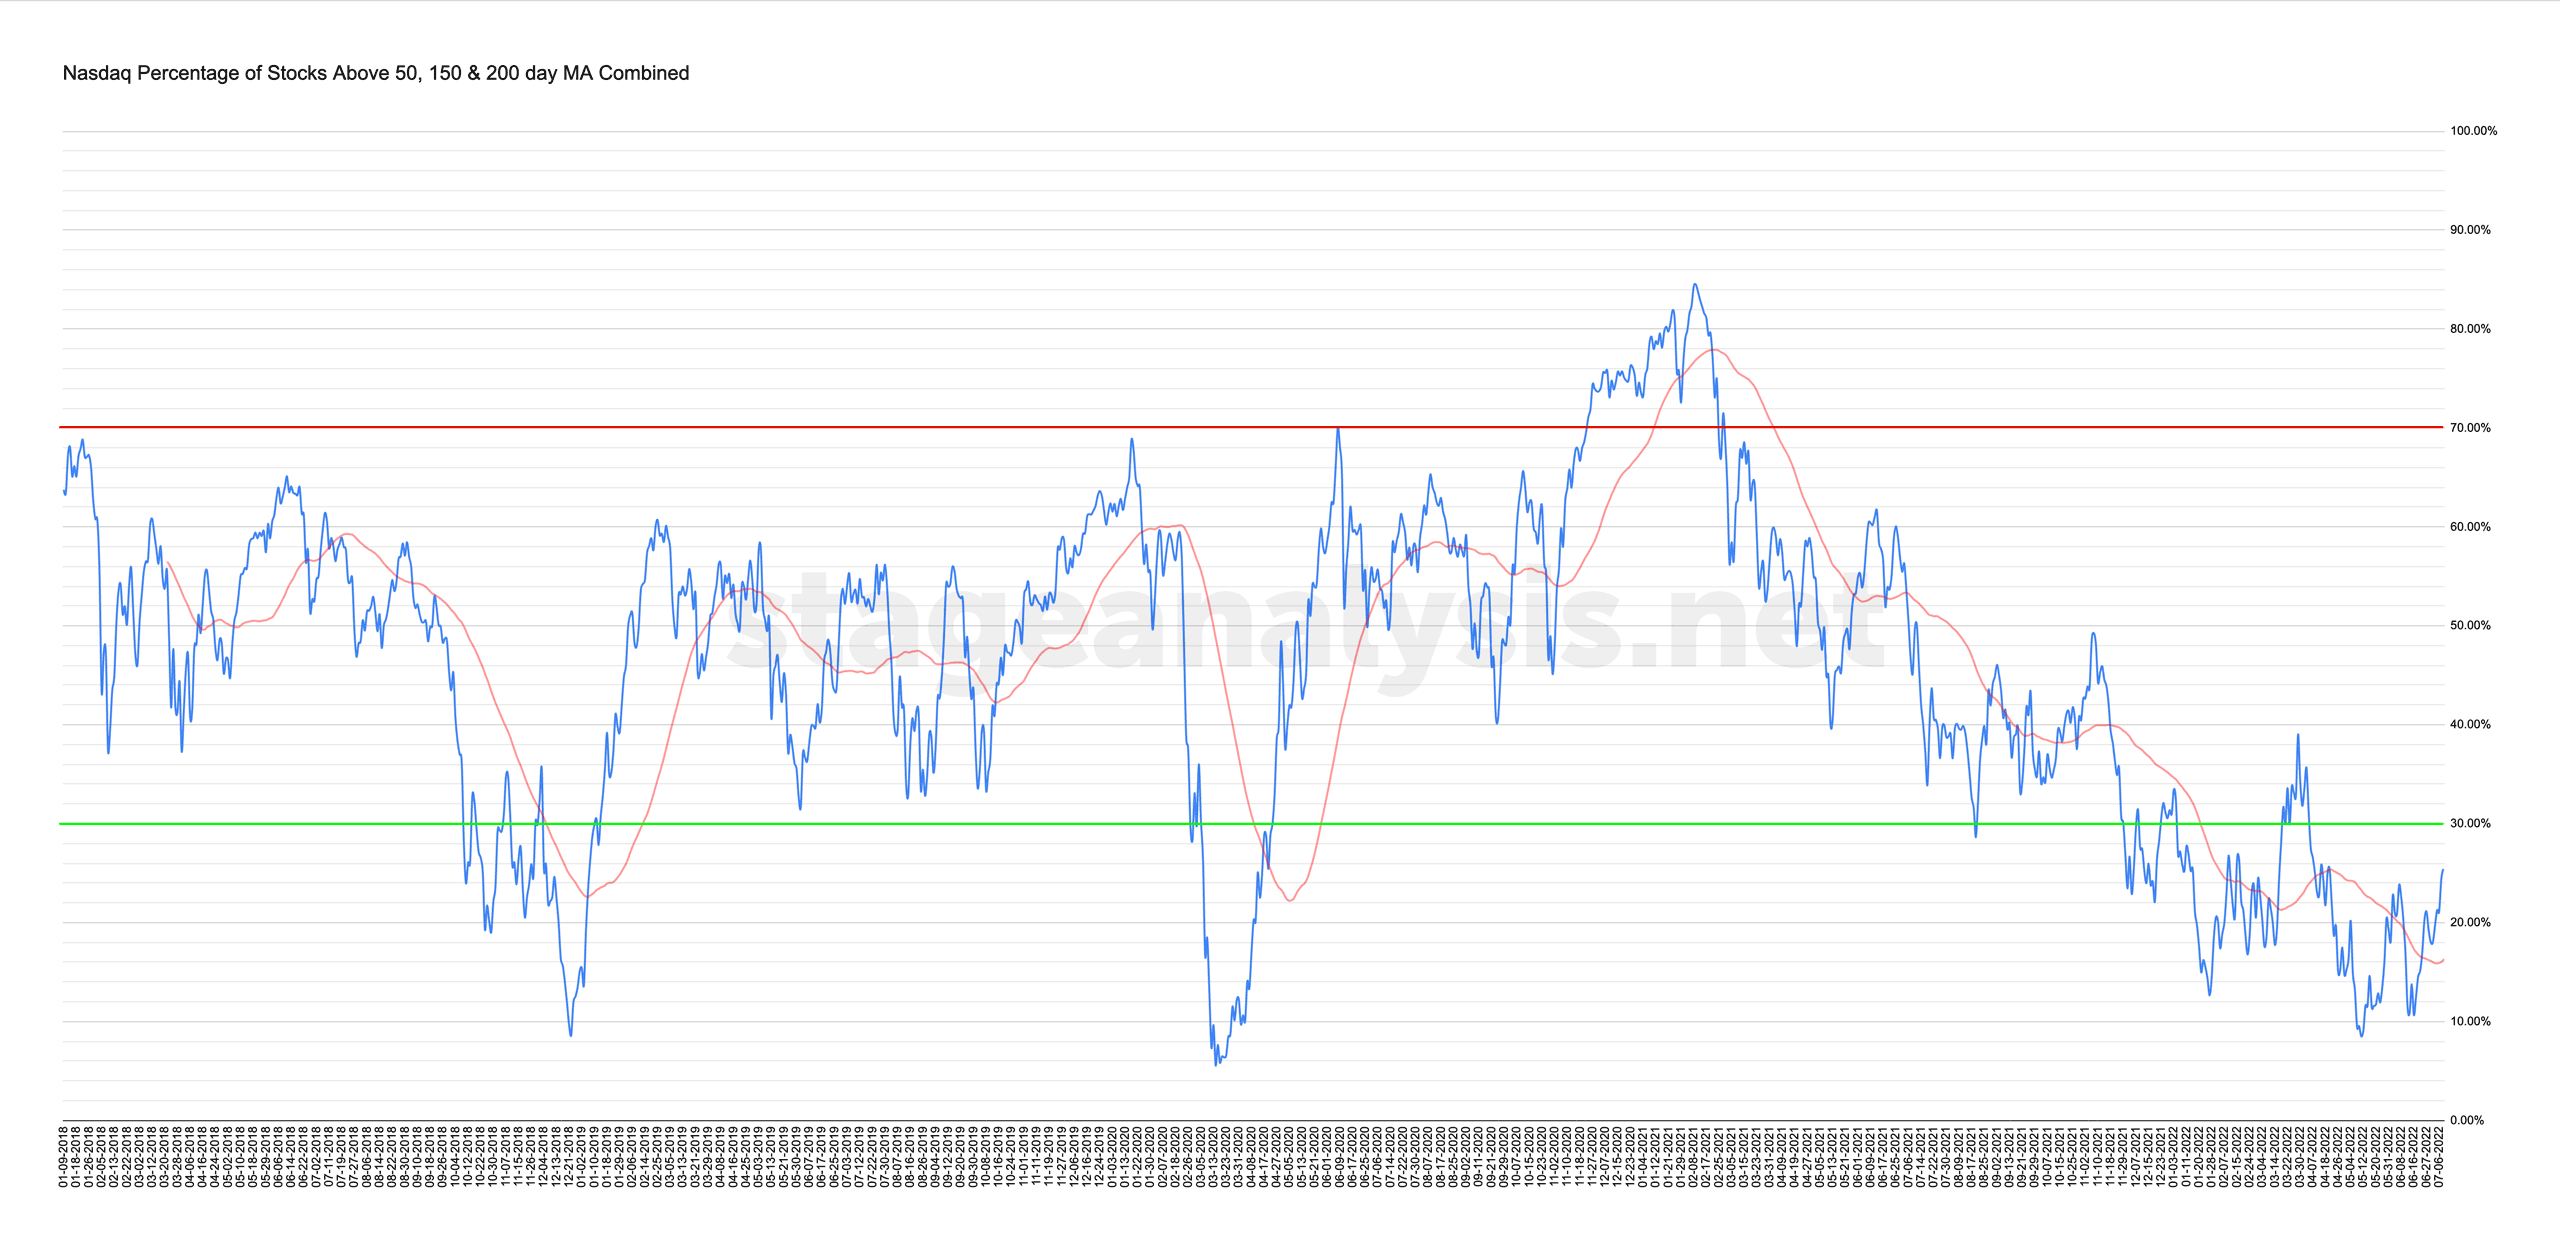
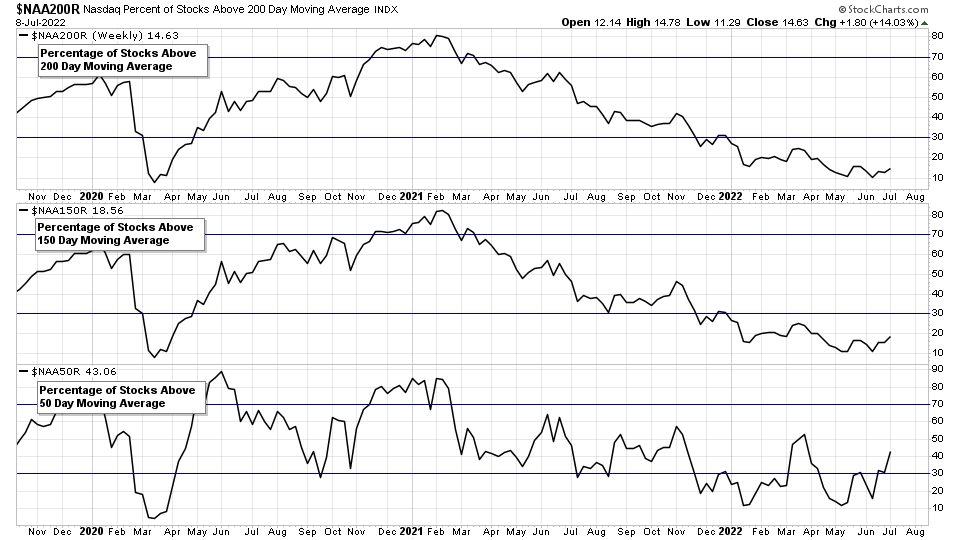
Nasdaq Total % Stocks Above their 50 Day, 150 Day & 200 Day Moving Averages Combined
- Long Term: Stocks Above 200 Day MA: 14.63%
- Medium Term: Stocks Above 150 Day MA: 18.56%
- Short Term: Stocks Above 50 Day MA: 43.06%
25.42% (+5.79% 1wk)
Note: The Nasdaq combined chart made a double top breakout this week, and has formed a higher low and higher high and is above its own 50 day MA, and so moves to Positive Environment status. But keep in mind that it's still in the lower Stage 4 zone. So risk remains high, but is showing near term outperformance versus the NYSE.
Become a Stage Analysis Member:
To see more like this – US Stocks watchlist posts, detailed videos each weekend, use our unique Stage Analysis tools, such as the US Stocks & ETFs Screener, Charts, Market Breadth, Group Relative Strength and more...
Join Today
Disclaimer: For educational purpose only. Not investment advice. Seek professional advice from a financial advisor before making any investing decisions.