
US Stocks Industry Groups Relative Strength Rankings
The full post is available to view by members only. For immediate access:
US Industry Groups by Highest RS Score
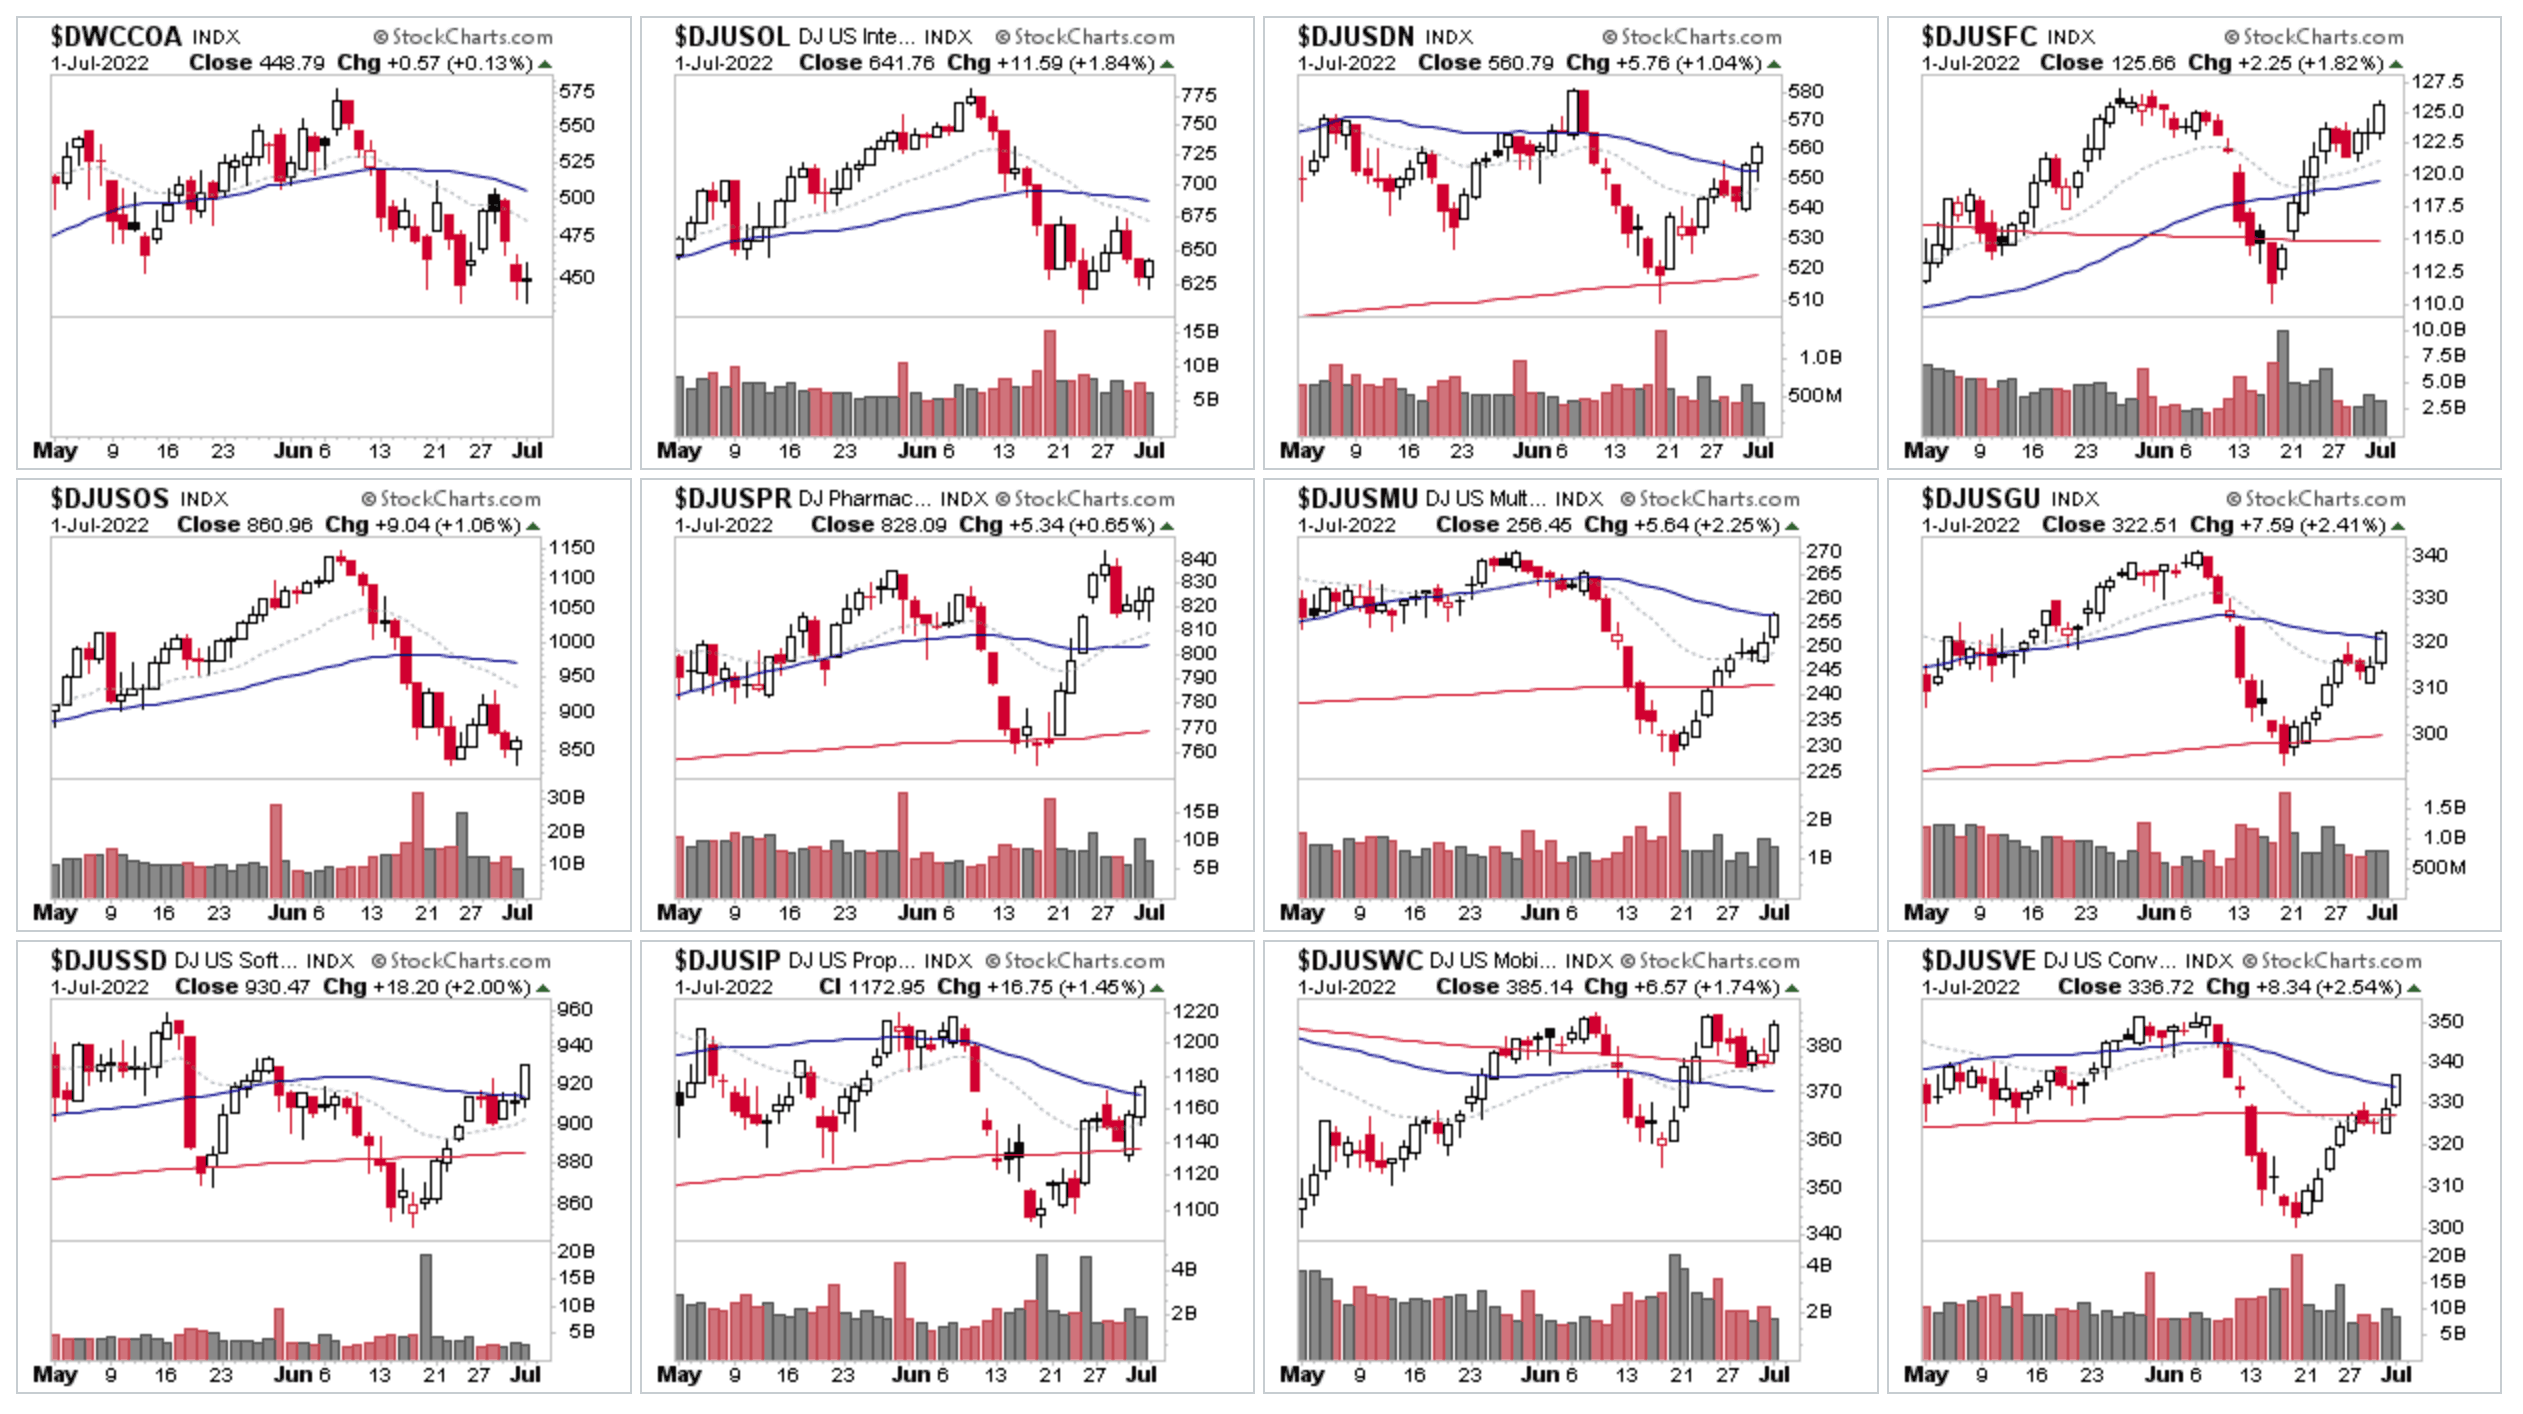
A few changes in the top 12 groups this week with a defensive theme as three Utilities sector groups moved up the Relative Strength (RS) rankings and into the top 12.
Energy groups Coal and Integrated Oil & Gas remain at the top of the RS rankings for another week, but the early Stage 3 behaviour that I've been highlighting for a while now in the Energy sector continues to develop, and so there's a chance that they'll lose their leadership spots in the coming weeks / months, as we've already seen with two of the Energy sector groups and as the potential Stage 3 in those groups continues to form, while other groups start to show more consistent RS gains and rise up the rankings.
Currently that's the more defensive groups as the funds / institutions look for shelter from the major Stage 4 decline that the US market is in. But as we've seen on every strong counter trend rally attempt, that will quickly change with money being rotated to more speculative areas on any strong set of days. So, watch for which groups that institutional (large player) money flows into on those days, and via the changes in the RS table.
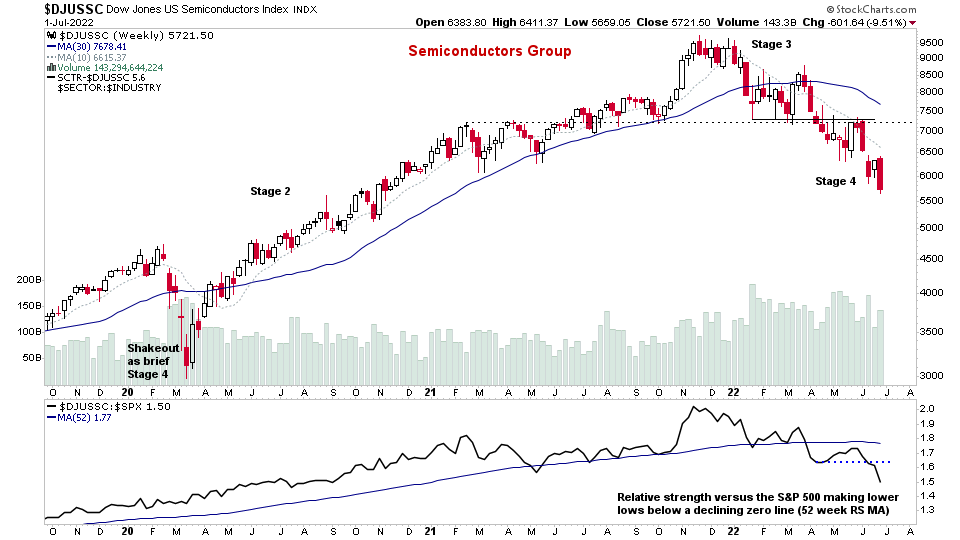
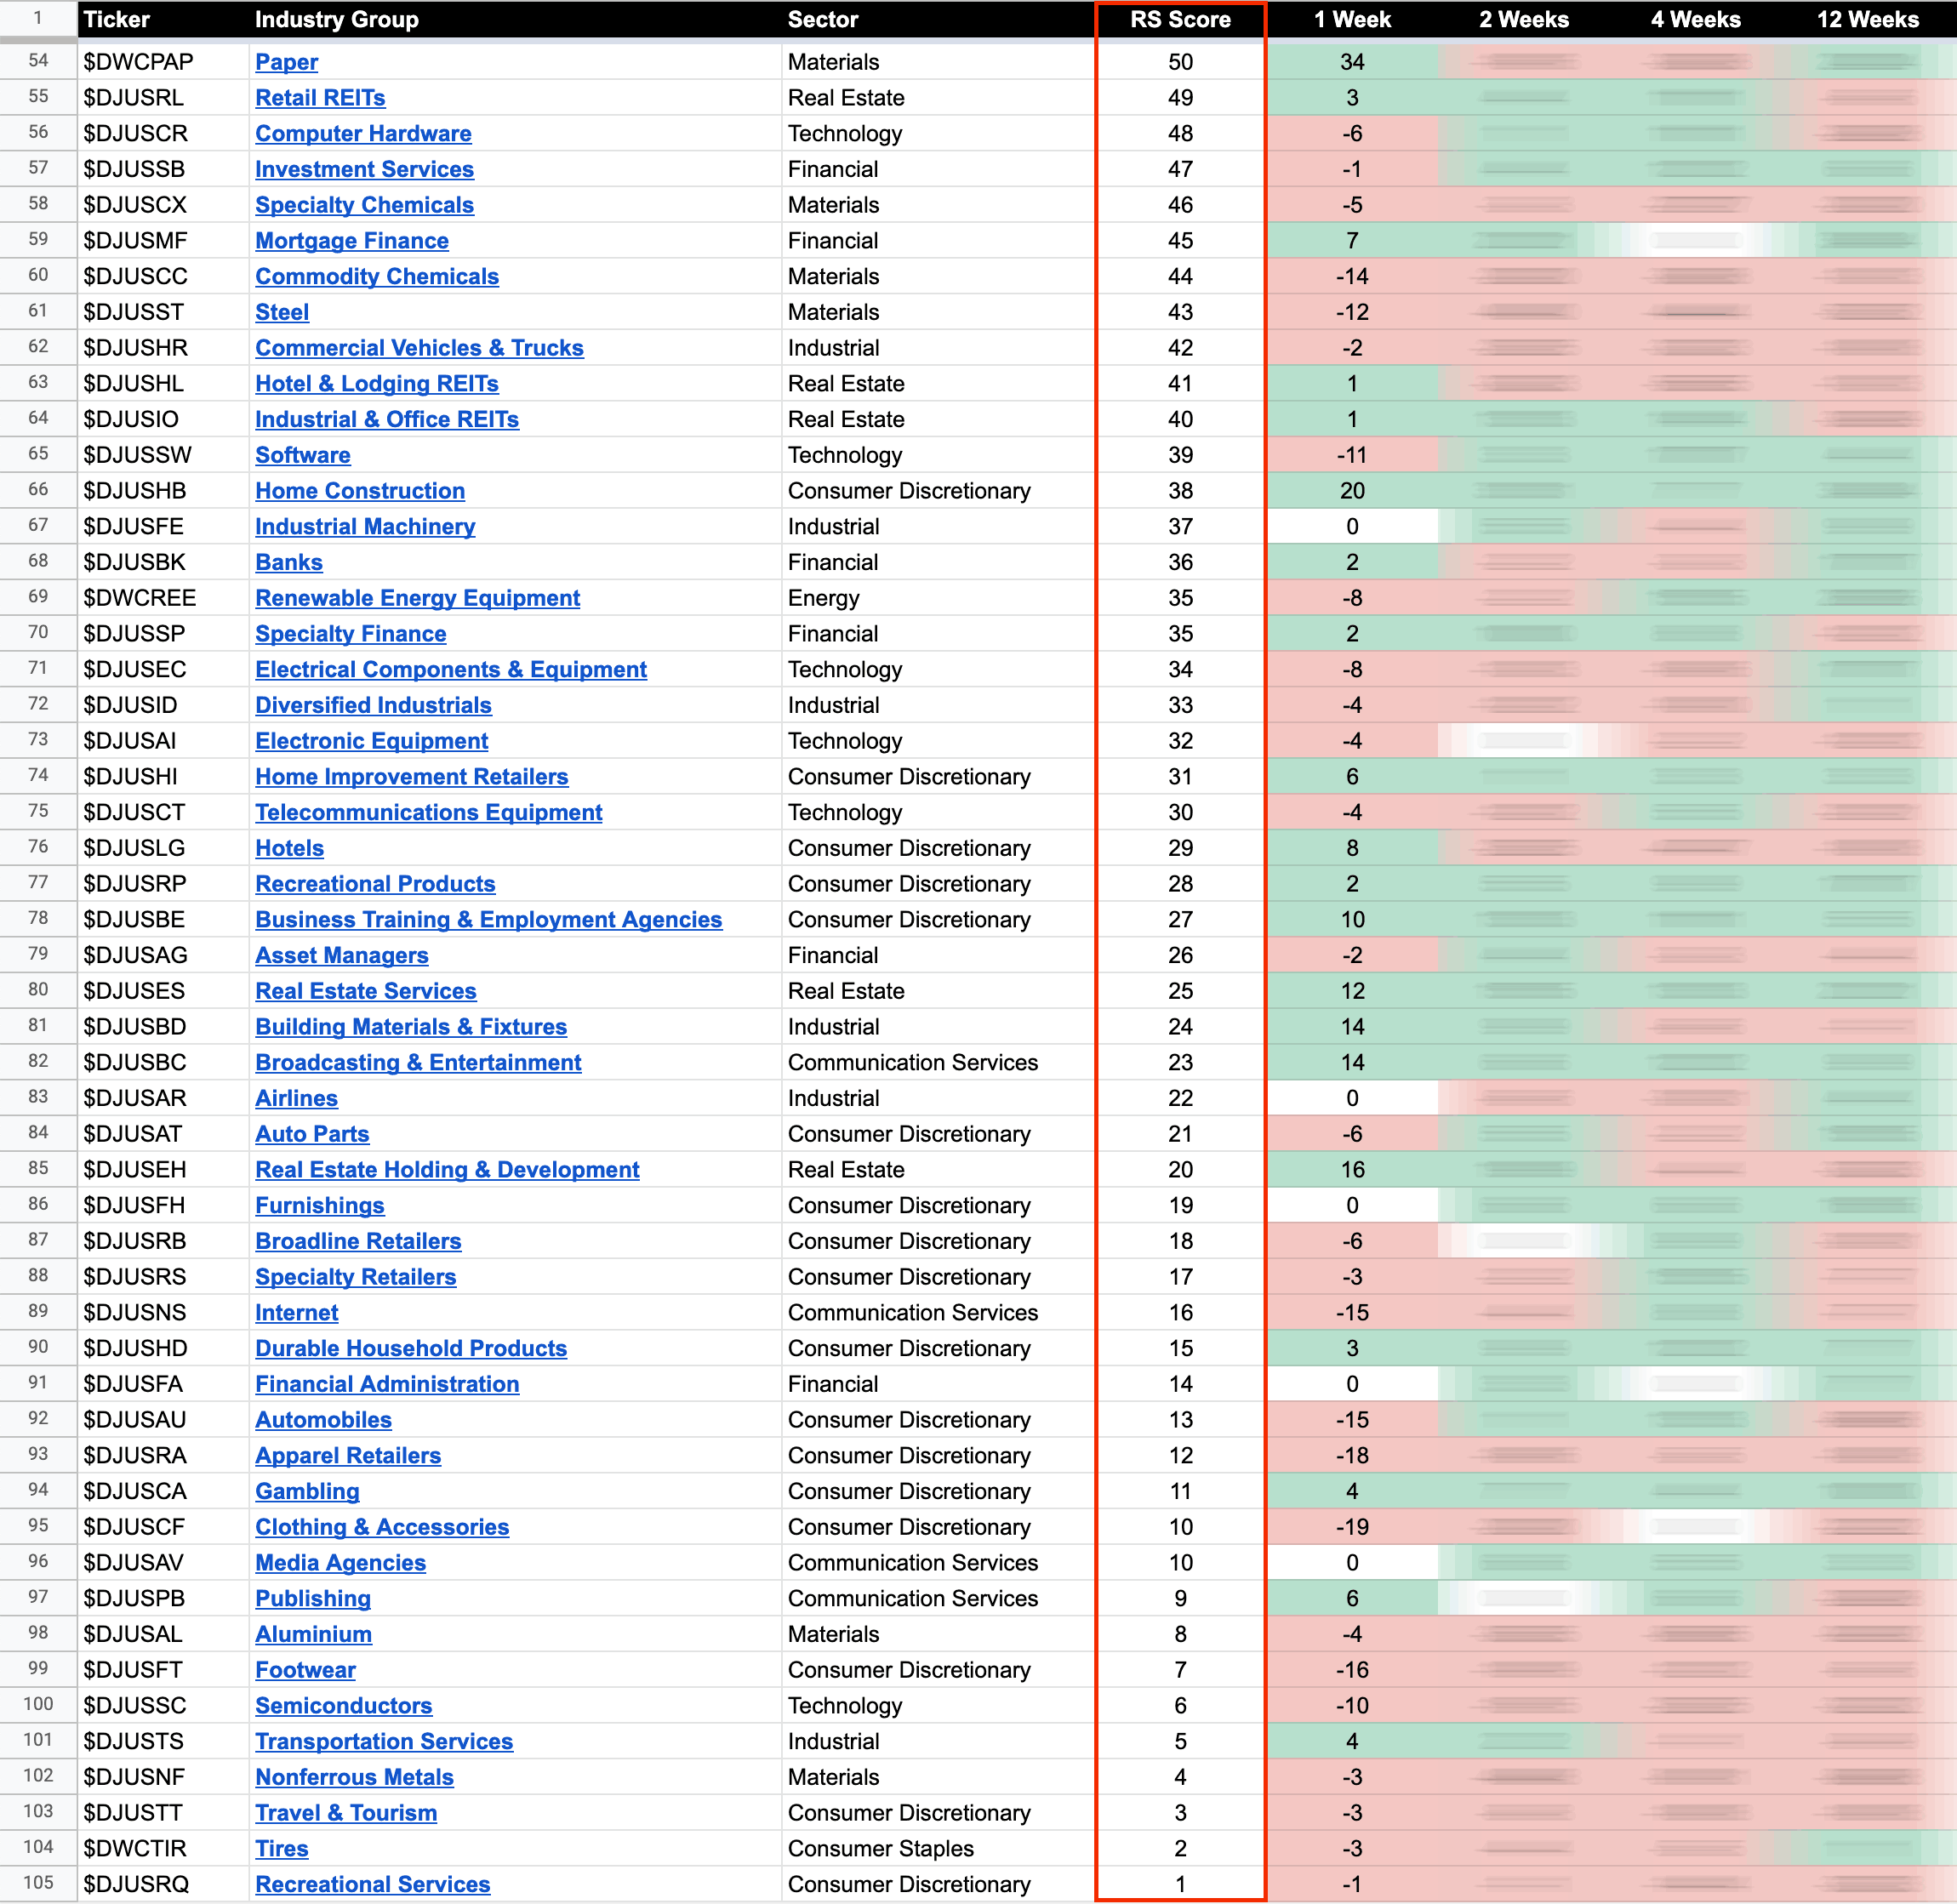
US Industry Groups by Weakest RS Score
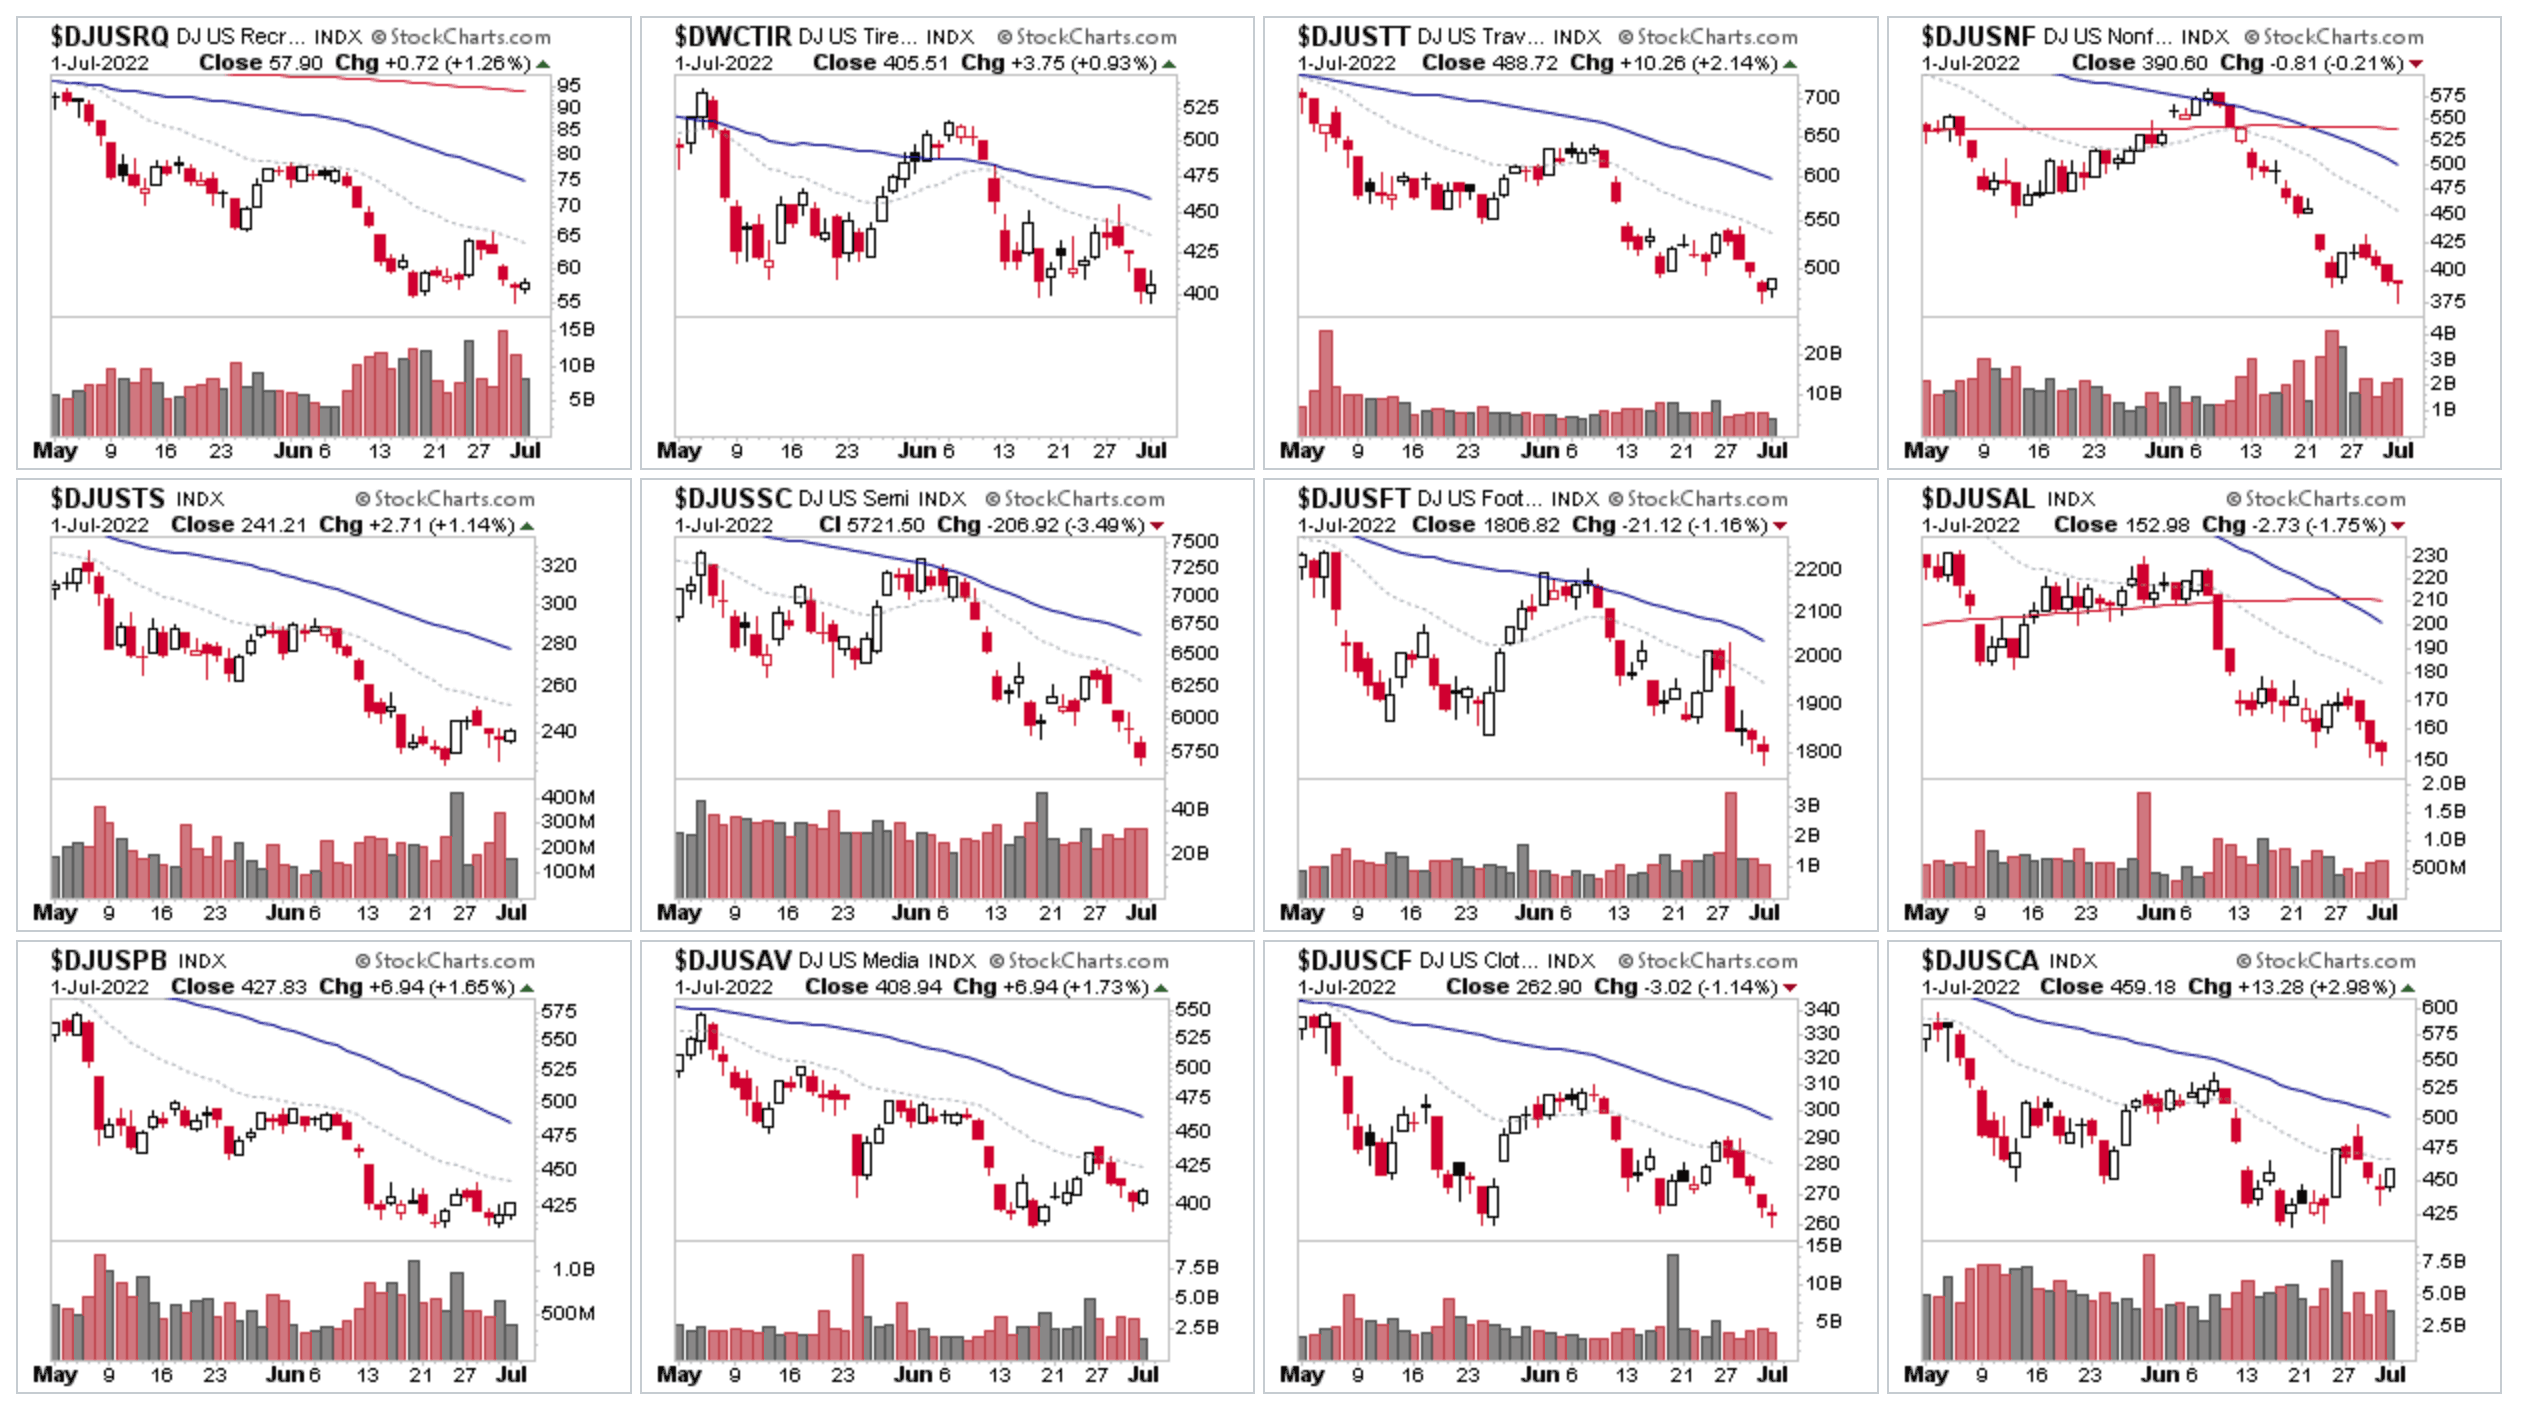
The bottom of the RS rankings table saw some changes also, with a few notable drops, but especially from the Semiconductors group, which is one of the groups that tends to rally strongly on the counter trend moves, but has continued to make lower lows once more within its Stage 4 decline (see below). With multiple stocks in the group making Stage 4 continuation breakdowns and few that had held up in Stage 3 in the group making the Stage 4 breakdown attempts for the first time today i.e. ACLS, KLAC, SITM etc.
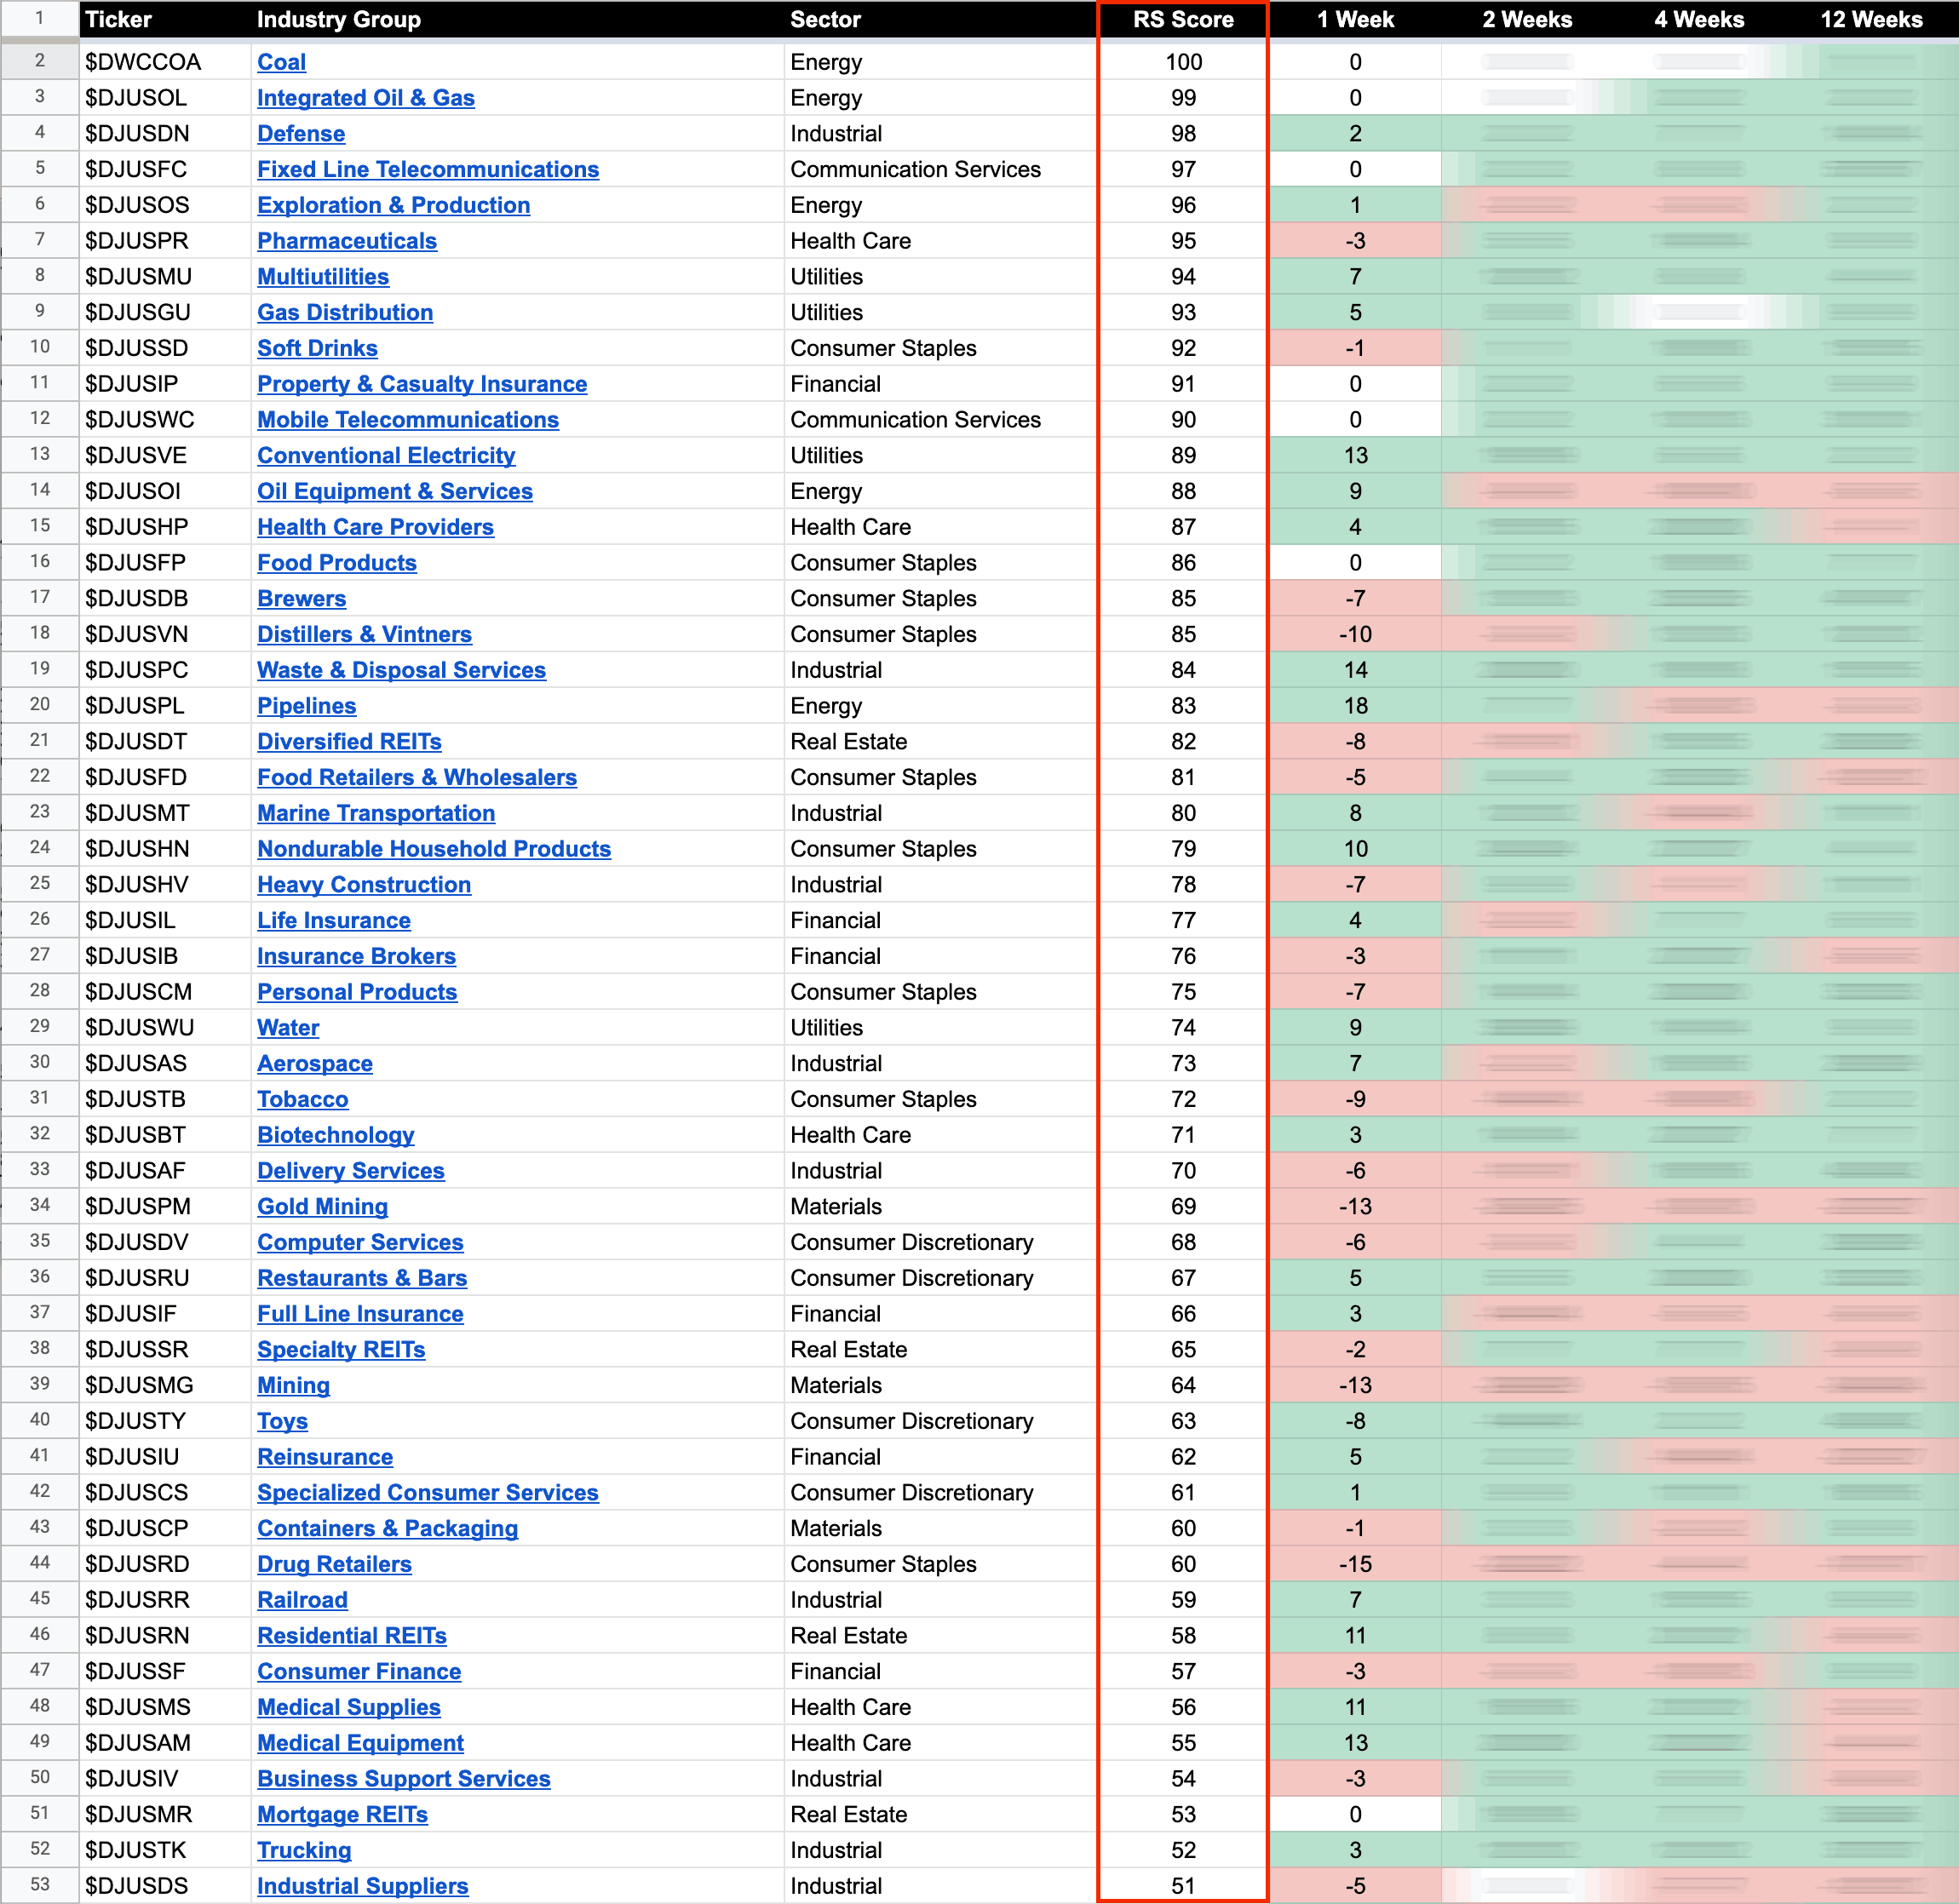
104 Dow Jones Industry Groups sorted by Relative Strength
The purpose of the Relative Strength (RS) tables is to track the short, medium and long-term RS changes of the individual groups to find the new leadership earlier than the crowd.
RS Score of 100 is the strongest, and 0 is the weakest.
In the Stage Analysis method we are looking to focus on the strongest groups, as what is strong, tends to stay strong for a long time. But we also want to find the improving / up and coming groups that are starting to rise up strongly through the RS table from the lower zone, in order to find the future leading stocks before they break out from a Stage 1 base and move into a Stage 2 advancing phase.
Each week I go through the most interesting groups on the move in more detail during the Stage Analysis Members weekend video – as Industry Group analysis is a key part of Stan Weinstein's Stage Analysis method.
Become a Stage Analysis Member:
To see more like this – US Stocks watchlist posts, detailed videos each weekend, use our unique Stage Analysis tools, such as the US Stocks & ETFs Screener, Charts, Market Breadth, Group Relative Strength and more...
Join Today
Disclaimer: For educational purpose only. Not investment advice. Seek professional advice from a financial advisor before making any investing decisions.