
Market Breadth: Percentage of Stocks Above their 50 Day, 150 Day & 200 Day Moving Averages Combined
The full post is available to view by members only. For immediate access:
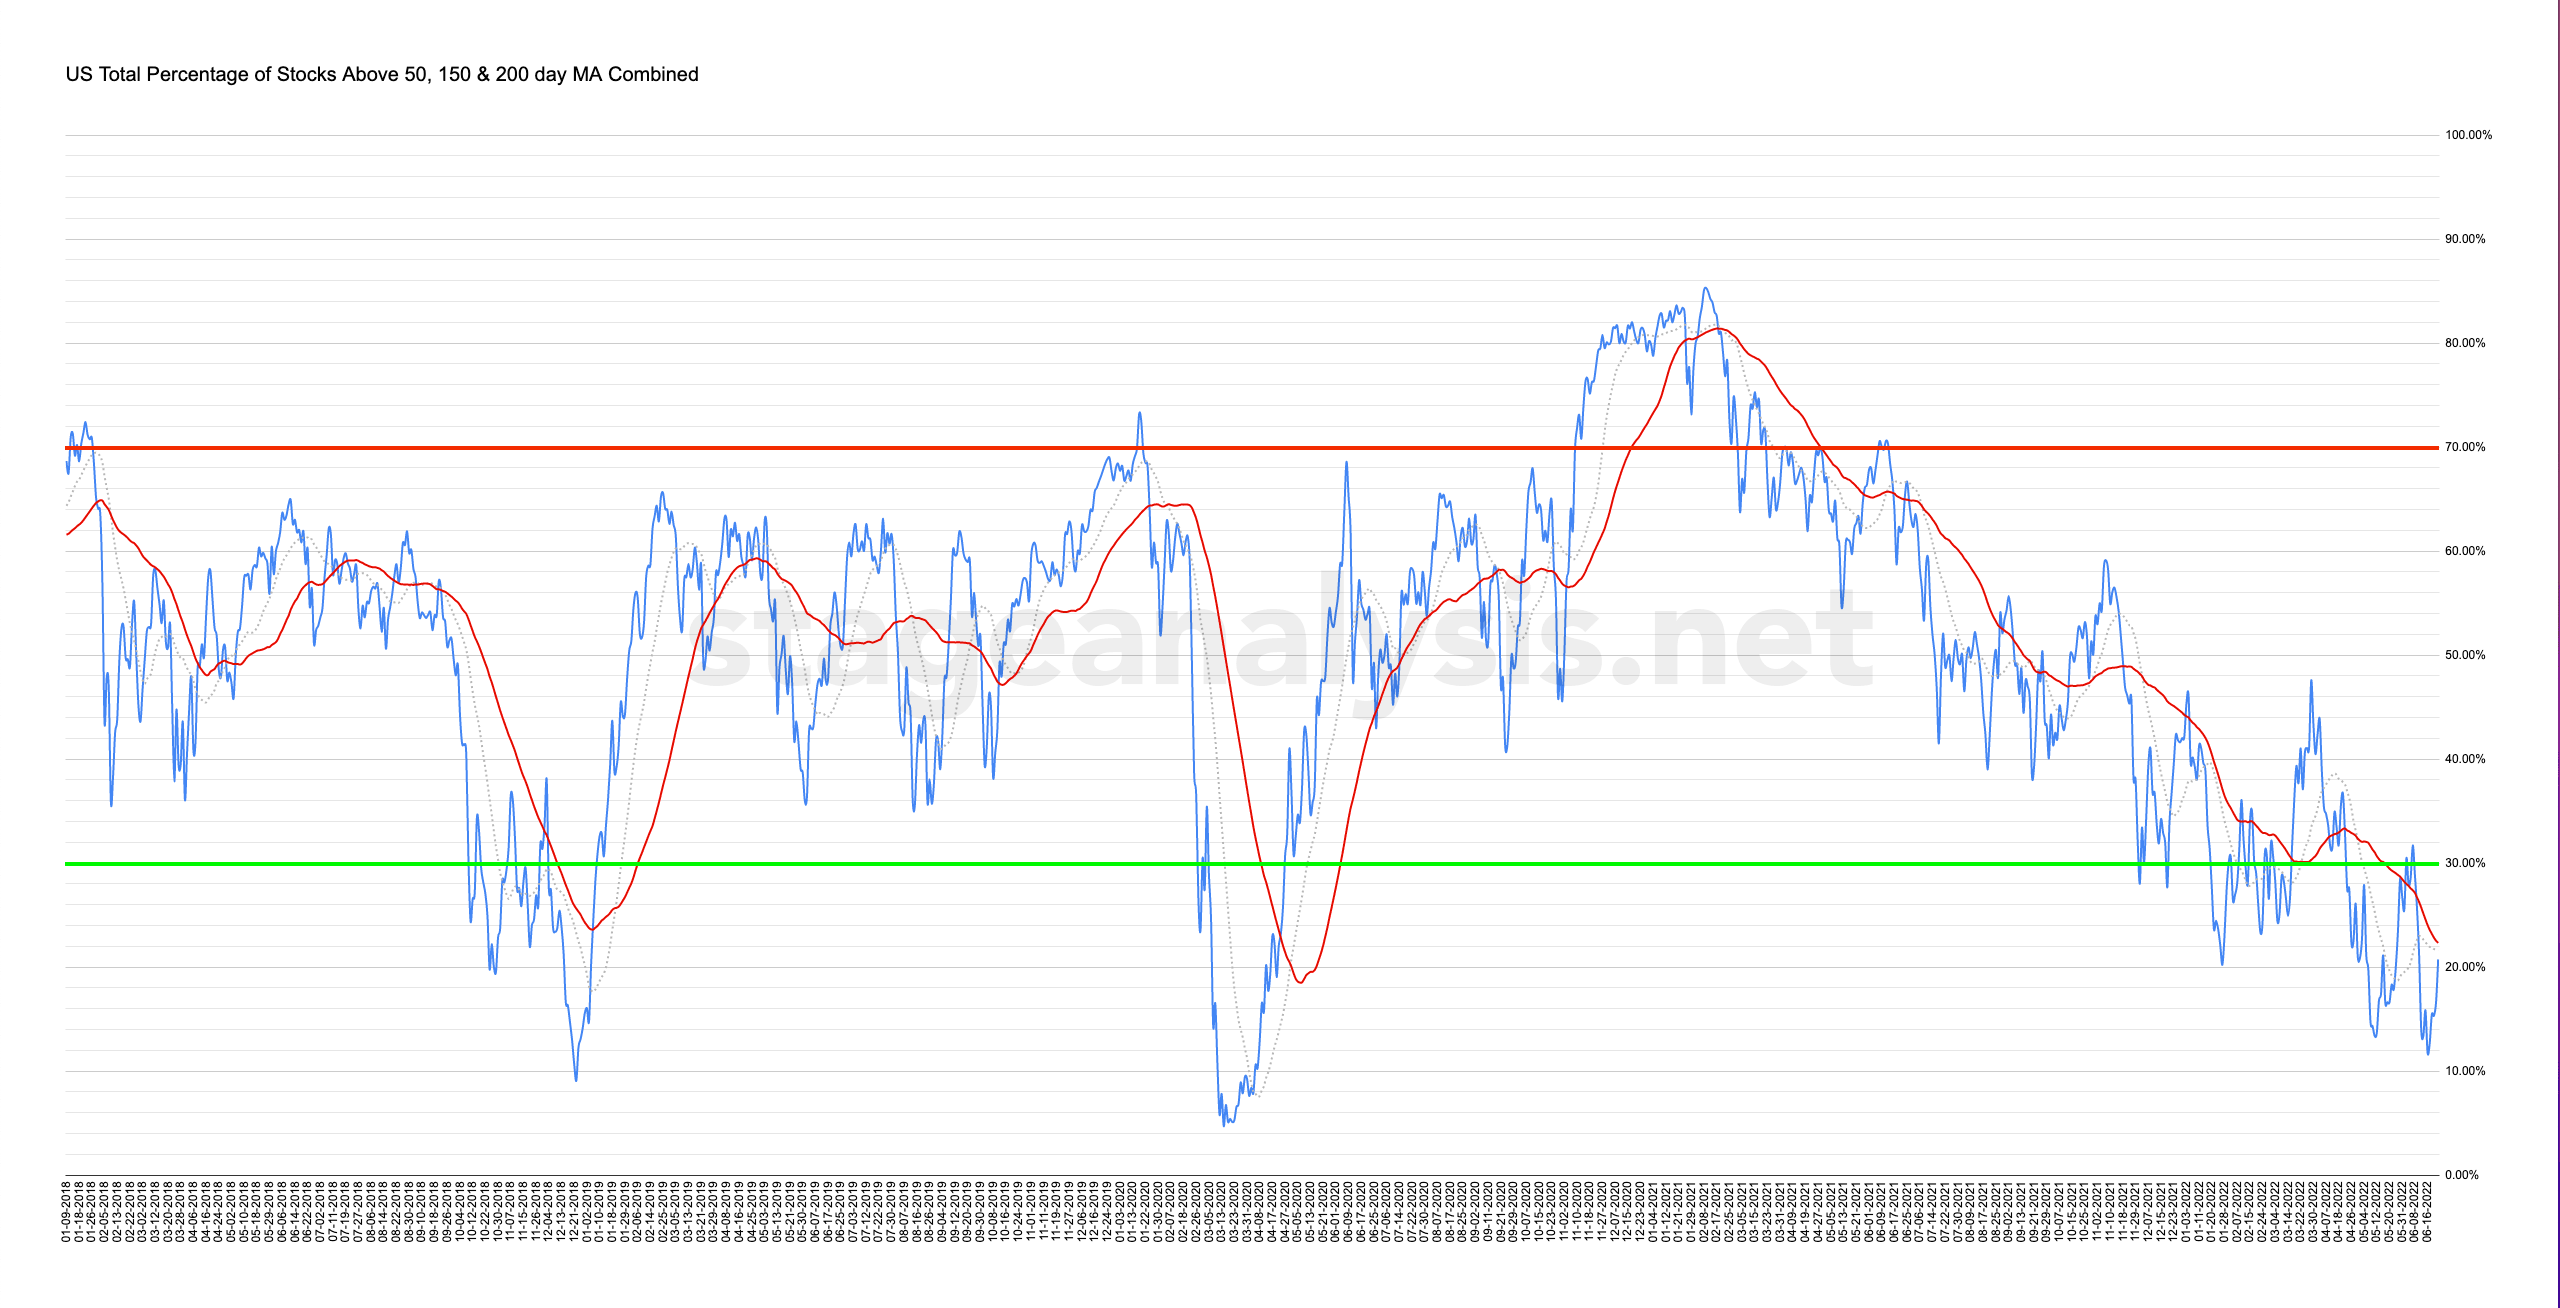
20.75% (+9.00% 1wk)
Status: Neutral / Difficult Environment in Stage 4 zone
The US Total Percentage of Stocks Above their 50 Day, 150 Day & 200 Day Moving Averages Combined chart reversed the prior week's decline with a +9.00% gain to close the week back above the 20% level with the combined line approaching its own 50 Day MA once more, but it hasn't crossed over yet and hence only changes the status to a more neutral setting currently.
In order to change the status a positive environment setting, we need to see further improvement with multiple daily closes above its 50 Day MA.
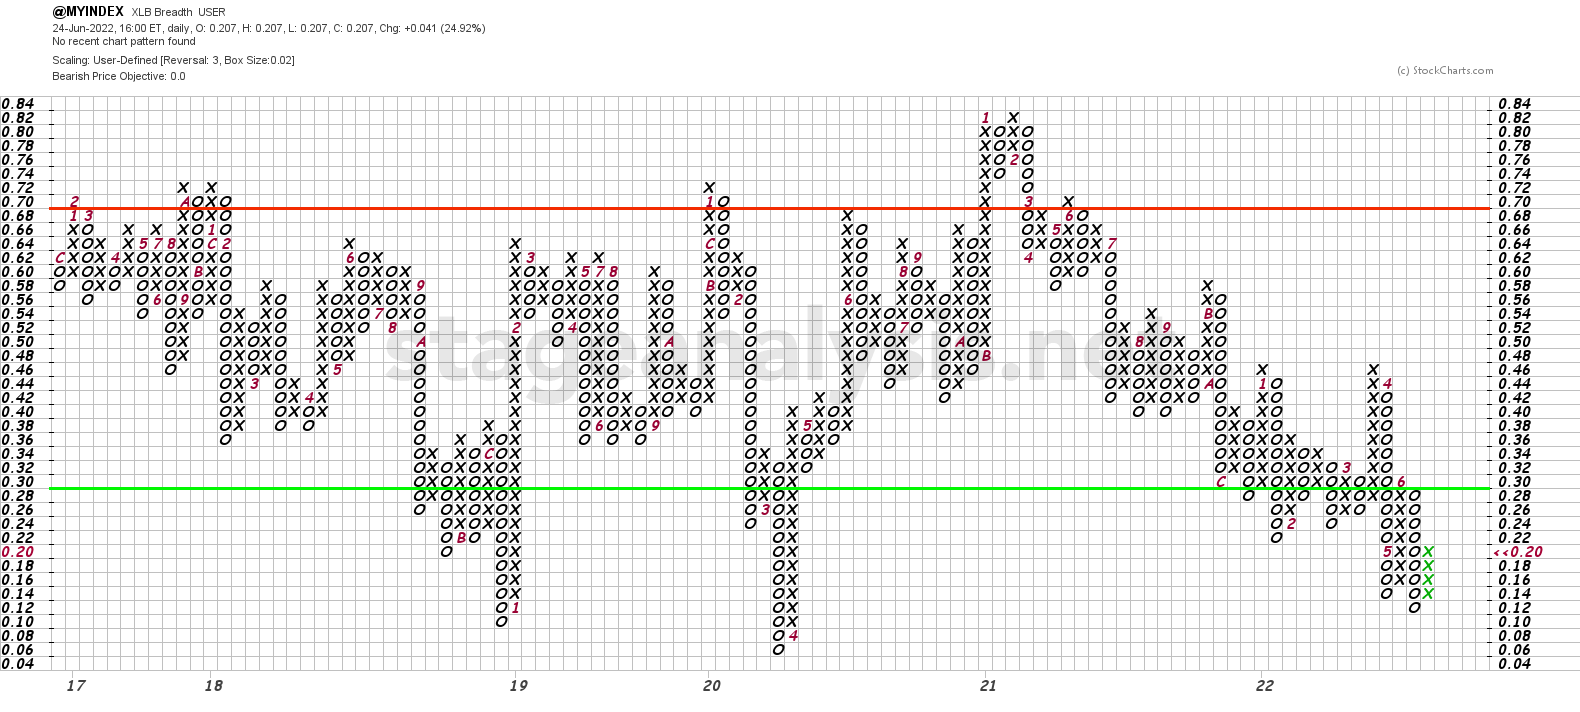
The Point and Figure chart reversed to a column of X's with a 4 box move higher, which changes the P&F status to Bull Alert status. To improve the P&F status further to Bull Confirmed status it would need to make a double top breakout at the 32% level, which is still a further 12% move from the current level. But we could still see further column changes in the coming weeks which may lower the level required.
Become a Stage Analysis Member:
To see more like this – US Stocks watchlist posts, detailed videos each weekend, use our unique Stage Analysis tools, such as the US Stocks & ETFs Screener, Charts, Market Breadth, Group Relative Strength and more...
Join Today
Disclaimer: For educational purpose only. Not investment advice. Seek professional advice from a financial advisor before making any investing decisions.