
Market Breadth: Percentage of Stocks Above their 50 Day, 150 Day & 200 Day Moving Averages Combined
The full post is available to view by members only. For immediate access:
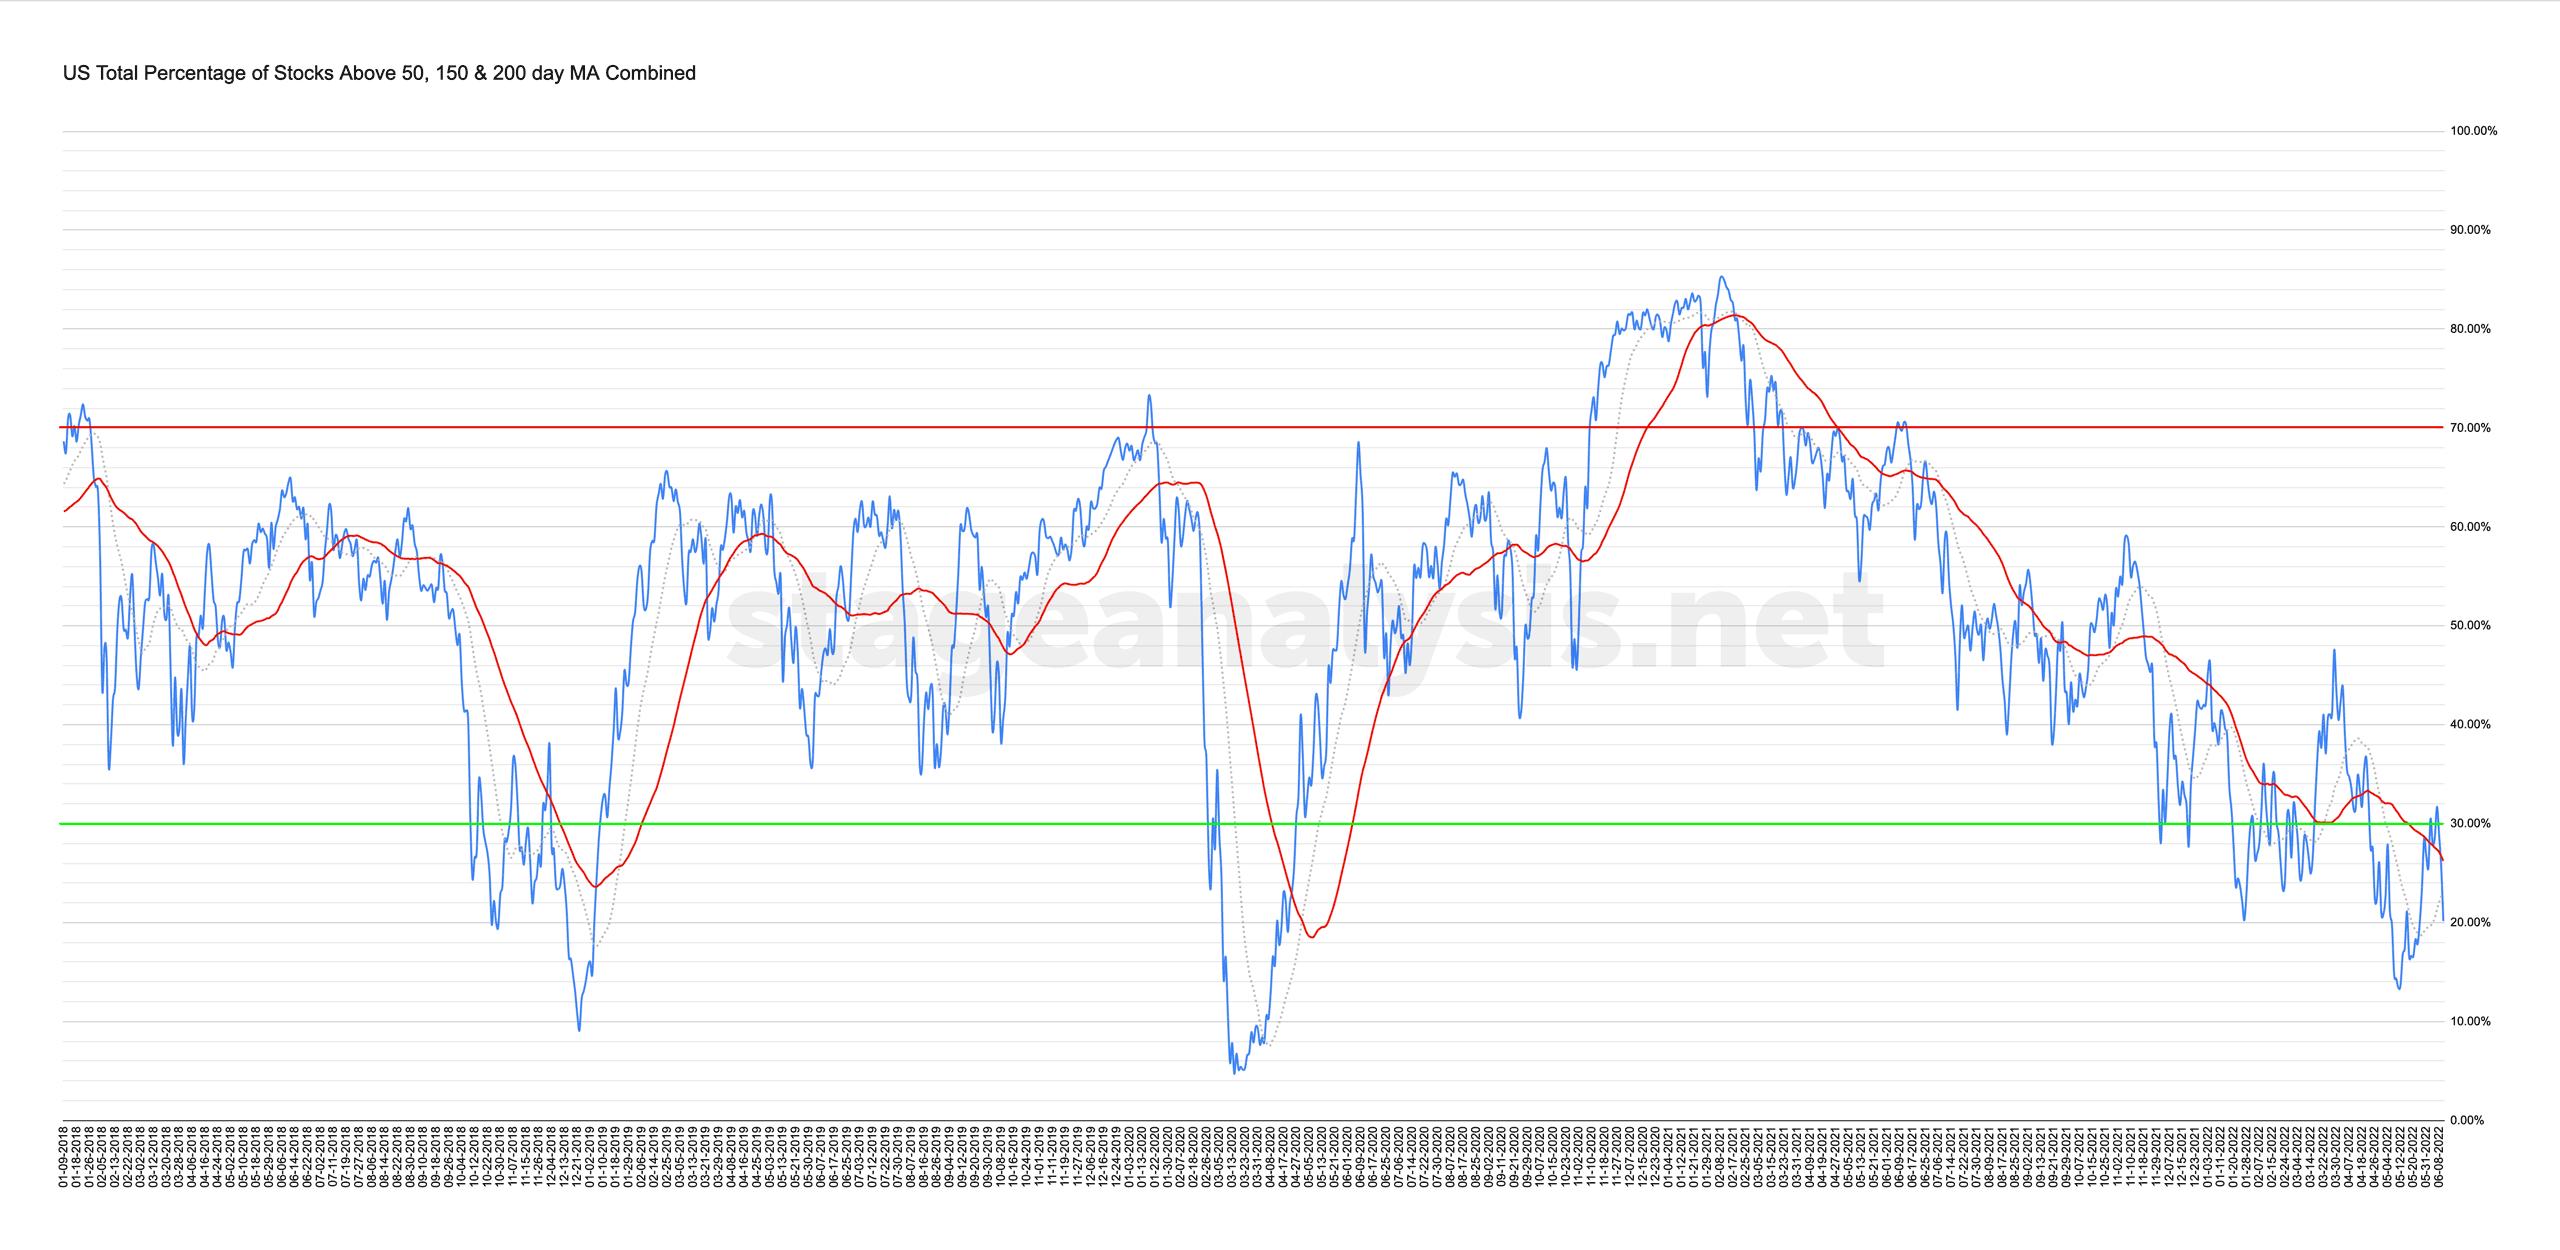
20.15% (-7.81% 1wk)
Status: Very Difficult Environment in Stage 4 zone
The US Total Percentage of Stocks Above their 50 Day, 150 Day & 200 Day Moving Averages Combined chart moved strongly back into the lower zone this week with a -7.81% decline, to close the week at 20.15%. So last weeks Difficult Environment status in a Neutral position has reverted to a Very Difficult Environment status once more, as the Stage 4 downtrend reasserted itself earlier in the week, which moved the combined line back below its own 50 Day MA and deep into the lower zone once more.
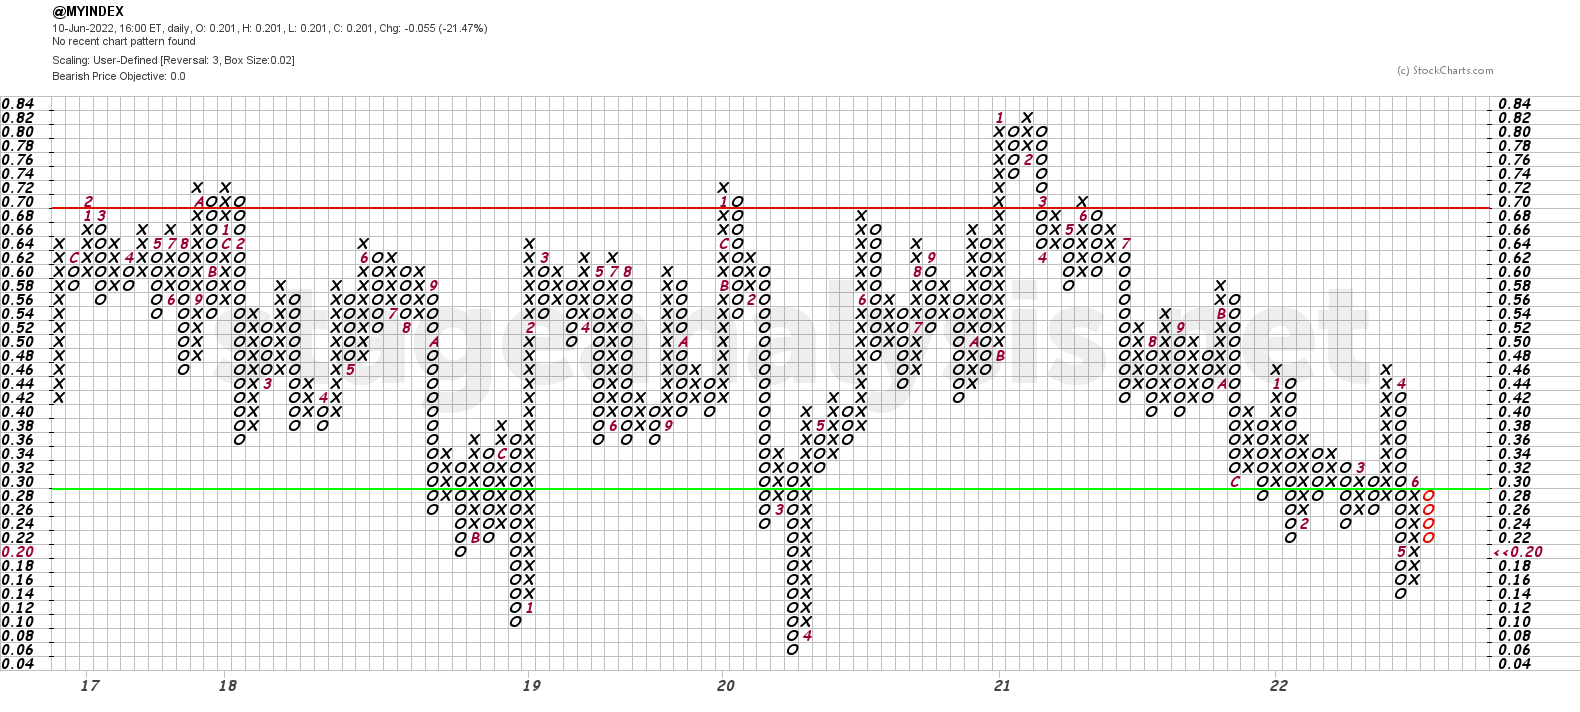
The Point and Figure chart reversed back to a column of Os, dropping 4 boxes. Which moves the strategy back onto Defense. But it does setup the chart for a lower possible breakout move at the 32% level. Which, if overcome reversing from the lower zone, would trigger a new Bull Confirmed status. But with the reversal back to Os this week the current P&F status has shifted from Bull Alert to Bear Confirmed status once more. So the Stage 4 downtrend wild ride continues.
I'll discuss these charts and the other charts based from this data in more detail in the members weekend video (due out later on Sunday afternoon EST).
Become a Stage Analysis Member:
To see more like this – US Stocks watchlist posts, detailed videos each weekend, use our unique Stage Analysis tools, such as the US Stocks & ETFs Screener, Charts, Market Breadth, Group Relative Strength and more...
Join Today
Disclaimer: For educational purpose only. Not investment advice. Seek professional advice from a financial advisor before making any investing decisions.