
Market Breadth: Percentage of Stocks Above their 50 Day, 150 Day & 200 Day Moving Averages Combined
The full post is available to view by members only. For immediate access:
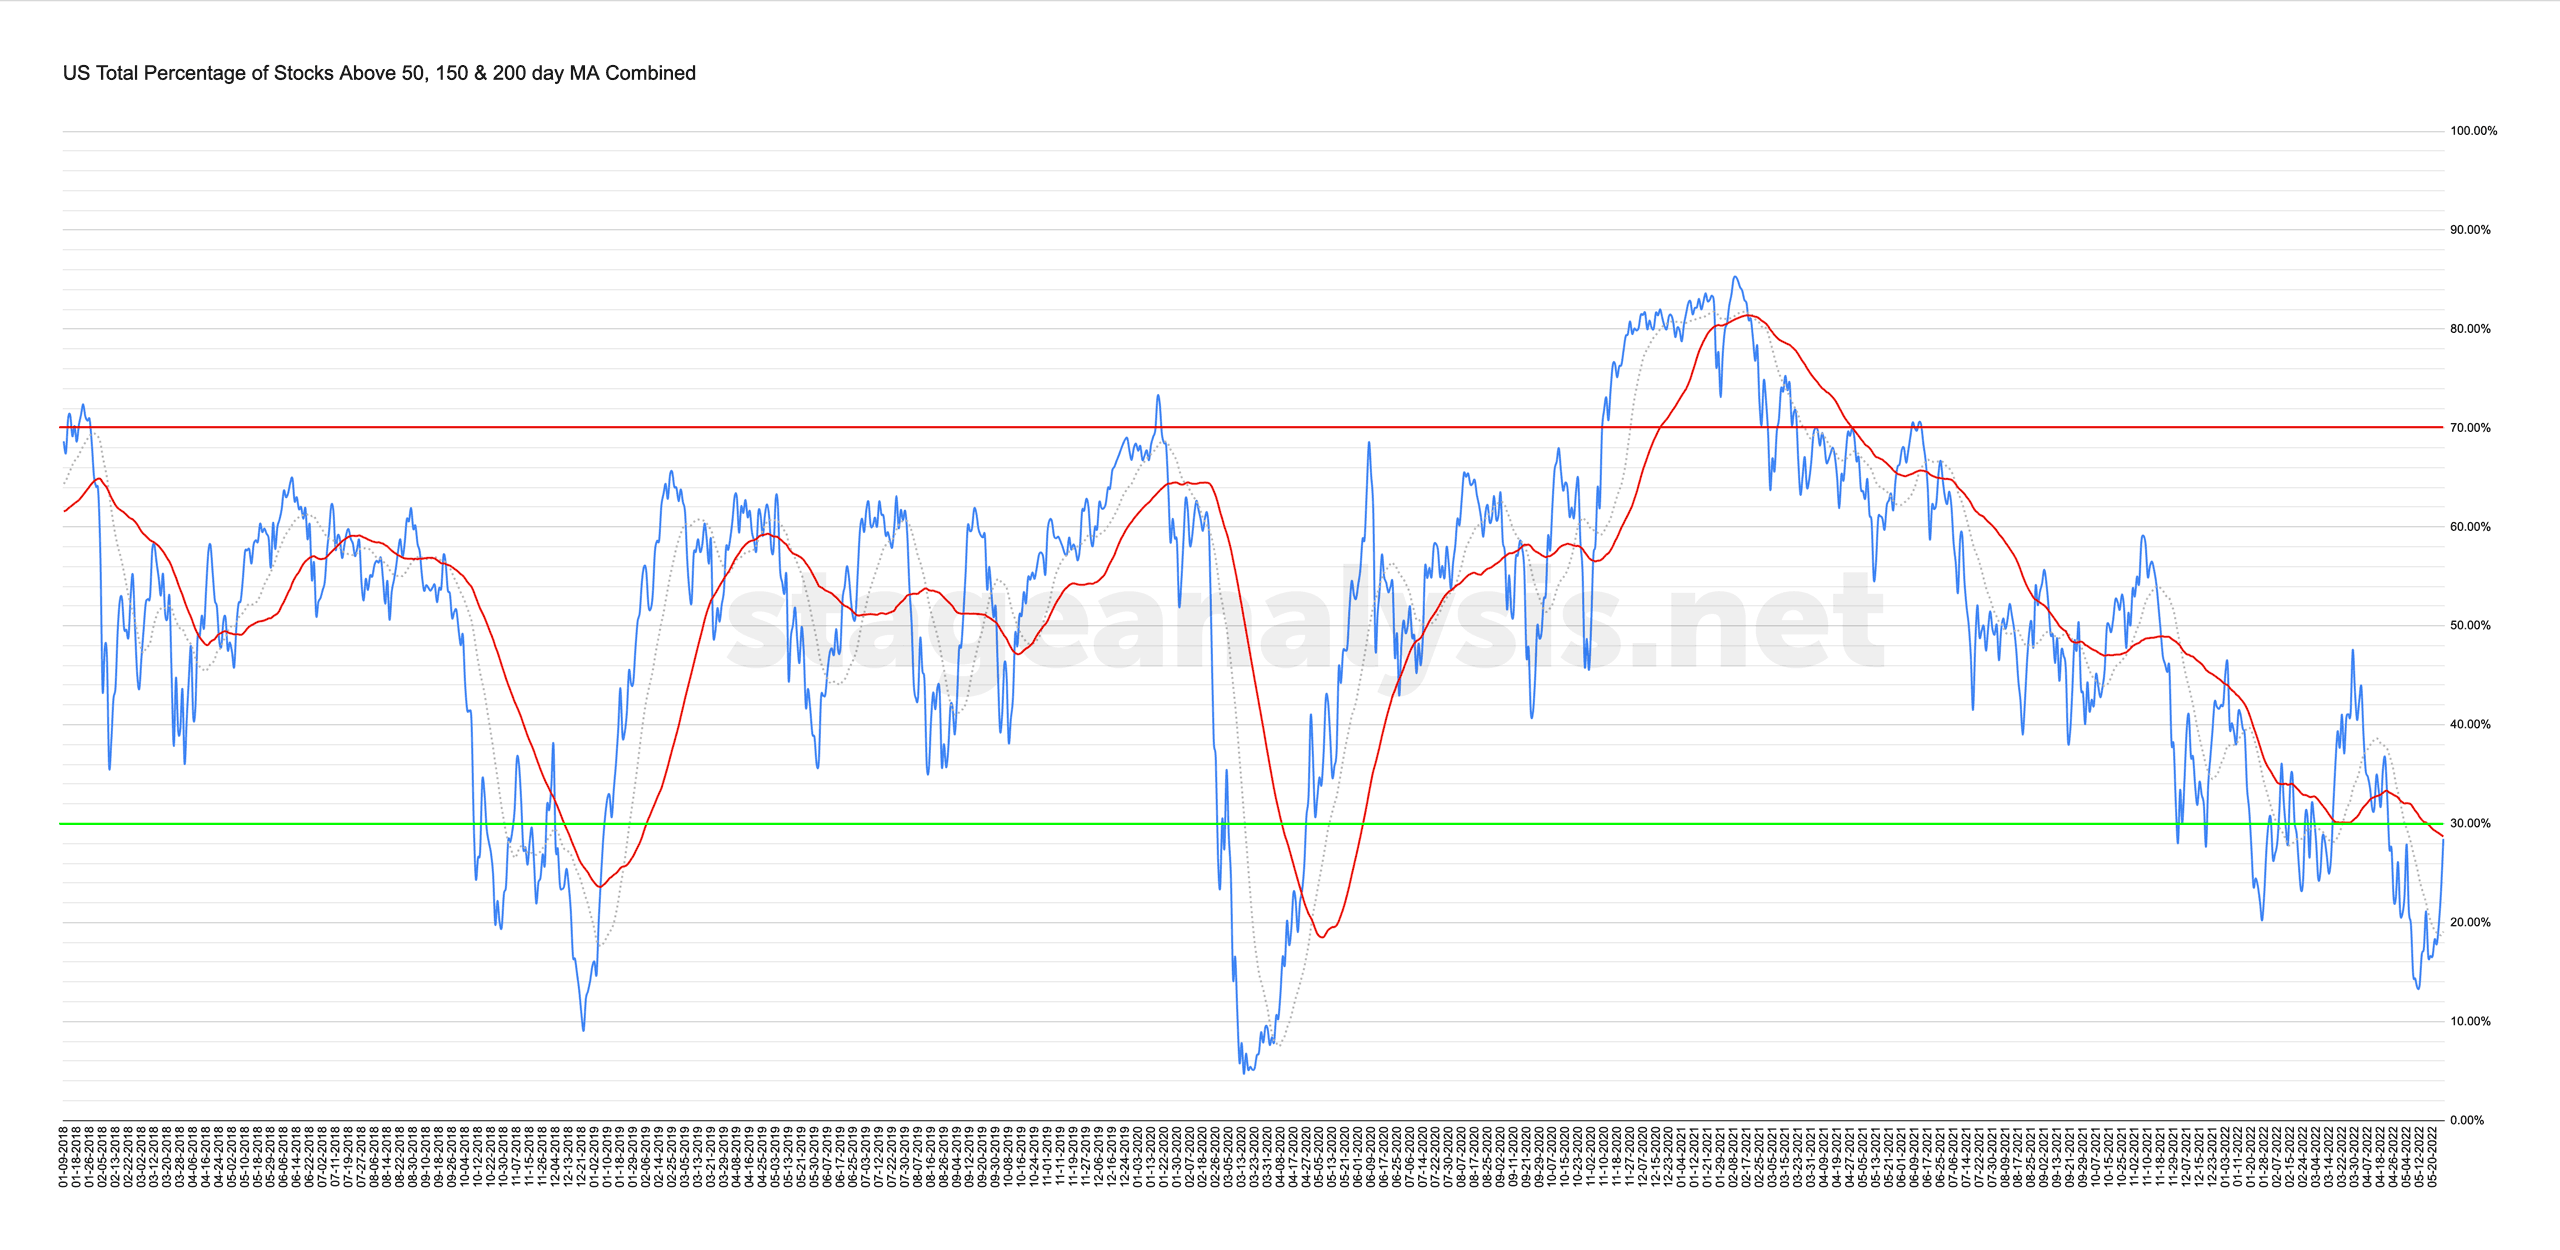
28.46% (+11.85% 1wk)
Status: Neutral / Difficult Environment in Stage 4 zone
The US Total Percentage of Stocks Above their 50 Day, 150 Day & 200 Day Moving Averages Combined chart had a very strong week, crossing above its own 20 day MA on Wednesday, and climbed further into the end of the week to close within -0.24% of its declining 50 day MA that I use as the signal line at 28.46%. Which was an overall improvement on the week of +11.85%.
So it changes the status to a more neutral position, but as it's below the 50 day MA still, it remains on Difficult Environment status for the time being. But that could change next week if there is follow through.
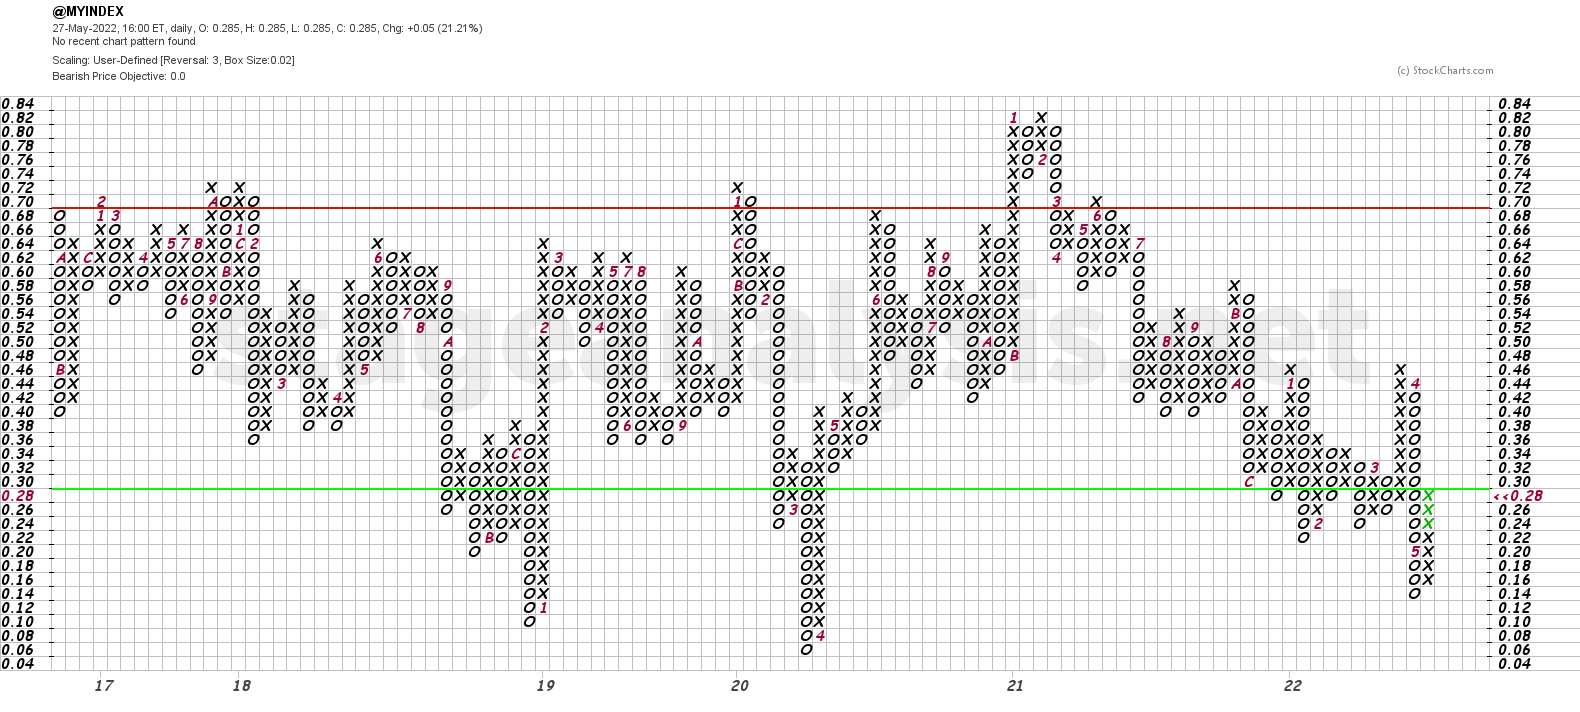
The Point and Figure chart (see below) continued to improve, adding a further 4 Xs to its current column as it moved back towards the top of the lower zone (below 30%) and so last weeks Bull Alert status remains, but we can remove the tentative part from last weeks post.
To improve further and move to Bull Confirmed status, currently it would need to make a double top breakout above the March column of Xs at 48% – which is a long way still. However, a lower breakout level could form if it reverses back to a column of Os before progressing much higher.
I'll discuss this and the other charts based from this data in more detail in the members weekend video (due out later on Sunday afternoon EST)
Become a Stage Analysis Member:
To see more like this – US Stocks watchlist posts, detailed videos each weekend, use our unique Stage Analysis tools, such as the US Stocks & ETFs Screener, Charts, Market Breadth, Group Relative Strength and more...
Join Today
Disclaimer: For educational purpose only. Not investment advice. Seek professional advice from a financial advisor before making any investing decisions.