Stage Analysis Video Training Course

US Breakout Stocks Watchlist - 17 June 2020

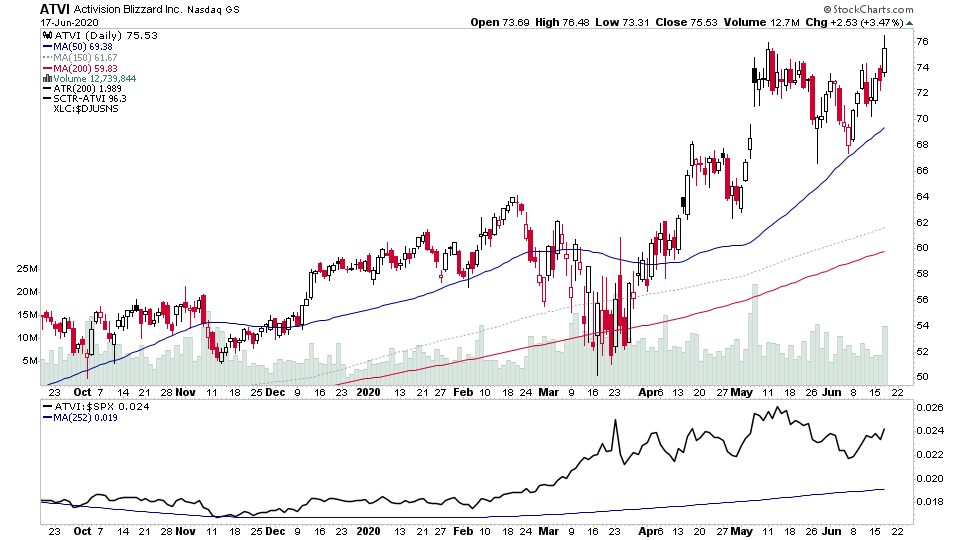
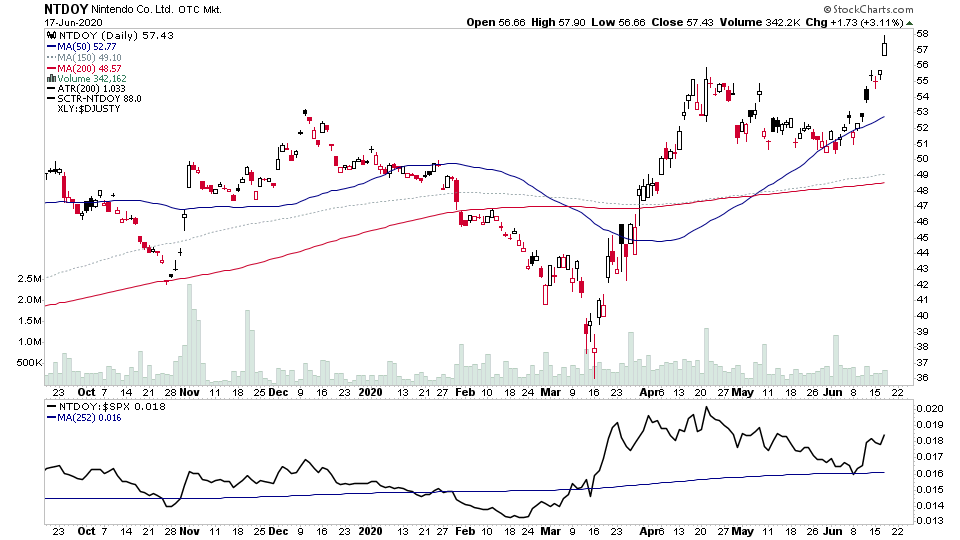
The market was weak, but there was a noticeable sector theme today with multiple computer game stocks breaking out.

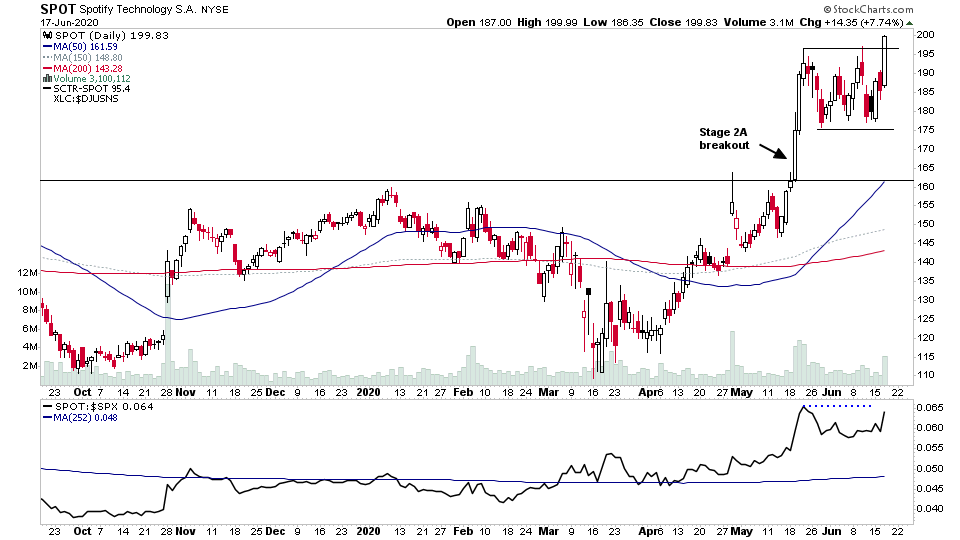
Another stock of note was SPOT, which managed to break above the IPO-AP (IPO Advance Phase) high to new all time highs. This has been a stock that I've highlighted multiple times since before the Stage 2A breakout, and multiple times after as its formed its first base since the Stage 2A breakout. The Stage 1 base was a massive year and a half, and its seen significant accumulation from from the institutions, with over a 103% increase in funds that own it since this time since last year, and so it's gaining support and could well be close to moving into the institutional advance phase in early Stage 2. So definitely one to watch imo, as could become an institutional favourite.

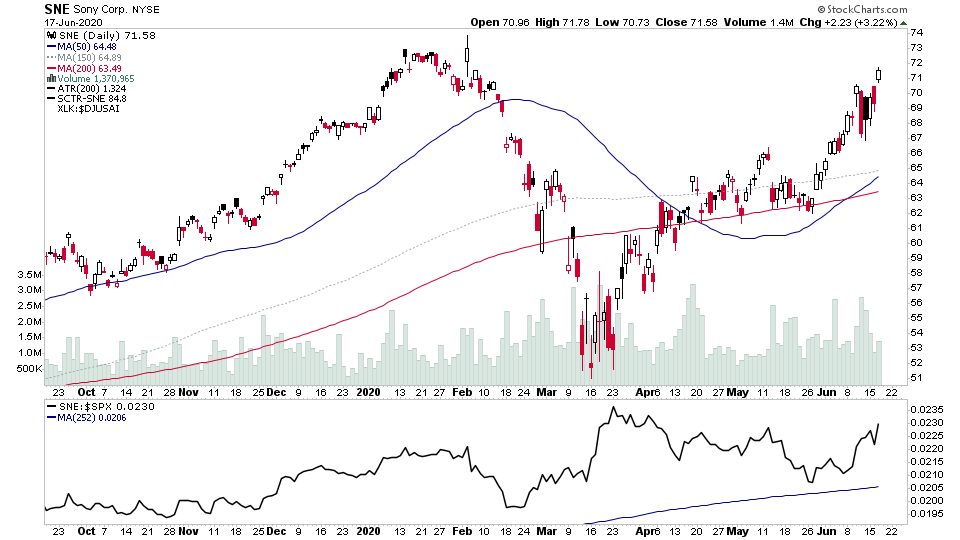
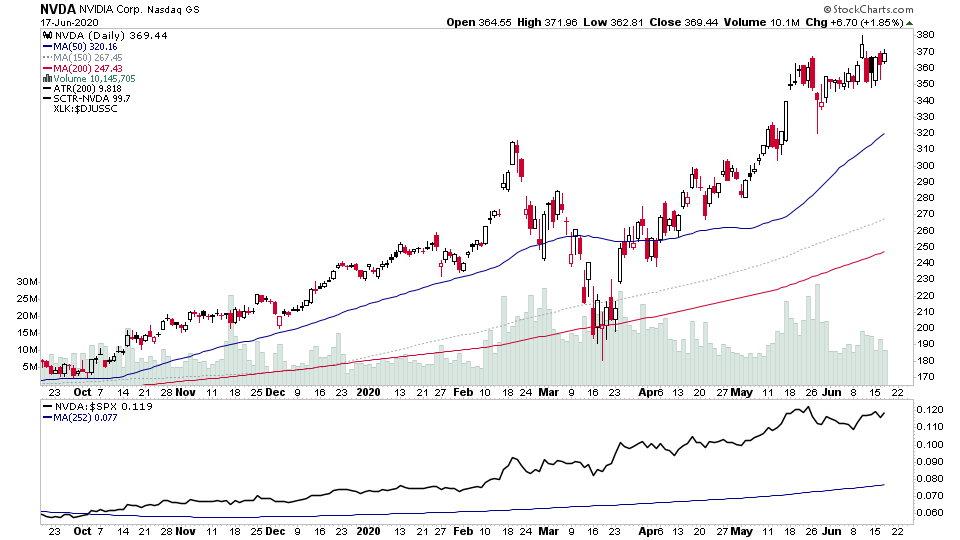
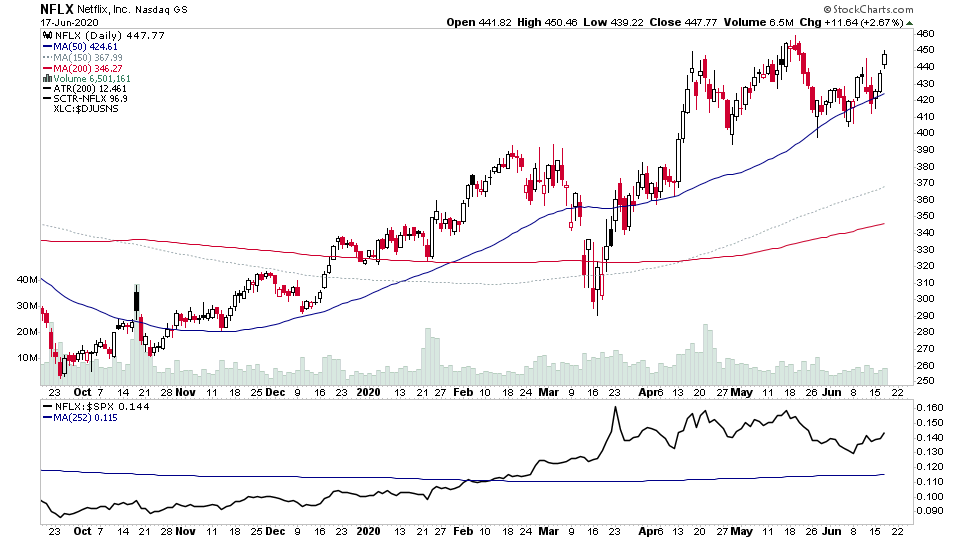
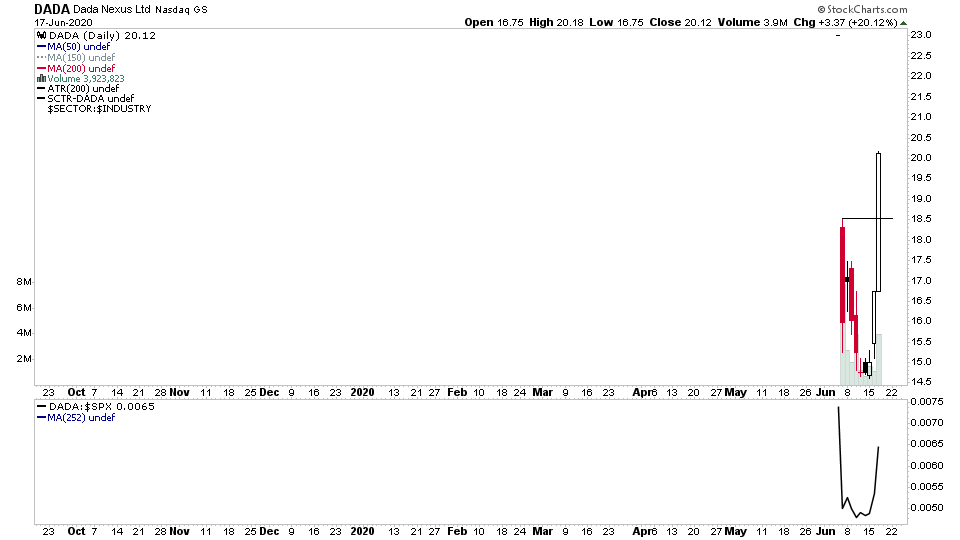
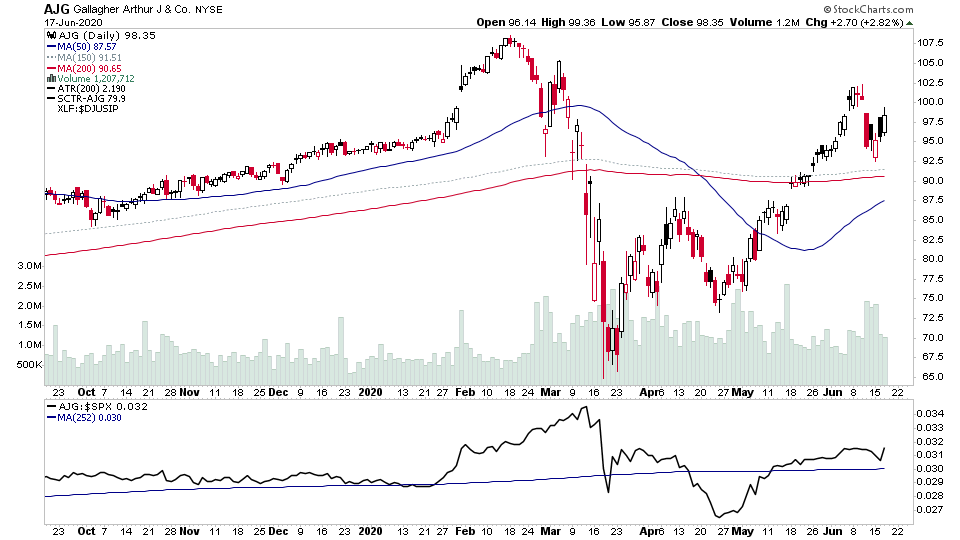
For the watchlist from Wednesdays scans - AJG, ATVI*, DADA, NFLX, NTDOY, NVDA, SNE, SPOT

*I took a 1/3rd size position in ATVI at 74.73


Disclaimer: For educational purpose only. Not investment advice. Seek professional advice from a financial advisor before making any investing decisions.

Recent Articles

SPX W 23 3 23

US Stocks Watchlist – 23 March 2023

One of the primary purposes of the daily watchlist scans is as alternative form of market breadth, as by scanning the market daily and looking for stocks displaying the characteristics of Stage 1 and Stage 2. It gives a really good idea of the overall market health...
Read More
SPX D 21 3 23

S&P 500 Divergence and the US Stocks Watchlist – 21 March 2023

The S&P 500 moved strongly back above its 20 day EMA today. But as you can see in the above chart, there's a notable difference with the S&P 500 percentage of stocks above their 20 day EMA (middle indicator) which is at 36.60%, as with the S&P 500 index above its 20 day MA by almost 1%, you would expect at least 50% of S&P 500 to be doing the same...
Read More
SPX D 19 3 23

Stage Analysis Members Video – 19 March 2023 (1hr 20mins)

This weekends video begins with a detailed discussion of the IBD Industry Groups Bell Curve – Bullish Percent and the Market Breadth Indicators, in order to help to determine the weight of evidence, which is the most crucial aspect of Stan Weinstein's Stage Analysis method. The changes in the US Stocks Industry Groups RS Rankings are then discussed, as well as the Major Indexes Update and Futures, including the S&P 500, Nasdaq 100, Russell 2000, US Dollar Index, Gold etc. Followed by a review of the watchlist stocks from the weekend scans.
Read More