
US Stocks Industry Groups Relative Strength Rankings
The full post is available to view by members only. For immediate access:
US Industry Groups by Highest RS Score
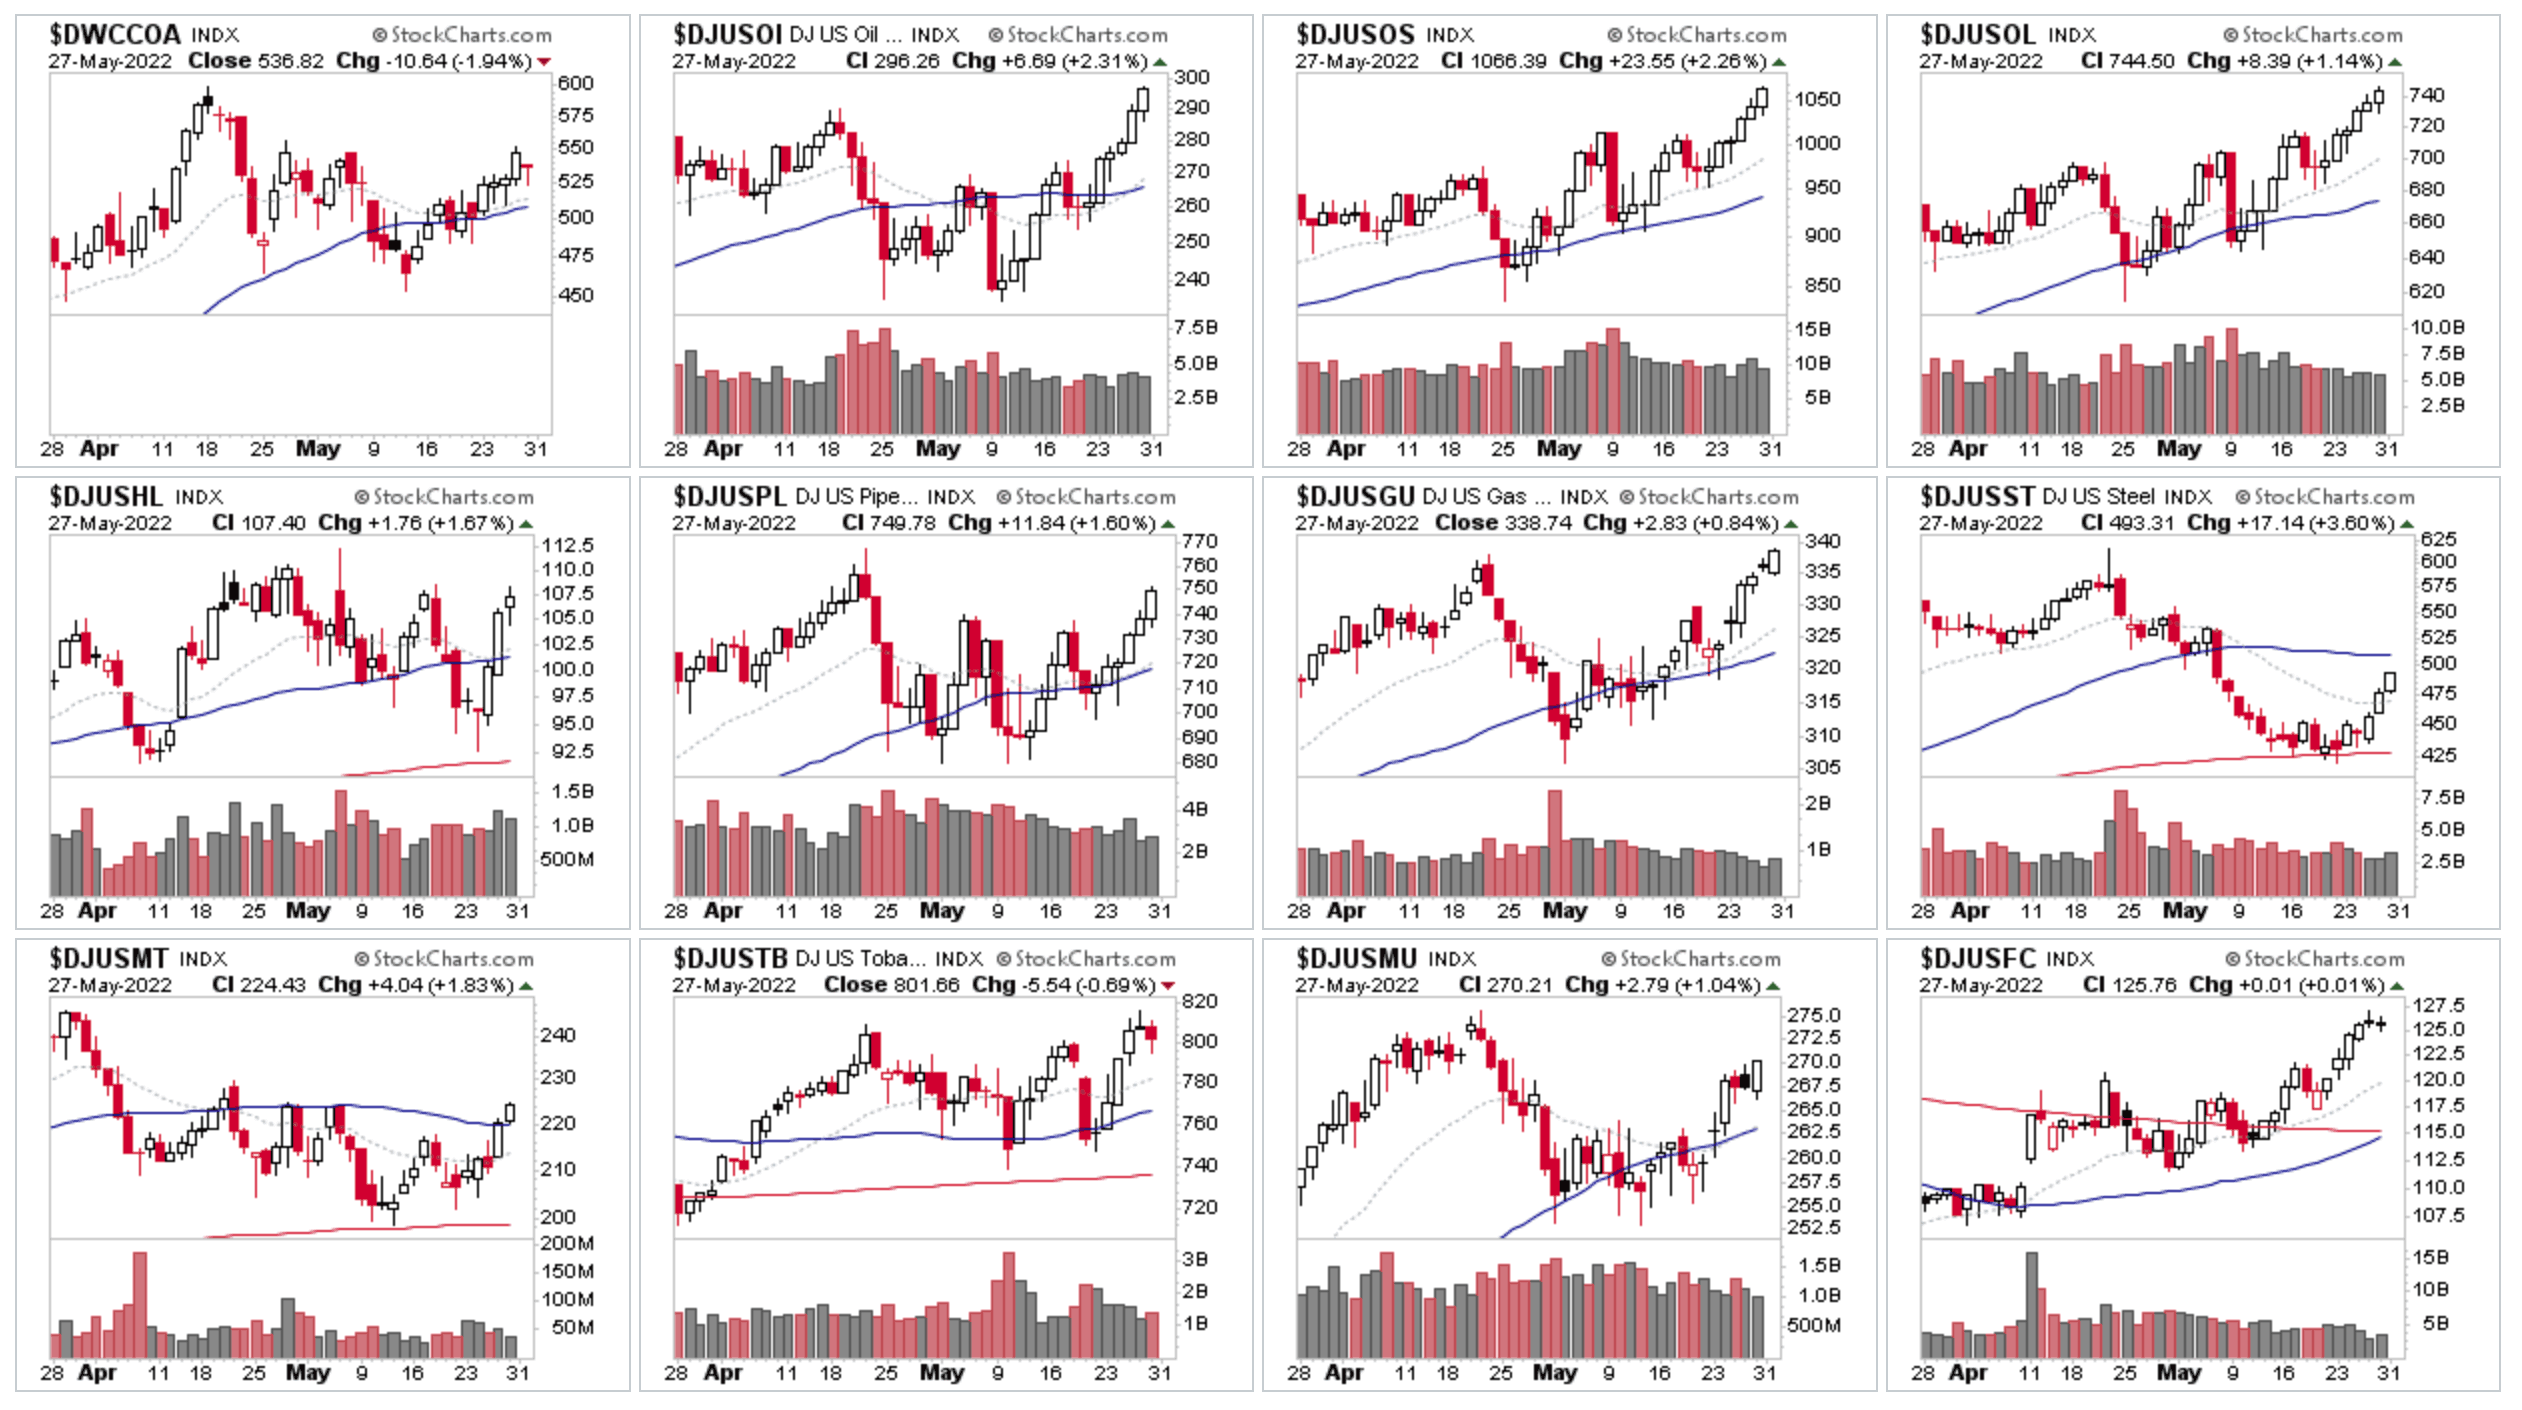
Above is the top 12 industry groups thumbnail charts by Relative Strength (RS) score, which like 99% of the Industry Groups this week, had a strong up week with moves ranging from 4% to 14% in the leading groups and some new highs appearing in multiple Oil groups.
Steel was one of the standout groups. Rejoining the Top 10 once more, with a move of +18 RS points to finish the week with an RS ranking of 93 in 8th place overall. Stocks from the group moving strongly include TMST, STLD, RS, MT and multiple others. So a potential area to research further this weekend as it's one of the few groups with multiple stocks in Stage 2 near to new highs still. Although the group chart had strong pullback over the last month, which was a potential Change of Behaviour. So a potential early Stage 3 sign. But, not definitive until further evidence appears in time. So for now it's still in Stage 2 and showing near term strength with a strong rebound off of the 30 week MA and 200 day MA.
US Industry Groups by Weakest RS Score
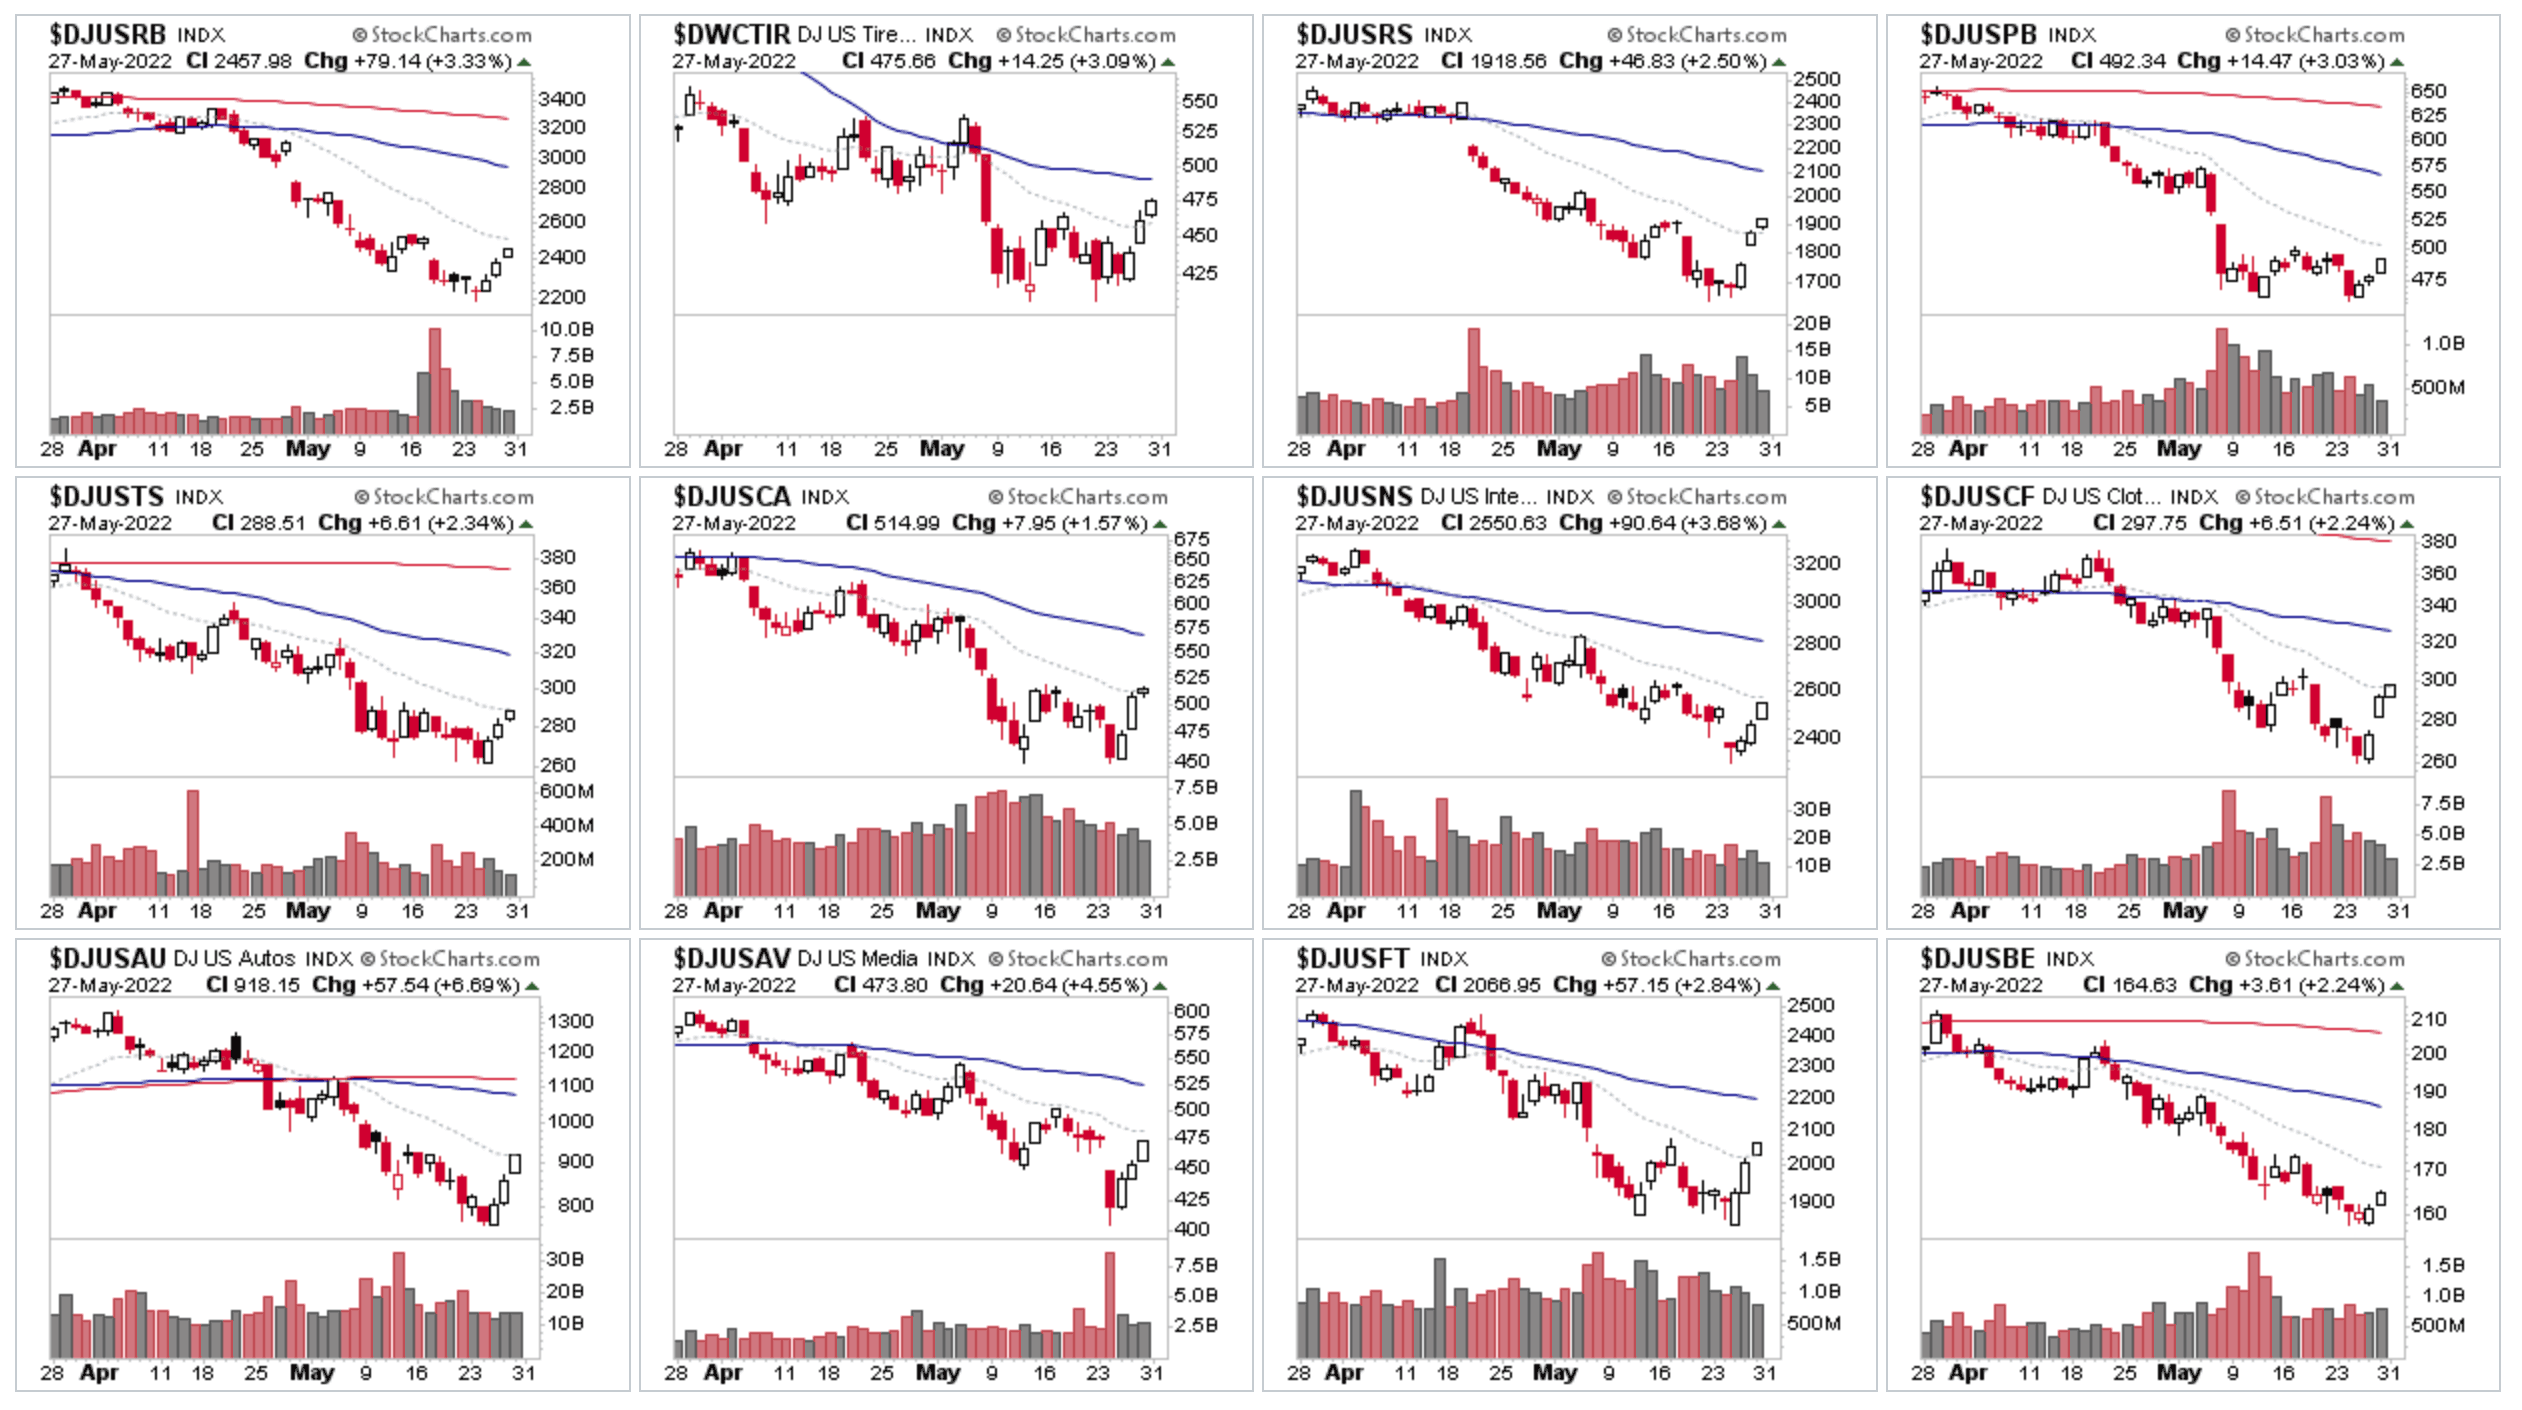
The weak RS groups all finished higher on the week. Of note was the Automobiles group once more, as I highlighted in last weeks post that TSLA was testing the Stage 4 breakdown level, but that the close below was weak, and so it was only a tentative Stage 4 breakdown attempt, and at what we call the Pivotal Point that can form a Wyckoff Spring – which is what we saw this week – and hence it remains in Stage 3, and we are now looking for a potential Change of Behaviour. As if it is indeed a spring. Then the expectation is for a strong move back towards the top of the range. But if it can't do that, then it would signal potential further weakness and the possibility of another Stage 4 attempt.
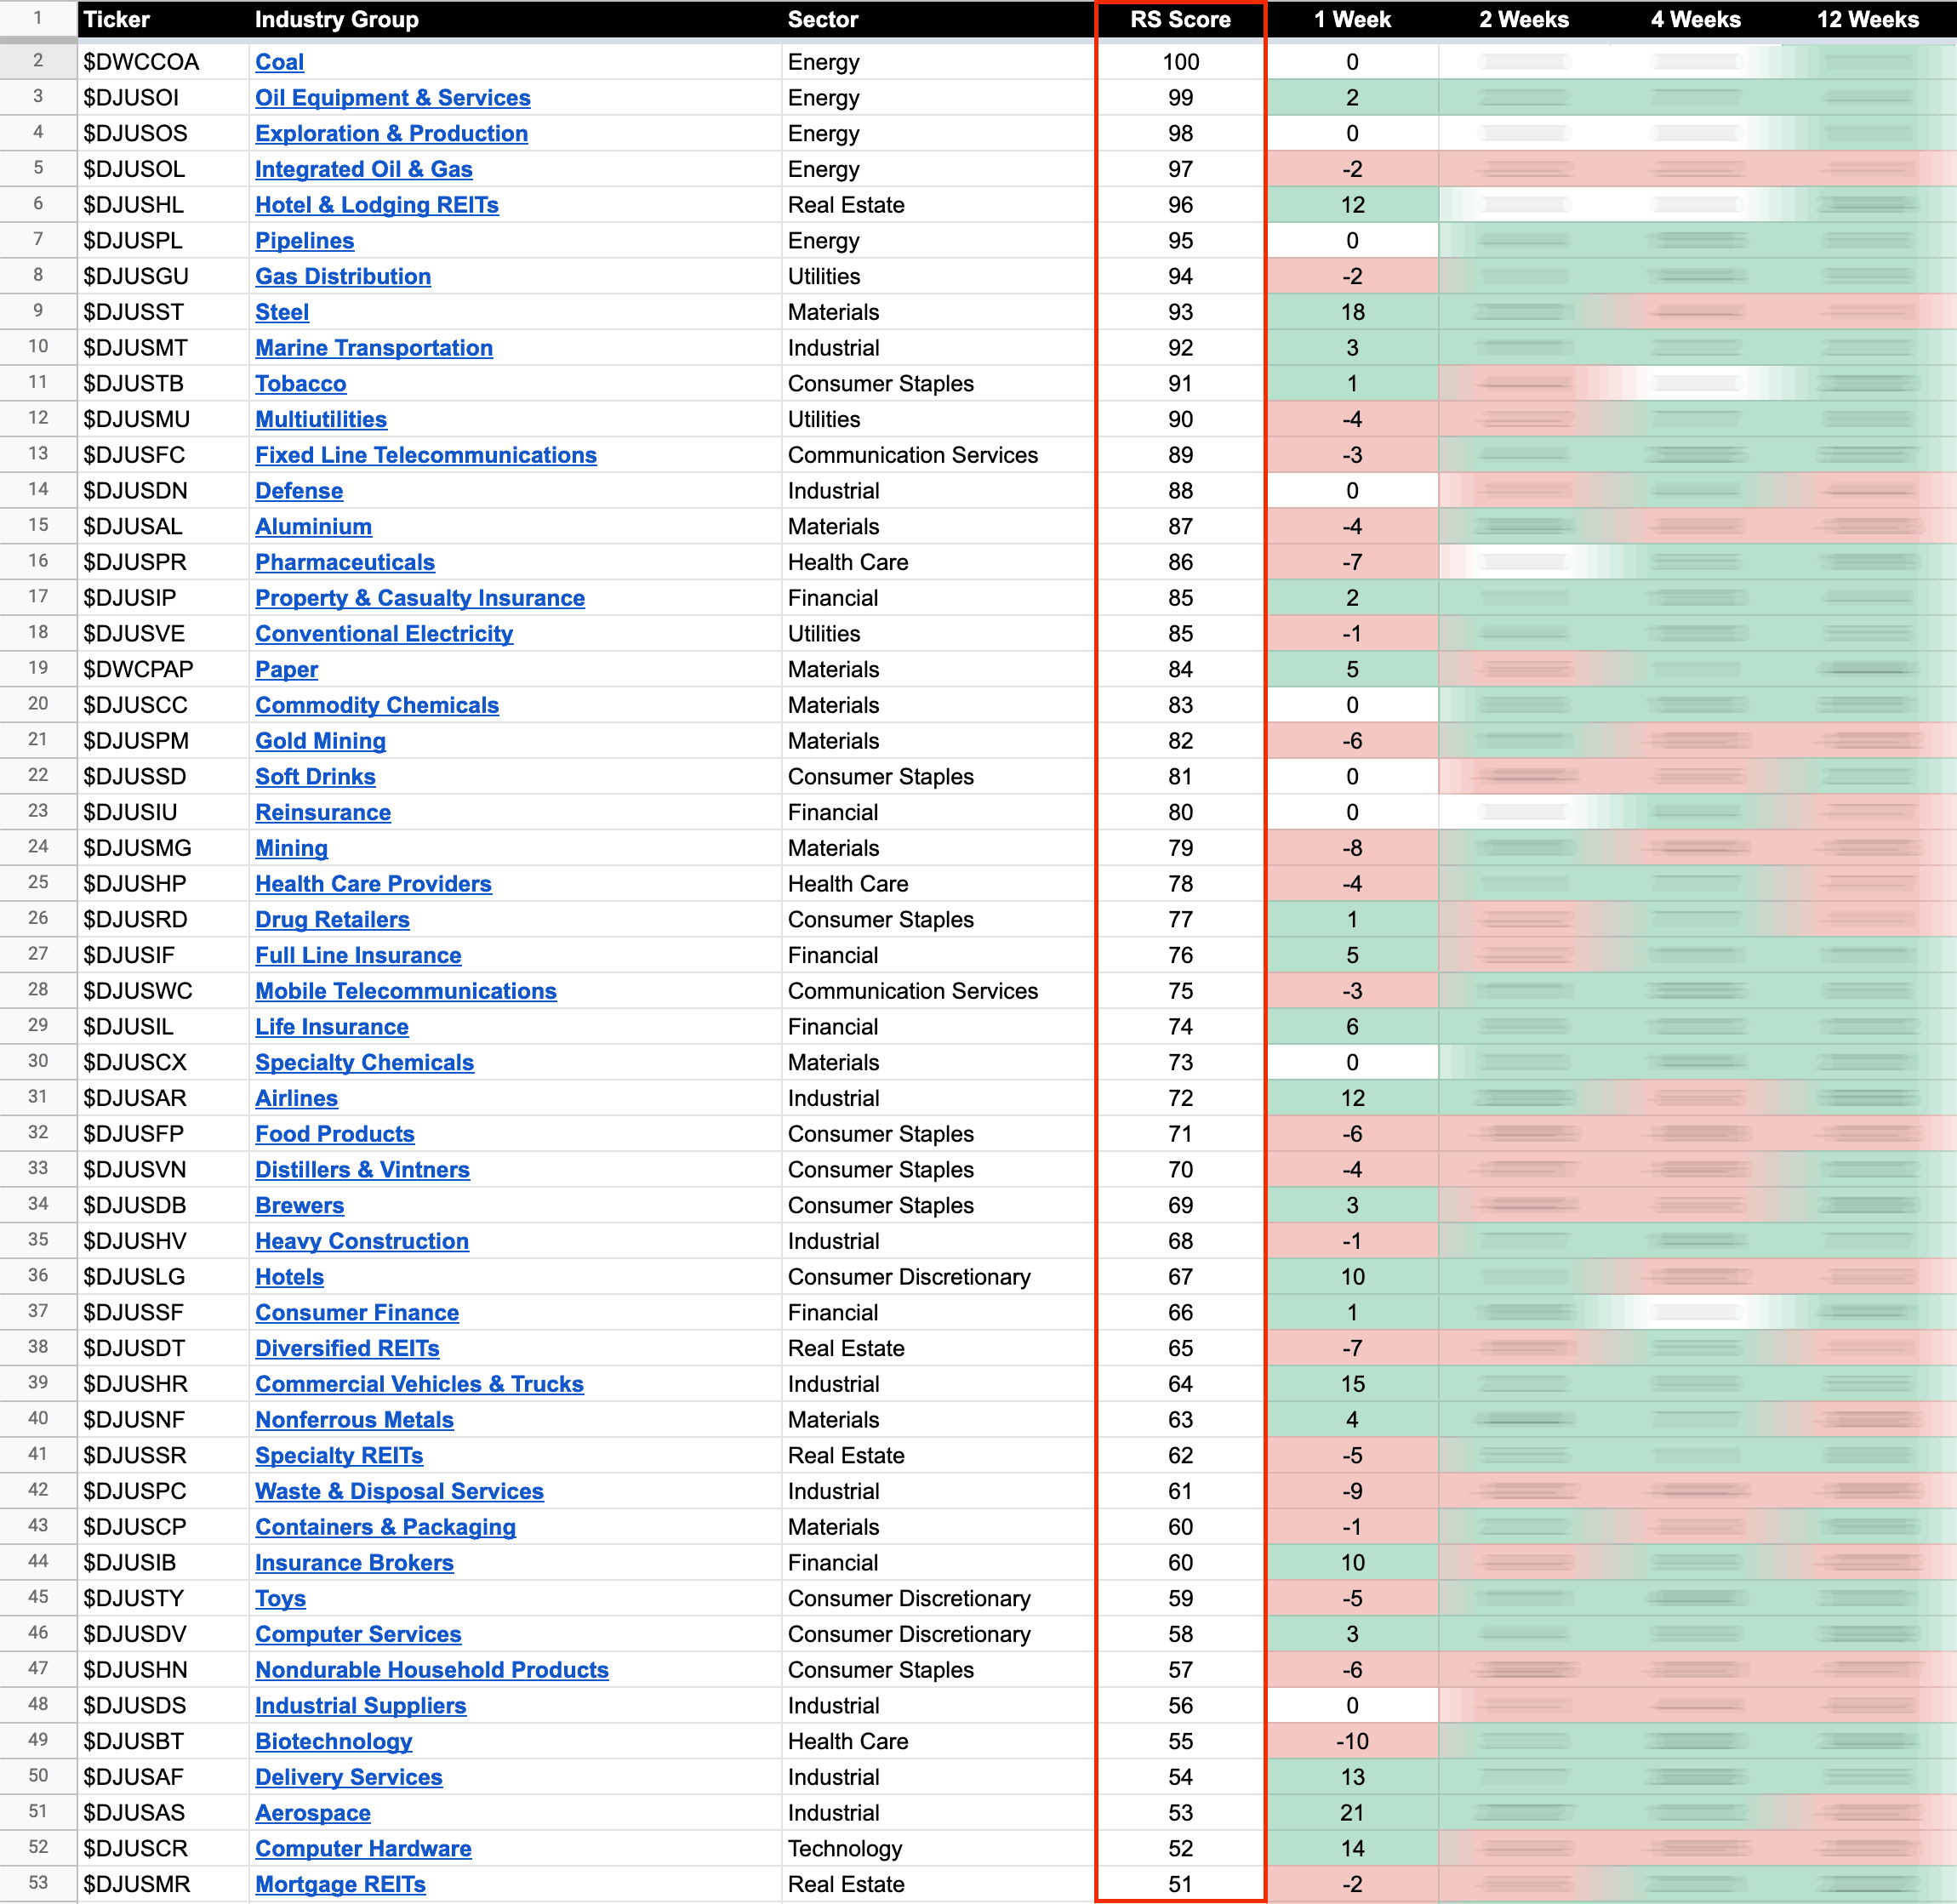
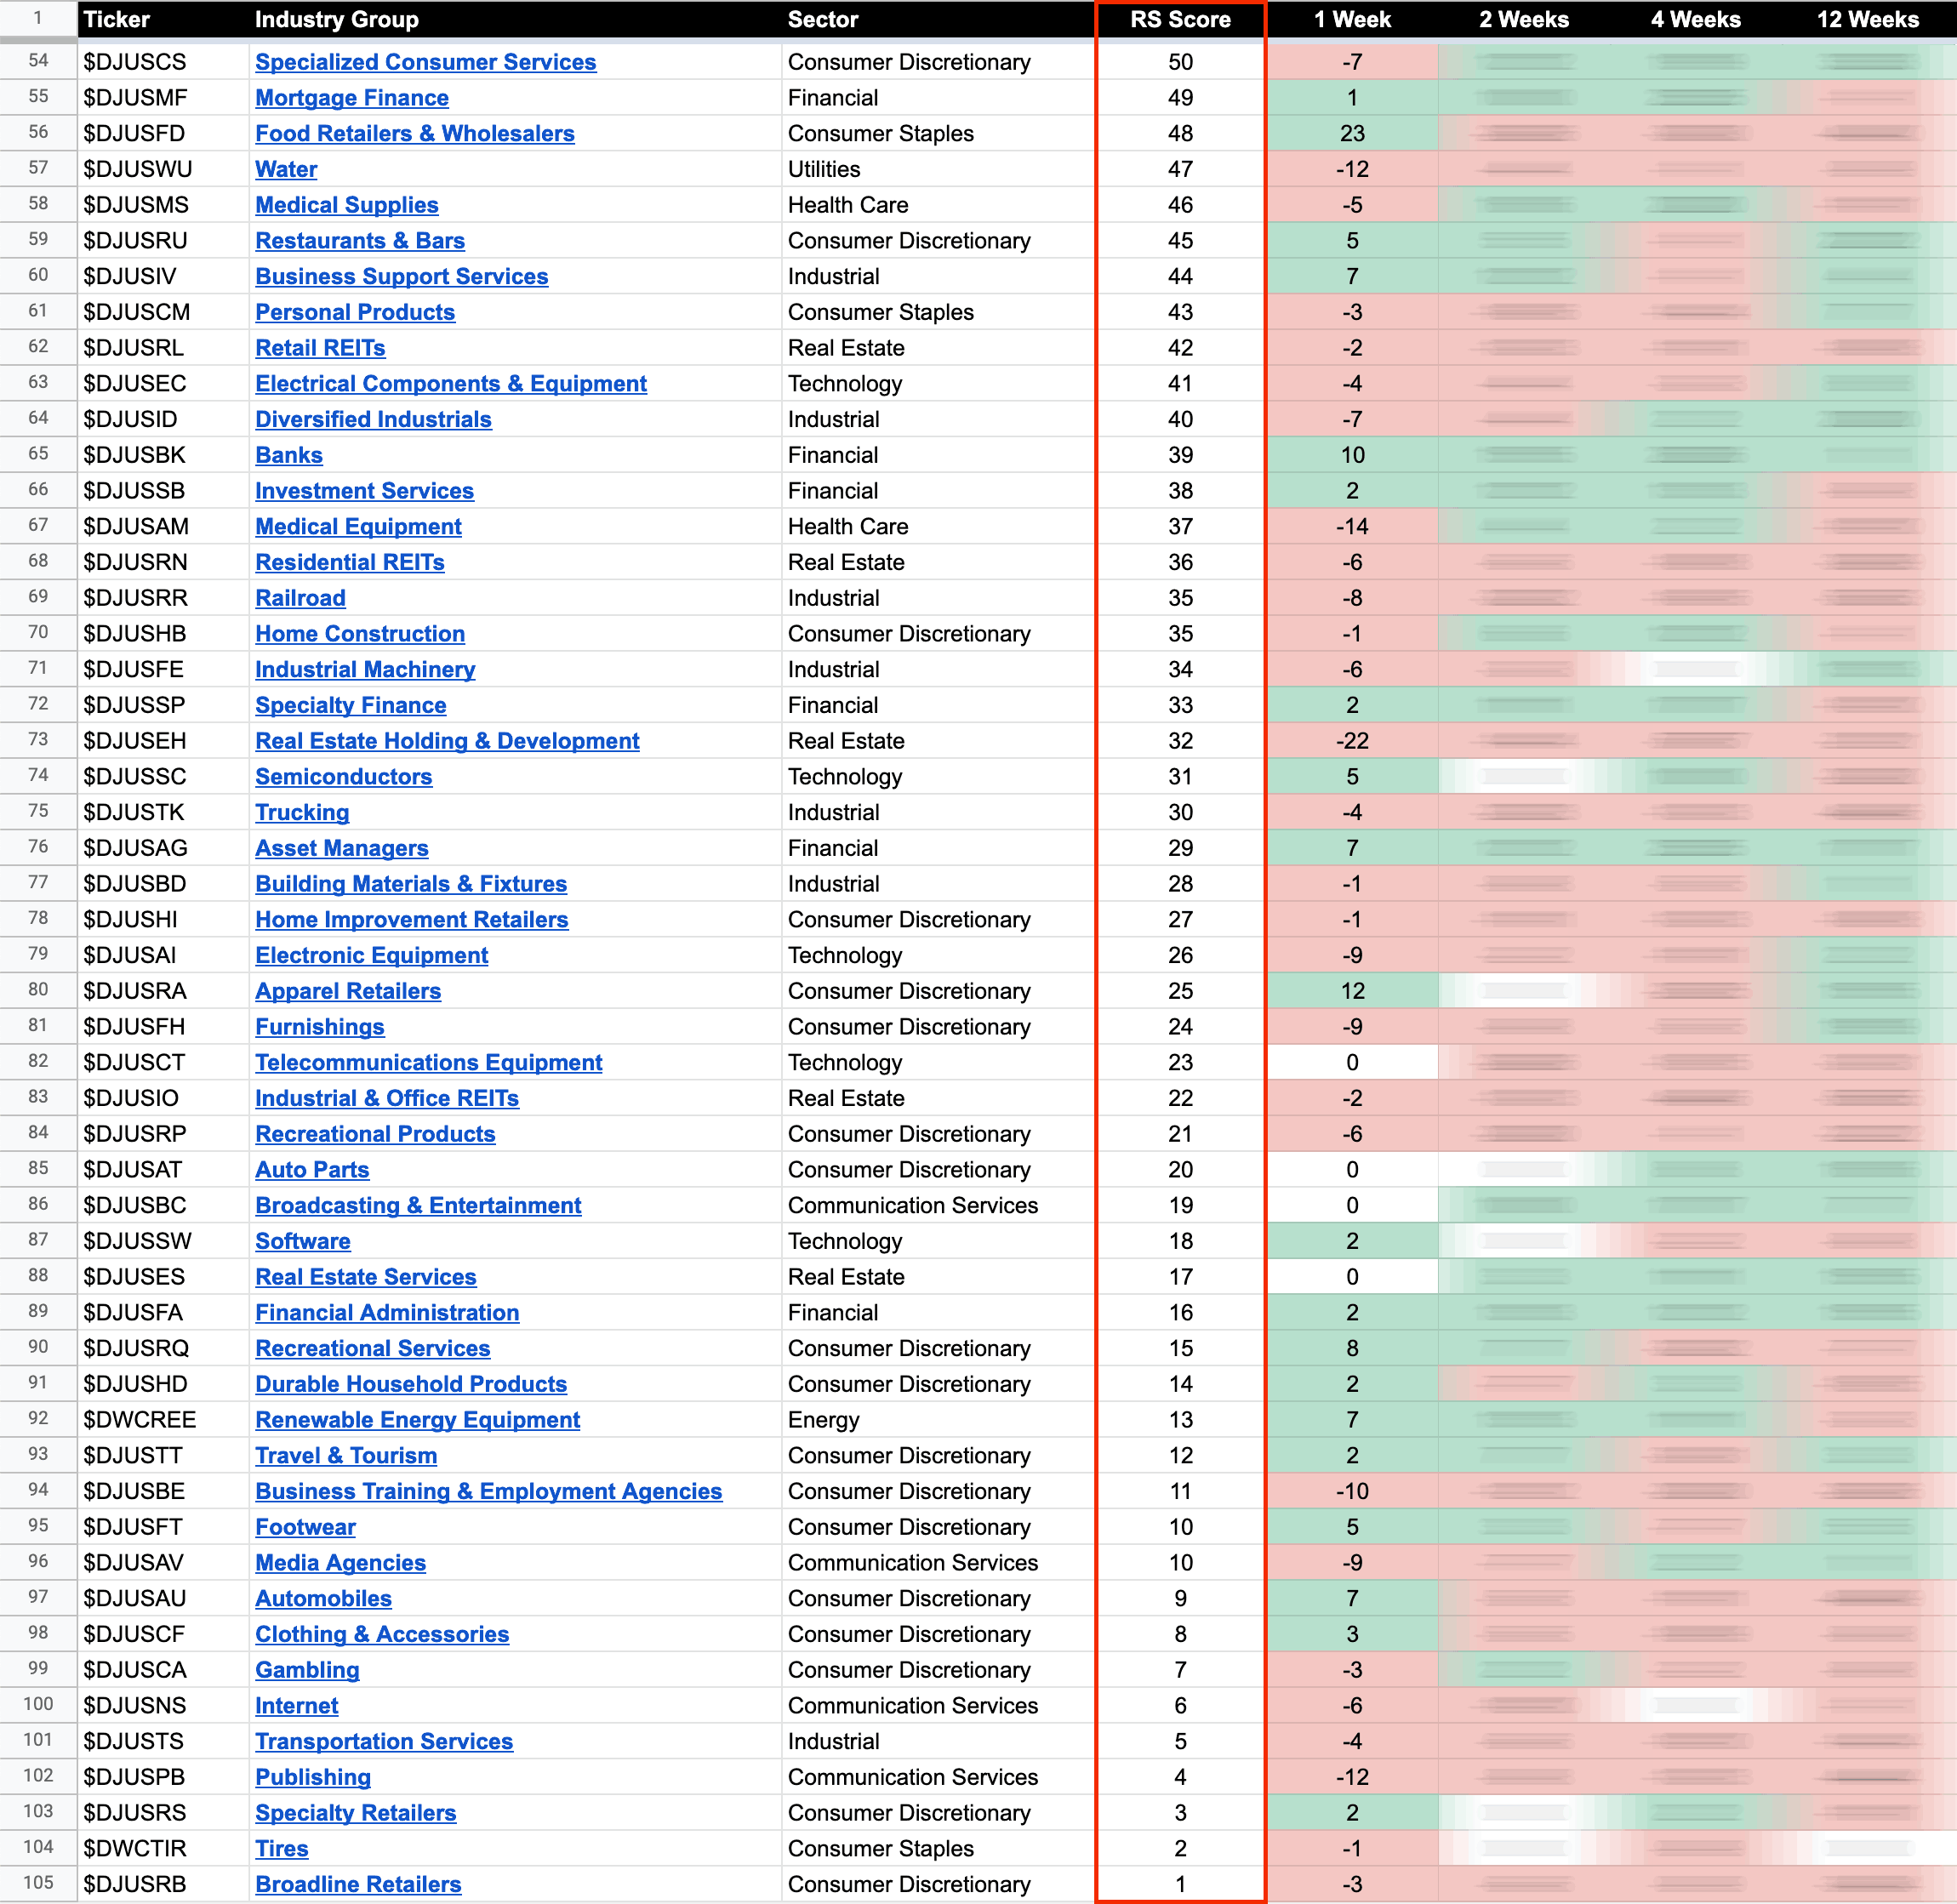
104 Dow Jones Industry Groups sorted by Relative Strength
The purpose of the Relative Strength (RS) tables is to track the short, medium and long term RS changes of the individual groups to find the new leadership earlier than the crowd.
RS Score of 100 is the strongest, and 0 is the weakest.
In the Stage Analysis method we are looking to focus on the strongest groups, as what is strong, tends to stay strong for a long time. But we also want to find the improving / up and coming groups that are starting to rise up strongly through the RS table from the lower zone, in order to find the future leading stocks before they breakout from a Stage 1 base and move into a Stage 2 advancing phase.
Each week I go through the most interesting groups on the move in more detail during the Stage Analysis Members weekend video – as Industry Group analysis is a key part of Stan Weinstein's Stage Analysis method.
Become a Stage Analysis Member:
To see more like this – US Stocks watchlist posts, detailed videos each weekend, use our unique Stage Analysis tools, such as the US Stocks & ETFs Screener, Charts, Market Breadth, Group Relative Strength and more...
Join Today
Disclaimer: For educational purpose only. Not investment advice. Seek professional advice from a financial advisor before making any investing decisions.