
Market Breadth: Percentage of Stocks Above their 50 Day, 150 Day & 200 Day Moving Averages Combined
The full post is available to view by members only. For immediate access:
16.61% (-0.16% 1wk)
Status: Very Difficult Environment in Stage 4 zone
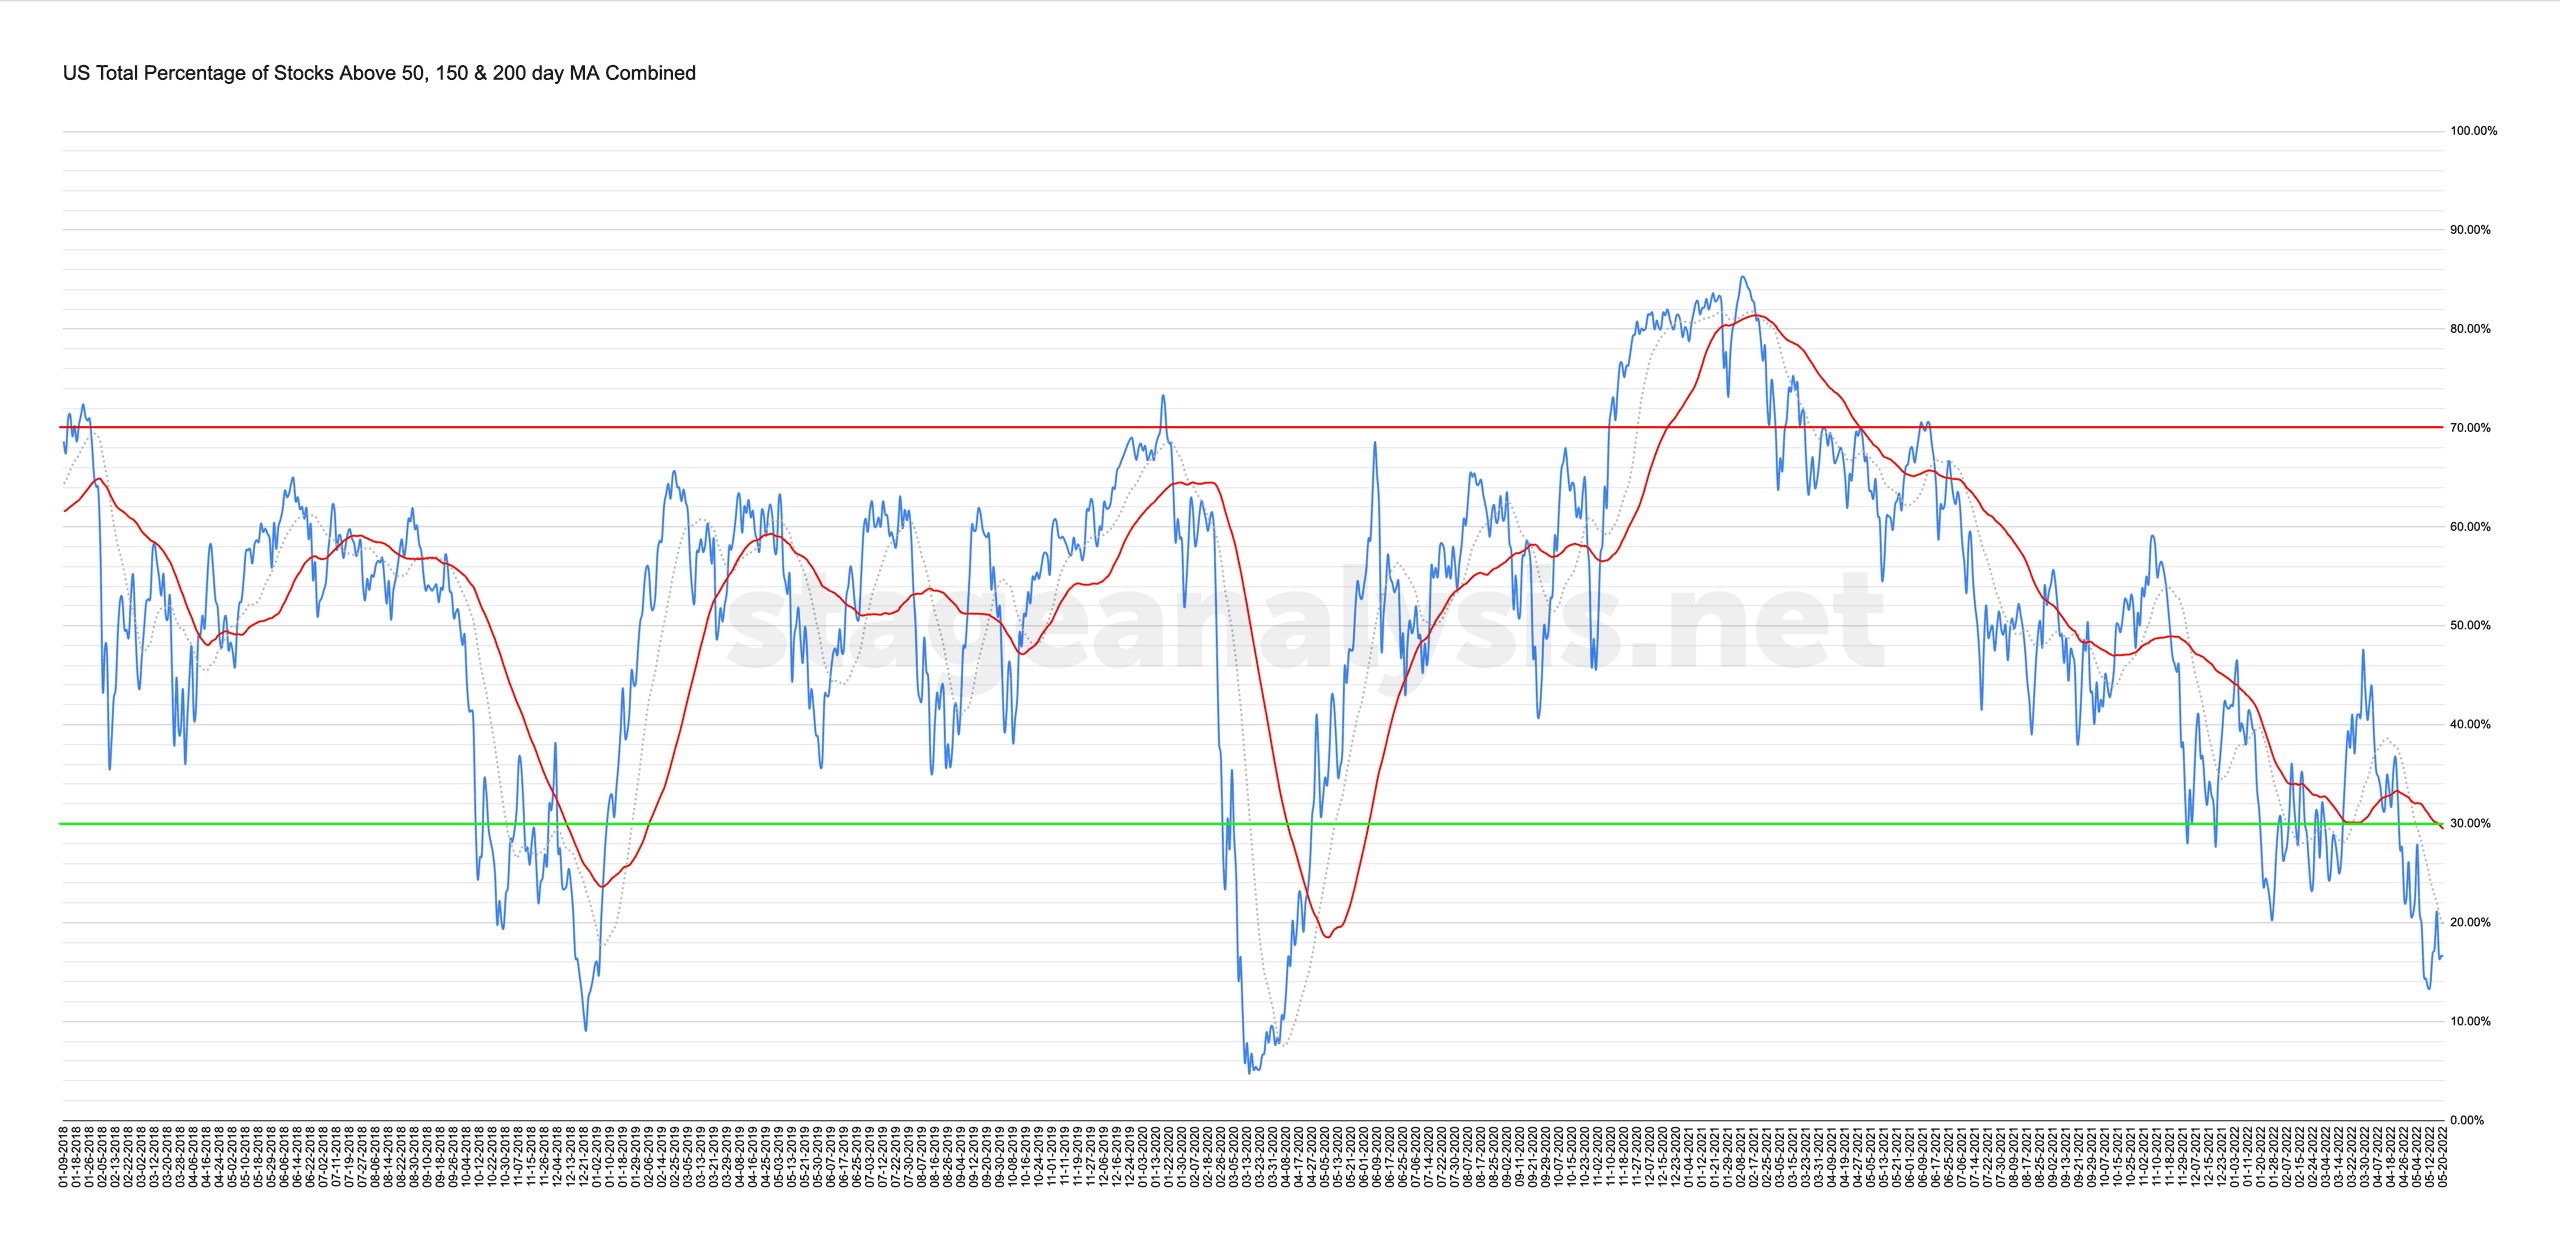
The US Total Percentage of Stocks Above their 50 Day, 150 Day & 200 Day Moving Averages Combined chart rebounded back towards its short term 20 day MA on Tuesday, but rolled over once more to close the week slightly lower at 16.61%. So it remains deep in the lower zone in Stage 4 and needs to reverse around 13% currently to get back to its own 50 day MA that is used as the signal line between a difficult and positive environment.
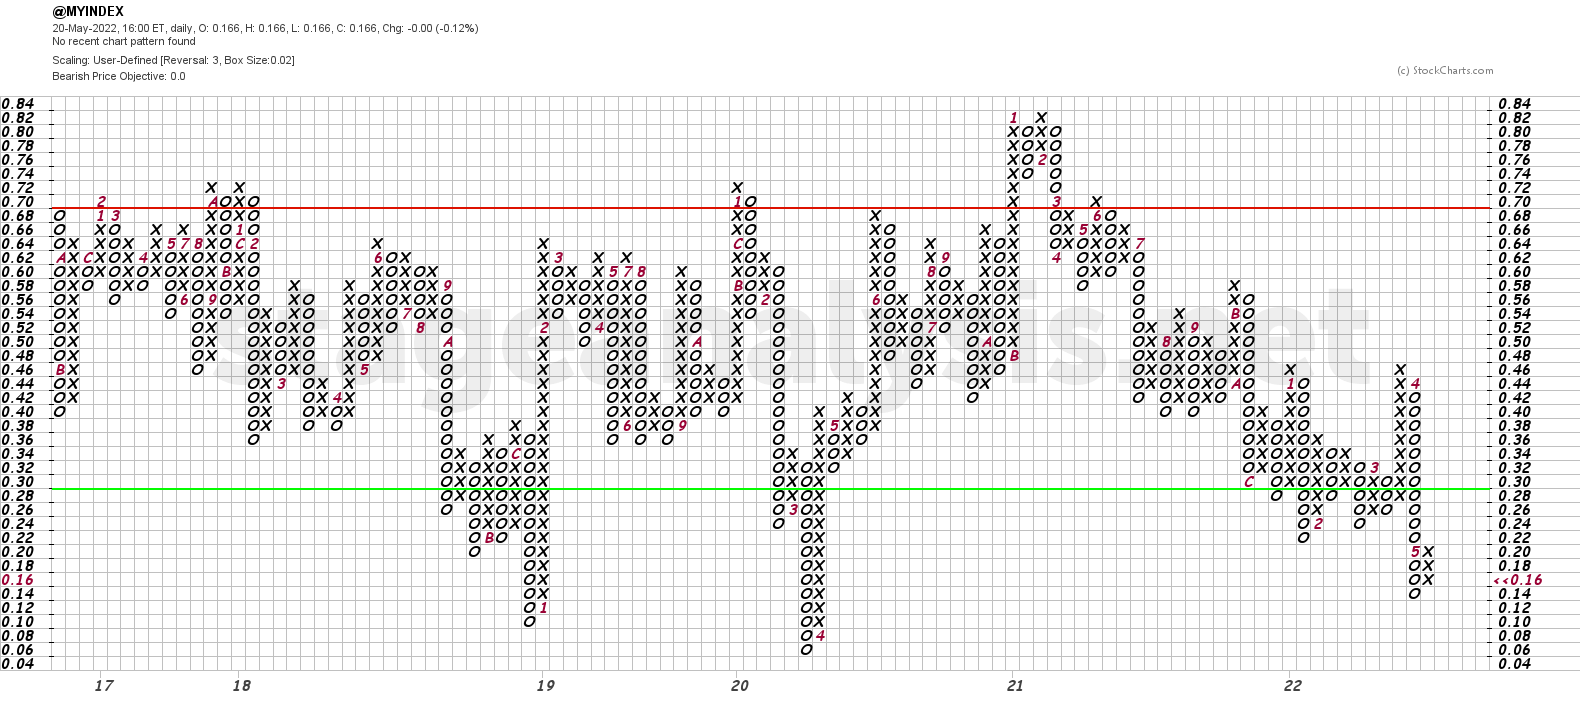
The Point and Figure chart (see below), reversed to a column of Xs this week in the lower zone and so changes the status to a tentative Bull Alert status, as it's a reversal deep in the lower zone and closed the week near to the bottom again, and so could easily flip back a column of Os if the market weakens further – which would change it back to Bear Confirmed status again. As multiple reversals from Os to Xs and back again in the lower zone are common when the market is in deep Stage 4.
See the 2018 bottom for example which had four reversals to Bull Alert status before it finally stuck and moved to higher levels in January 2019. And the Covid bottom in March 2020 had two reversals to Bull Alert before it pushed through to bullish levels once more.
I'll discuss this and the other charts based from this data in more detail in the members weekend video (due out later on Sunday afternoon EST)
Become a Stage Analysis Member:
To see more like this – US Stocks watchlist posts, detailed videos each weekend, use our unique Stage Analysis tools, such as the US Stocks & ETFs Screener, Charts, Market Breadth, Group Relative Strength and more...
Join Today
Disclaimer: For educational purpose only. Not investment advice. Seek professional advice from a financial advisor before making any investing decisions.