
Market Breadth: Percentage of Stocks Above their 50 Day, 150 Day & 200 Day Moving Averages Combined
The full post is available to view by members only. For immediate access:
16.77% (-2.98% 1wk)
Status: Very Difficult Environment in Stage 4 zone
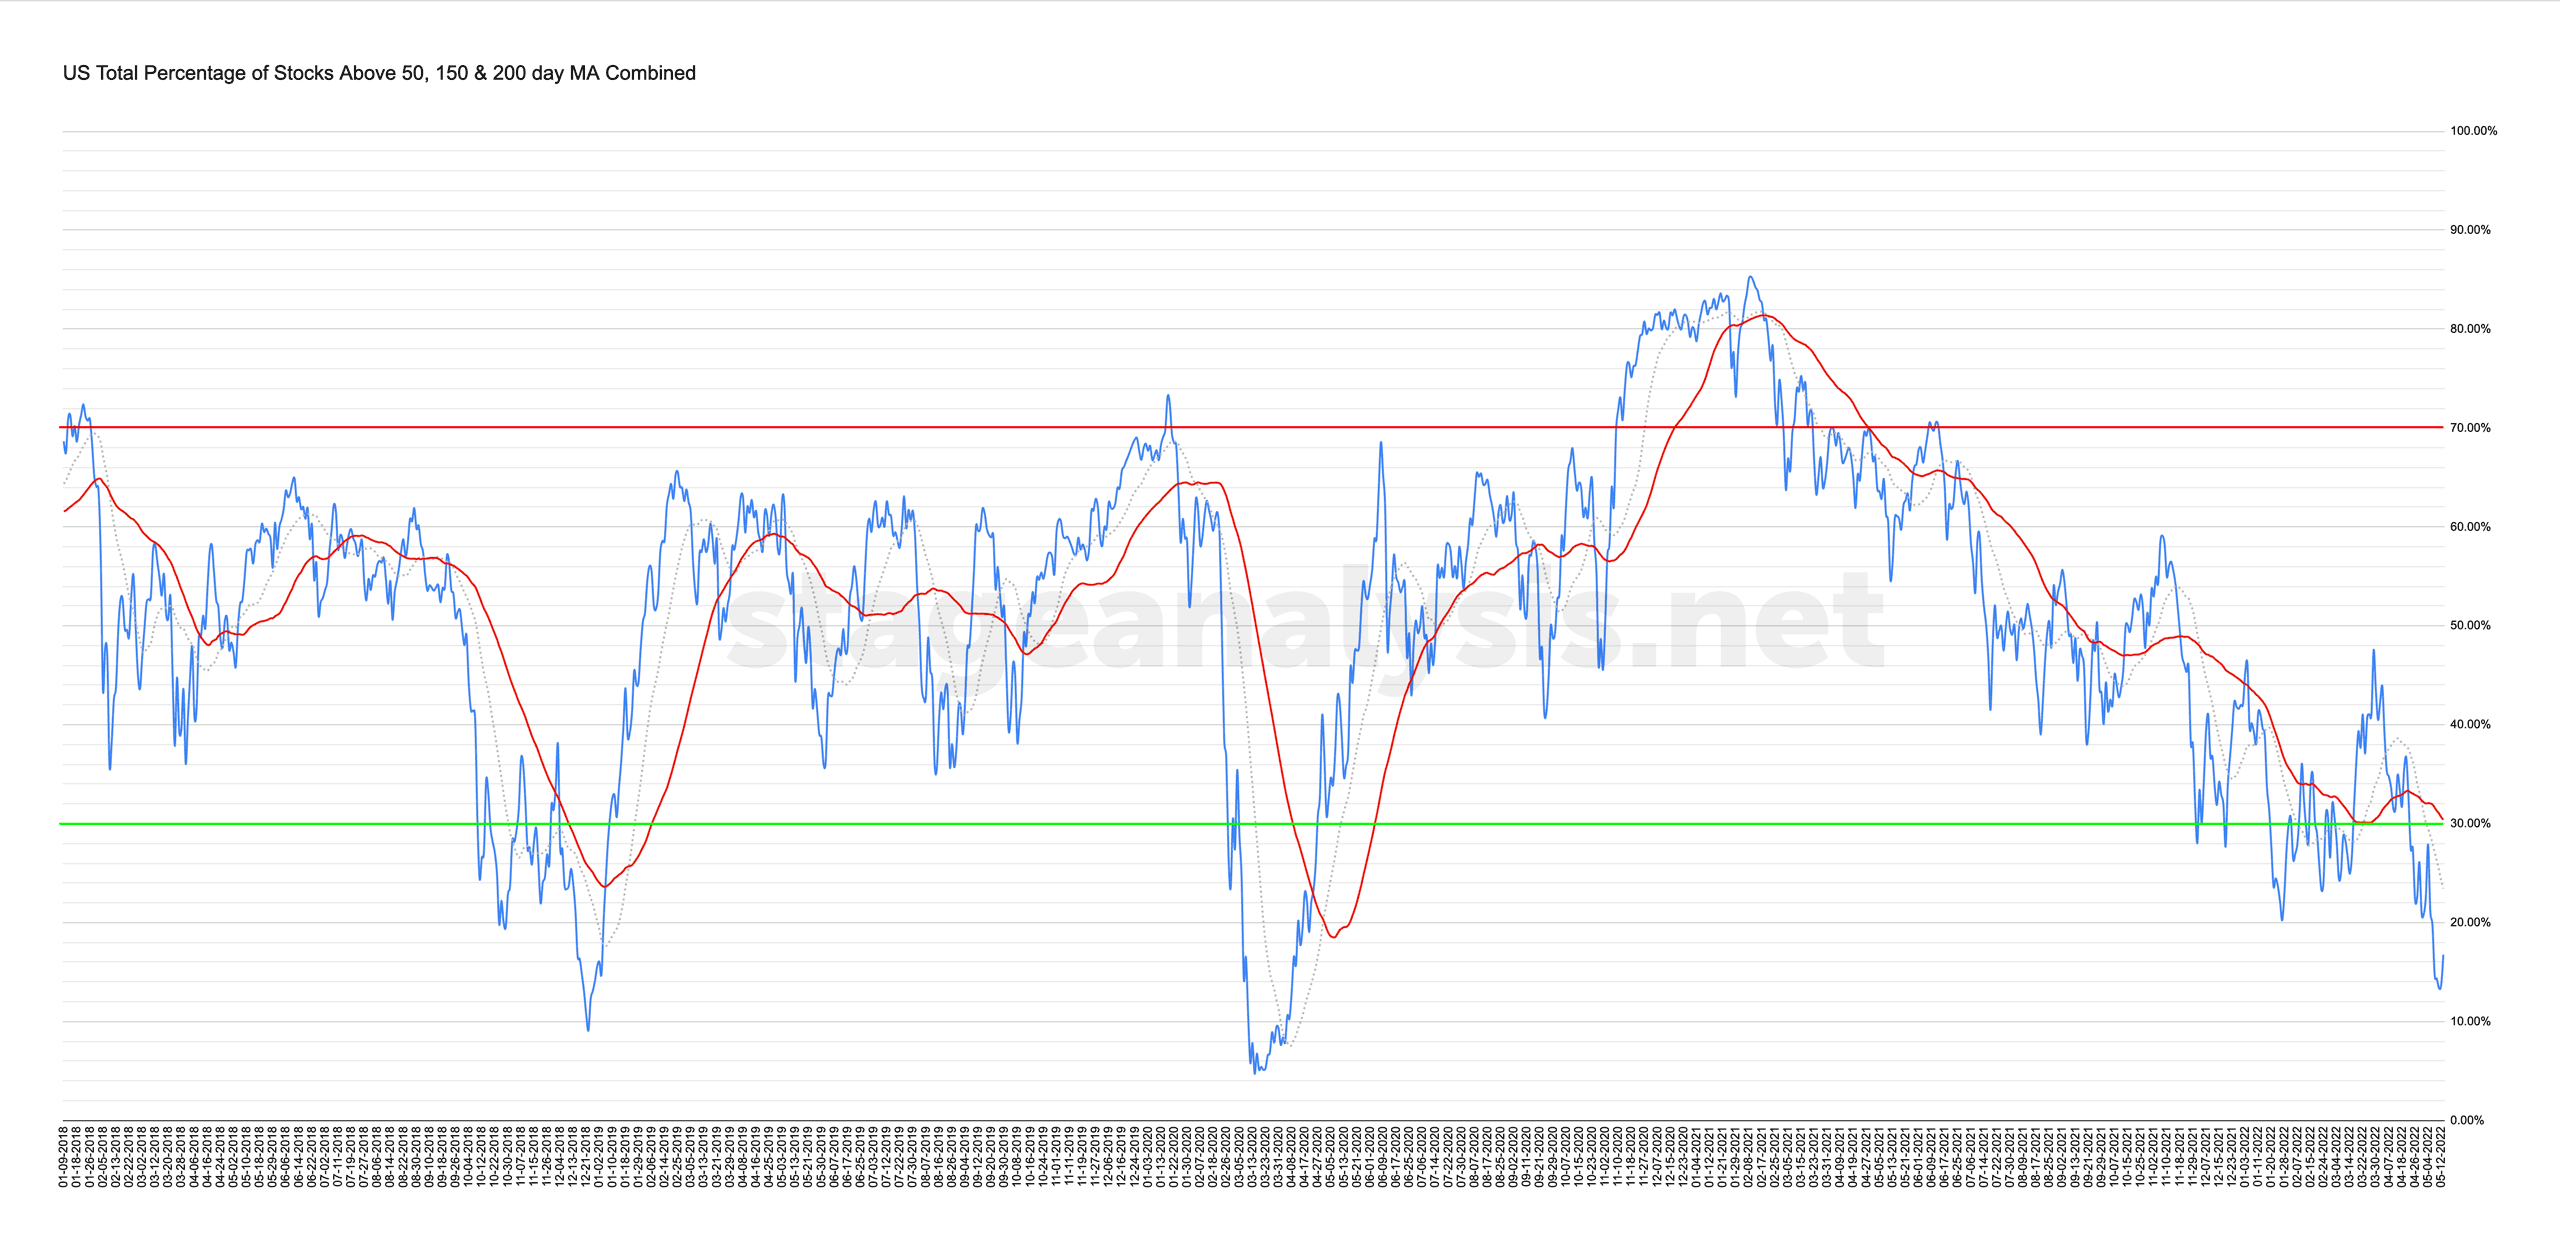
The US Total Percentage of Stocks Above their 50 Day, 150 Day & 200 Day Moving Averages Combined chart declined deeper in to the lower zone this week with it reaching a new closing low at 13.39% on Wednesday. But then recovered strongly into the end of the week to close at 16.77%. So it still declined a further -2.98%, even with Fridays strong bounce in the market from the lows.
If you look back through the recent years. The breadth data is looking somewhat similar in structure to the late 2018 stay in the lower zone. Although the current visit to the lower zone has been much longer than that of 2018, and hence the market has been much weaker than during that period.
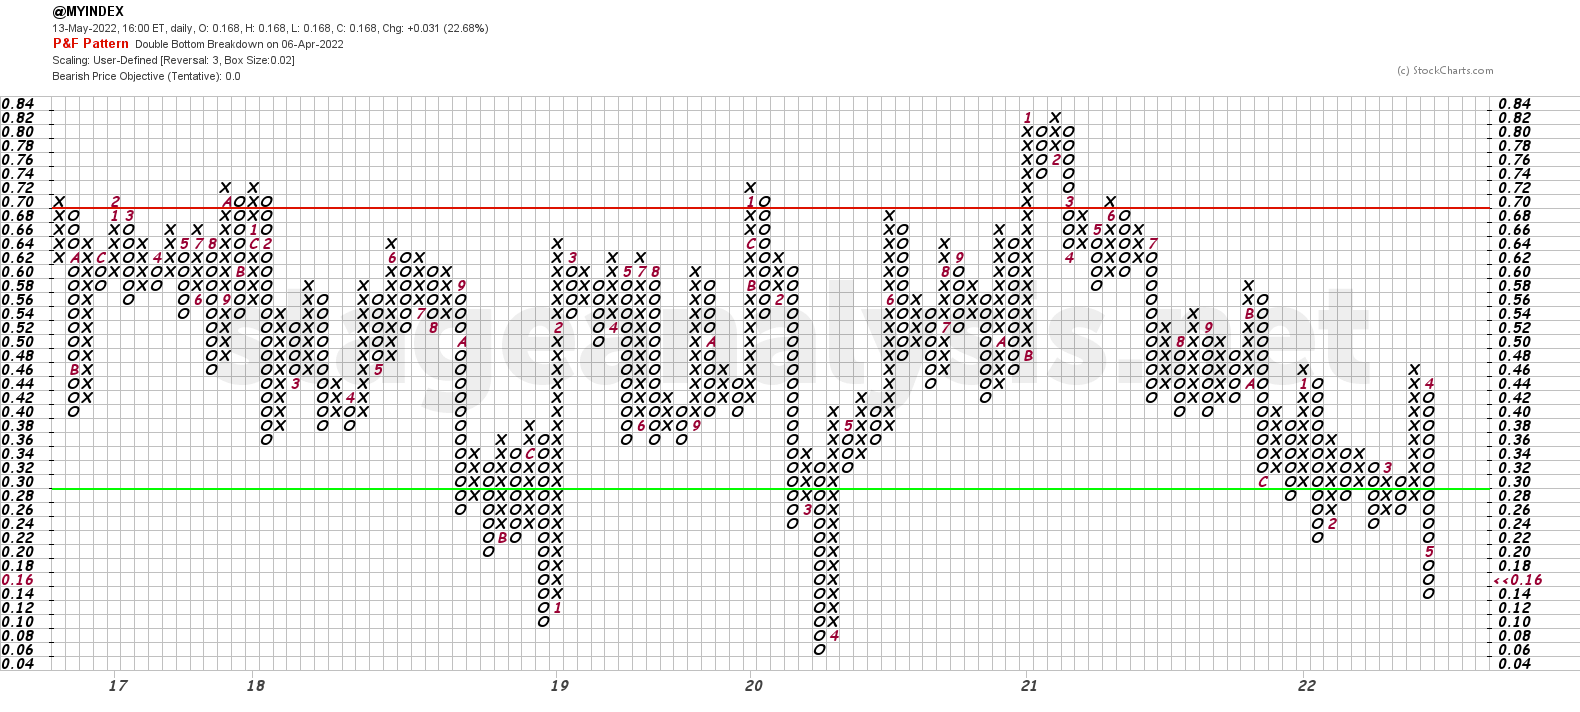
The Point and Figure chart (see below), added a further 3 Os to its current column this week and remains on Bear Confirmed status currently. But if the short term bounce follows through next week, then it could see a reversal to a columns of Xs which would change the status to Bull Alert. So to make the change in status it would need to move above the 20% level. But it would be a status change still under the key 30% level, and hence would have higher risk.
I'll discuss this and the other charts based from this data in more detail in the members weekend video (due out later on Sunday afternoon EST)
Become a Stage Analysis Member:
To see more like this – US Stocks watchlist posts, detailed videos each weekend, use our unique Stage Analysis tools, such as the US Stocks & ETFs Screener, Charts, Market Breadth, Group Relative Strength and more...
Join Today
Disclaimer: For educational purpose only. Not investment advice. Seek professional advice from a financial advisor before making any investing decisions.