
US Stocks Industry Groups Relative Strength Rankings
The full post is available to view by members only. For immediate access:
US Industry Groups by Highest RS Score
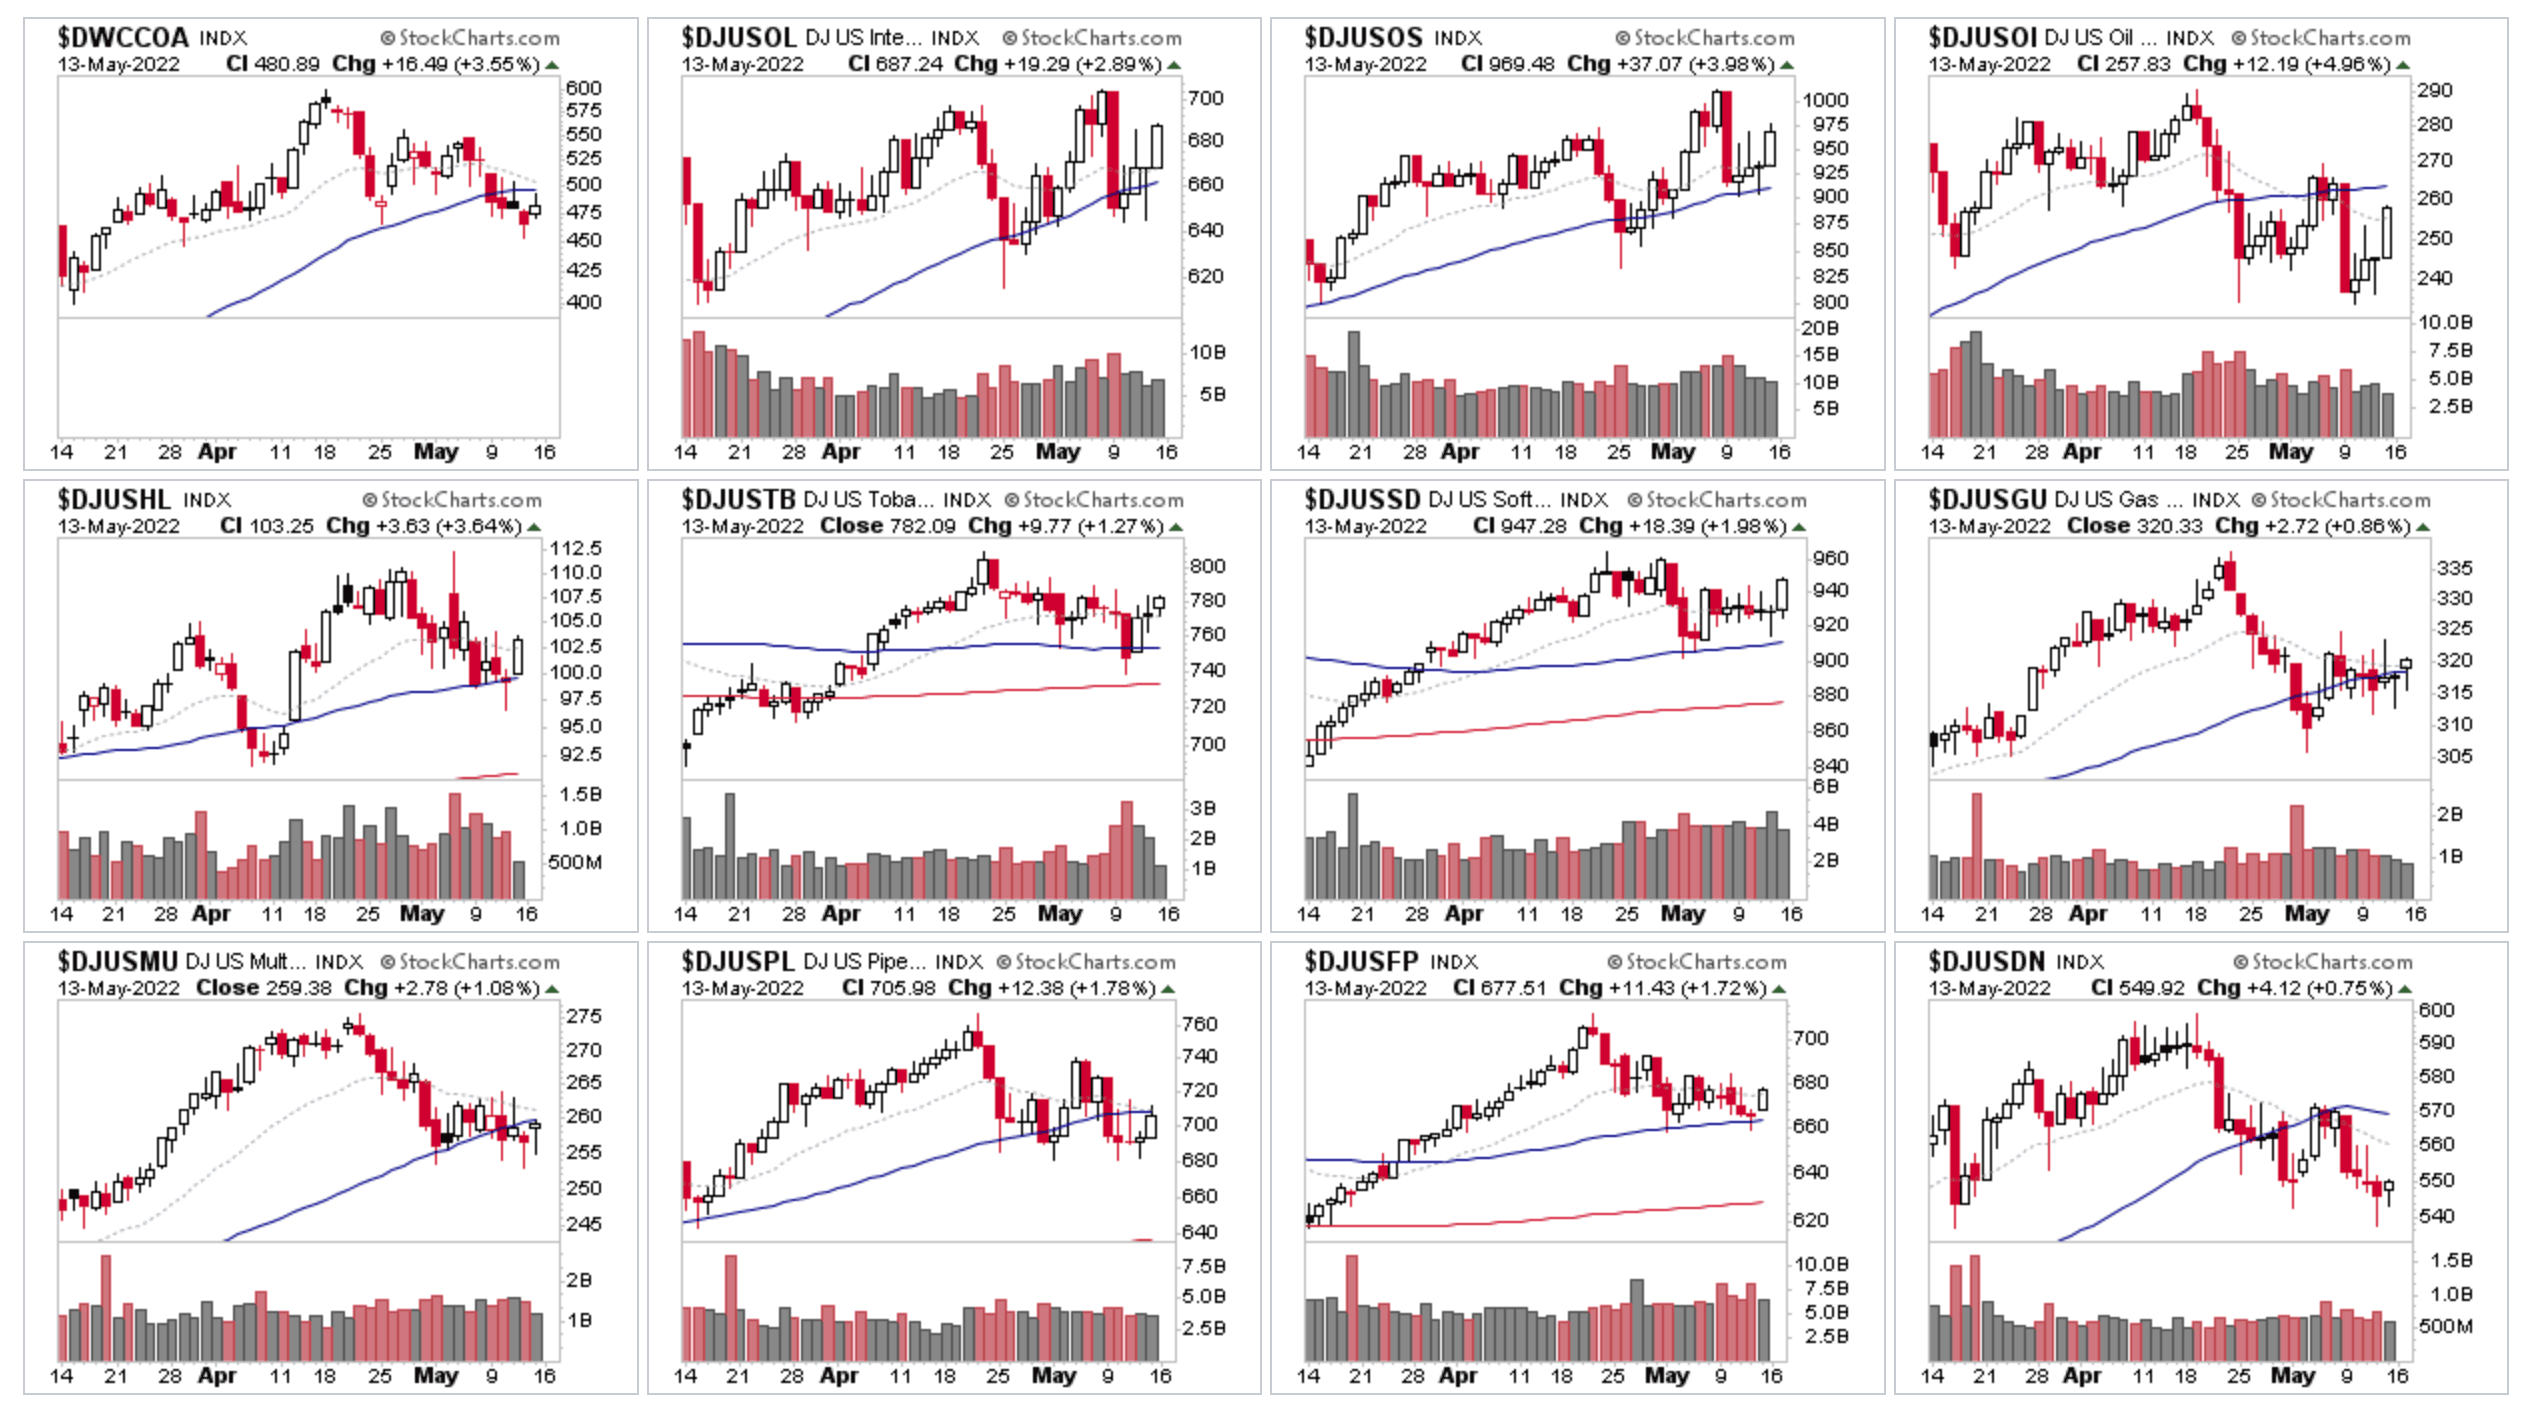
Above is the top 12 industry groups thumbnail charts by Relative Strength (RS) score, which ended the week with their strongest day, but 8 of the top 12 groups had a negative week overall, with leading group Coal dropping -8.46% from the previous week and closing under its 50 day MA, while the Oil groups started the week with a shock liquidation day from the highs, and although they posted a strong day on Friday – all remain well below the high of Mondays Reversal Significant Bar.
So the question that I posed on Mondays post remains open, which was – have we seen the highs for the oil groups, or is there more in tank? Which could be answered as soon as this coming week, as the groups are reaching a pivotal point in their short term base structures.
US Industry Groups by Weakest RS Score
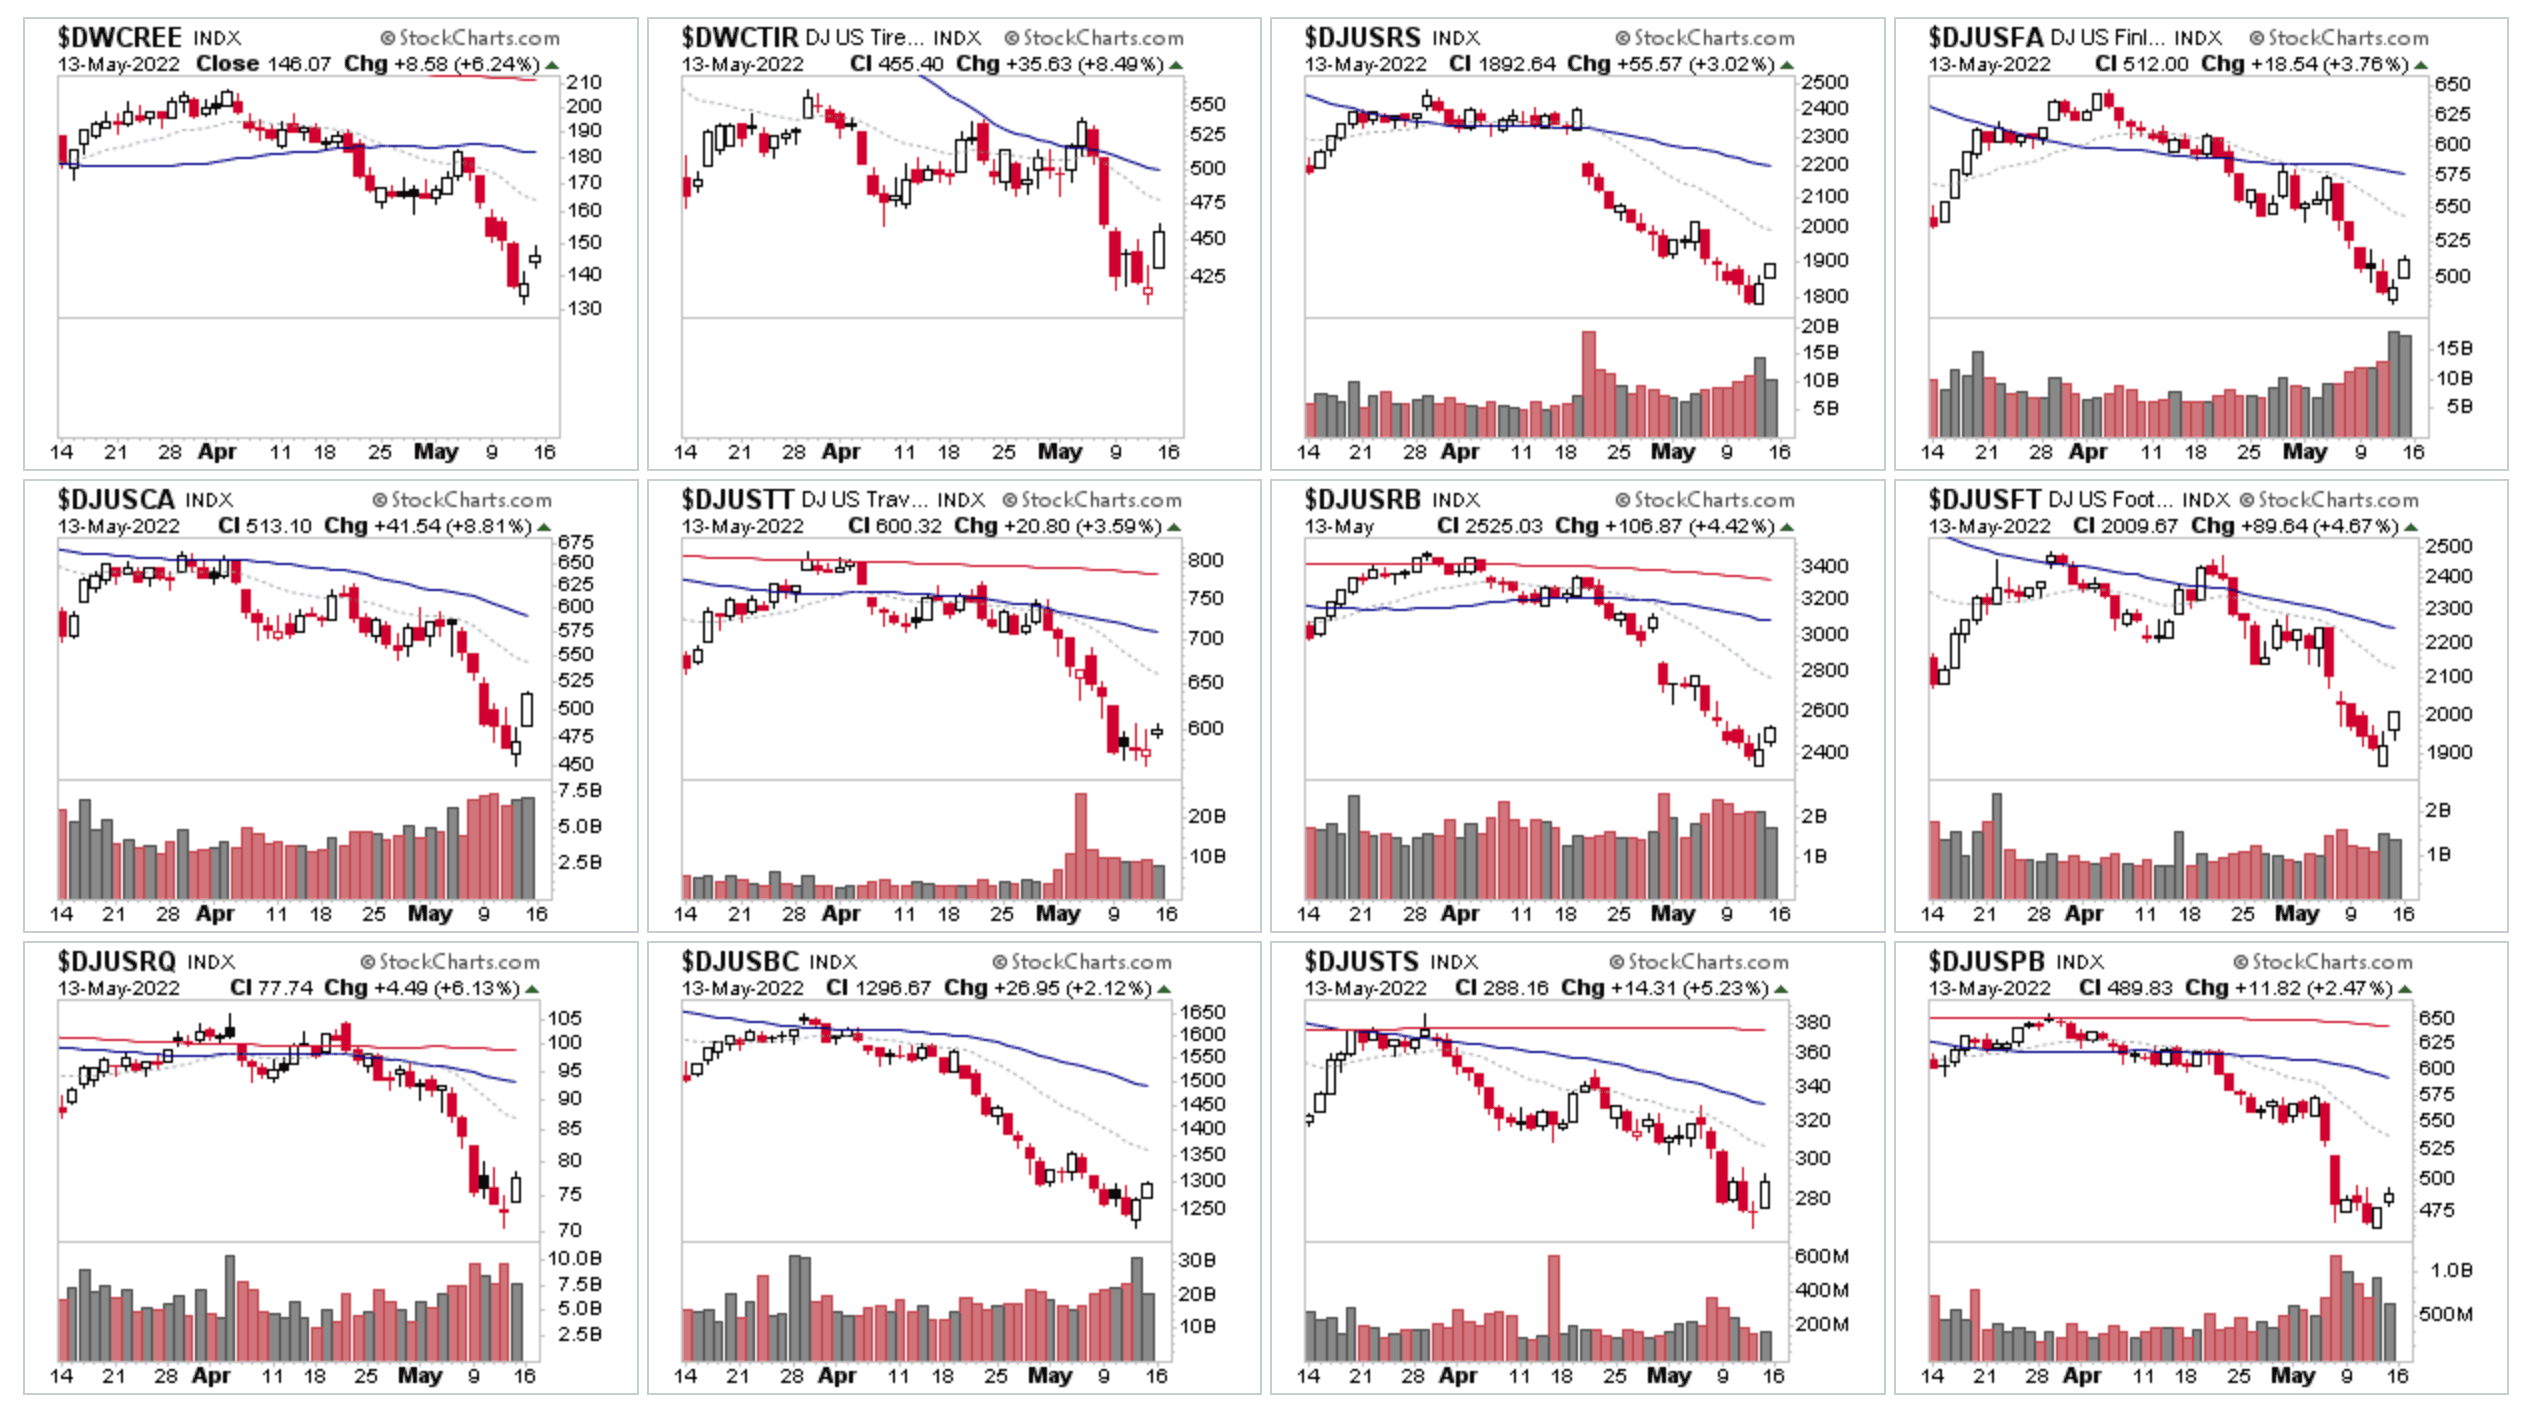
The weakest RS group remains Renewable Energy, which was saved from a bigger decline by a strong day on Friday up +6.24% on the day, but still closed -10.64% lower this week with a Stage 4 continuation breakdown attempt. However, Friday's reaction higher showed some demand is present and left a demand tail on the weekly candle which brought it back into the recent range.
The majority of other weak RS groups also saw strong reaction bounces on Friday, with big percentage moves in a lot of beaten down stocks. So have we seen a short term low as a local Selling Climax (SC)?
It's too early to say, as its only Day 2 of the reaction. But if it was, then the expectation would be an Automatic Rally (AR) that's bigger than the previous reactions in the short term downtrend that defines the range of a new base. But we will see how price and volume develops next week, as it could just as easily be another minor reaction within the broader Stage 4 decline. So take it a step at a time.
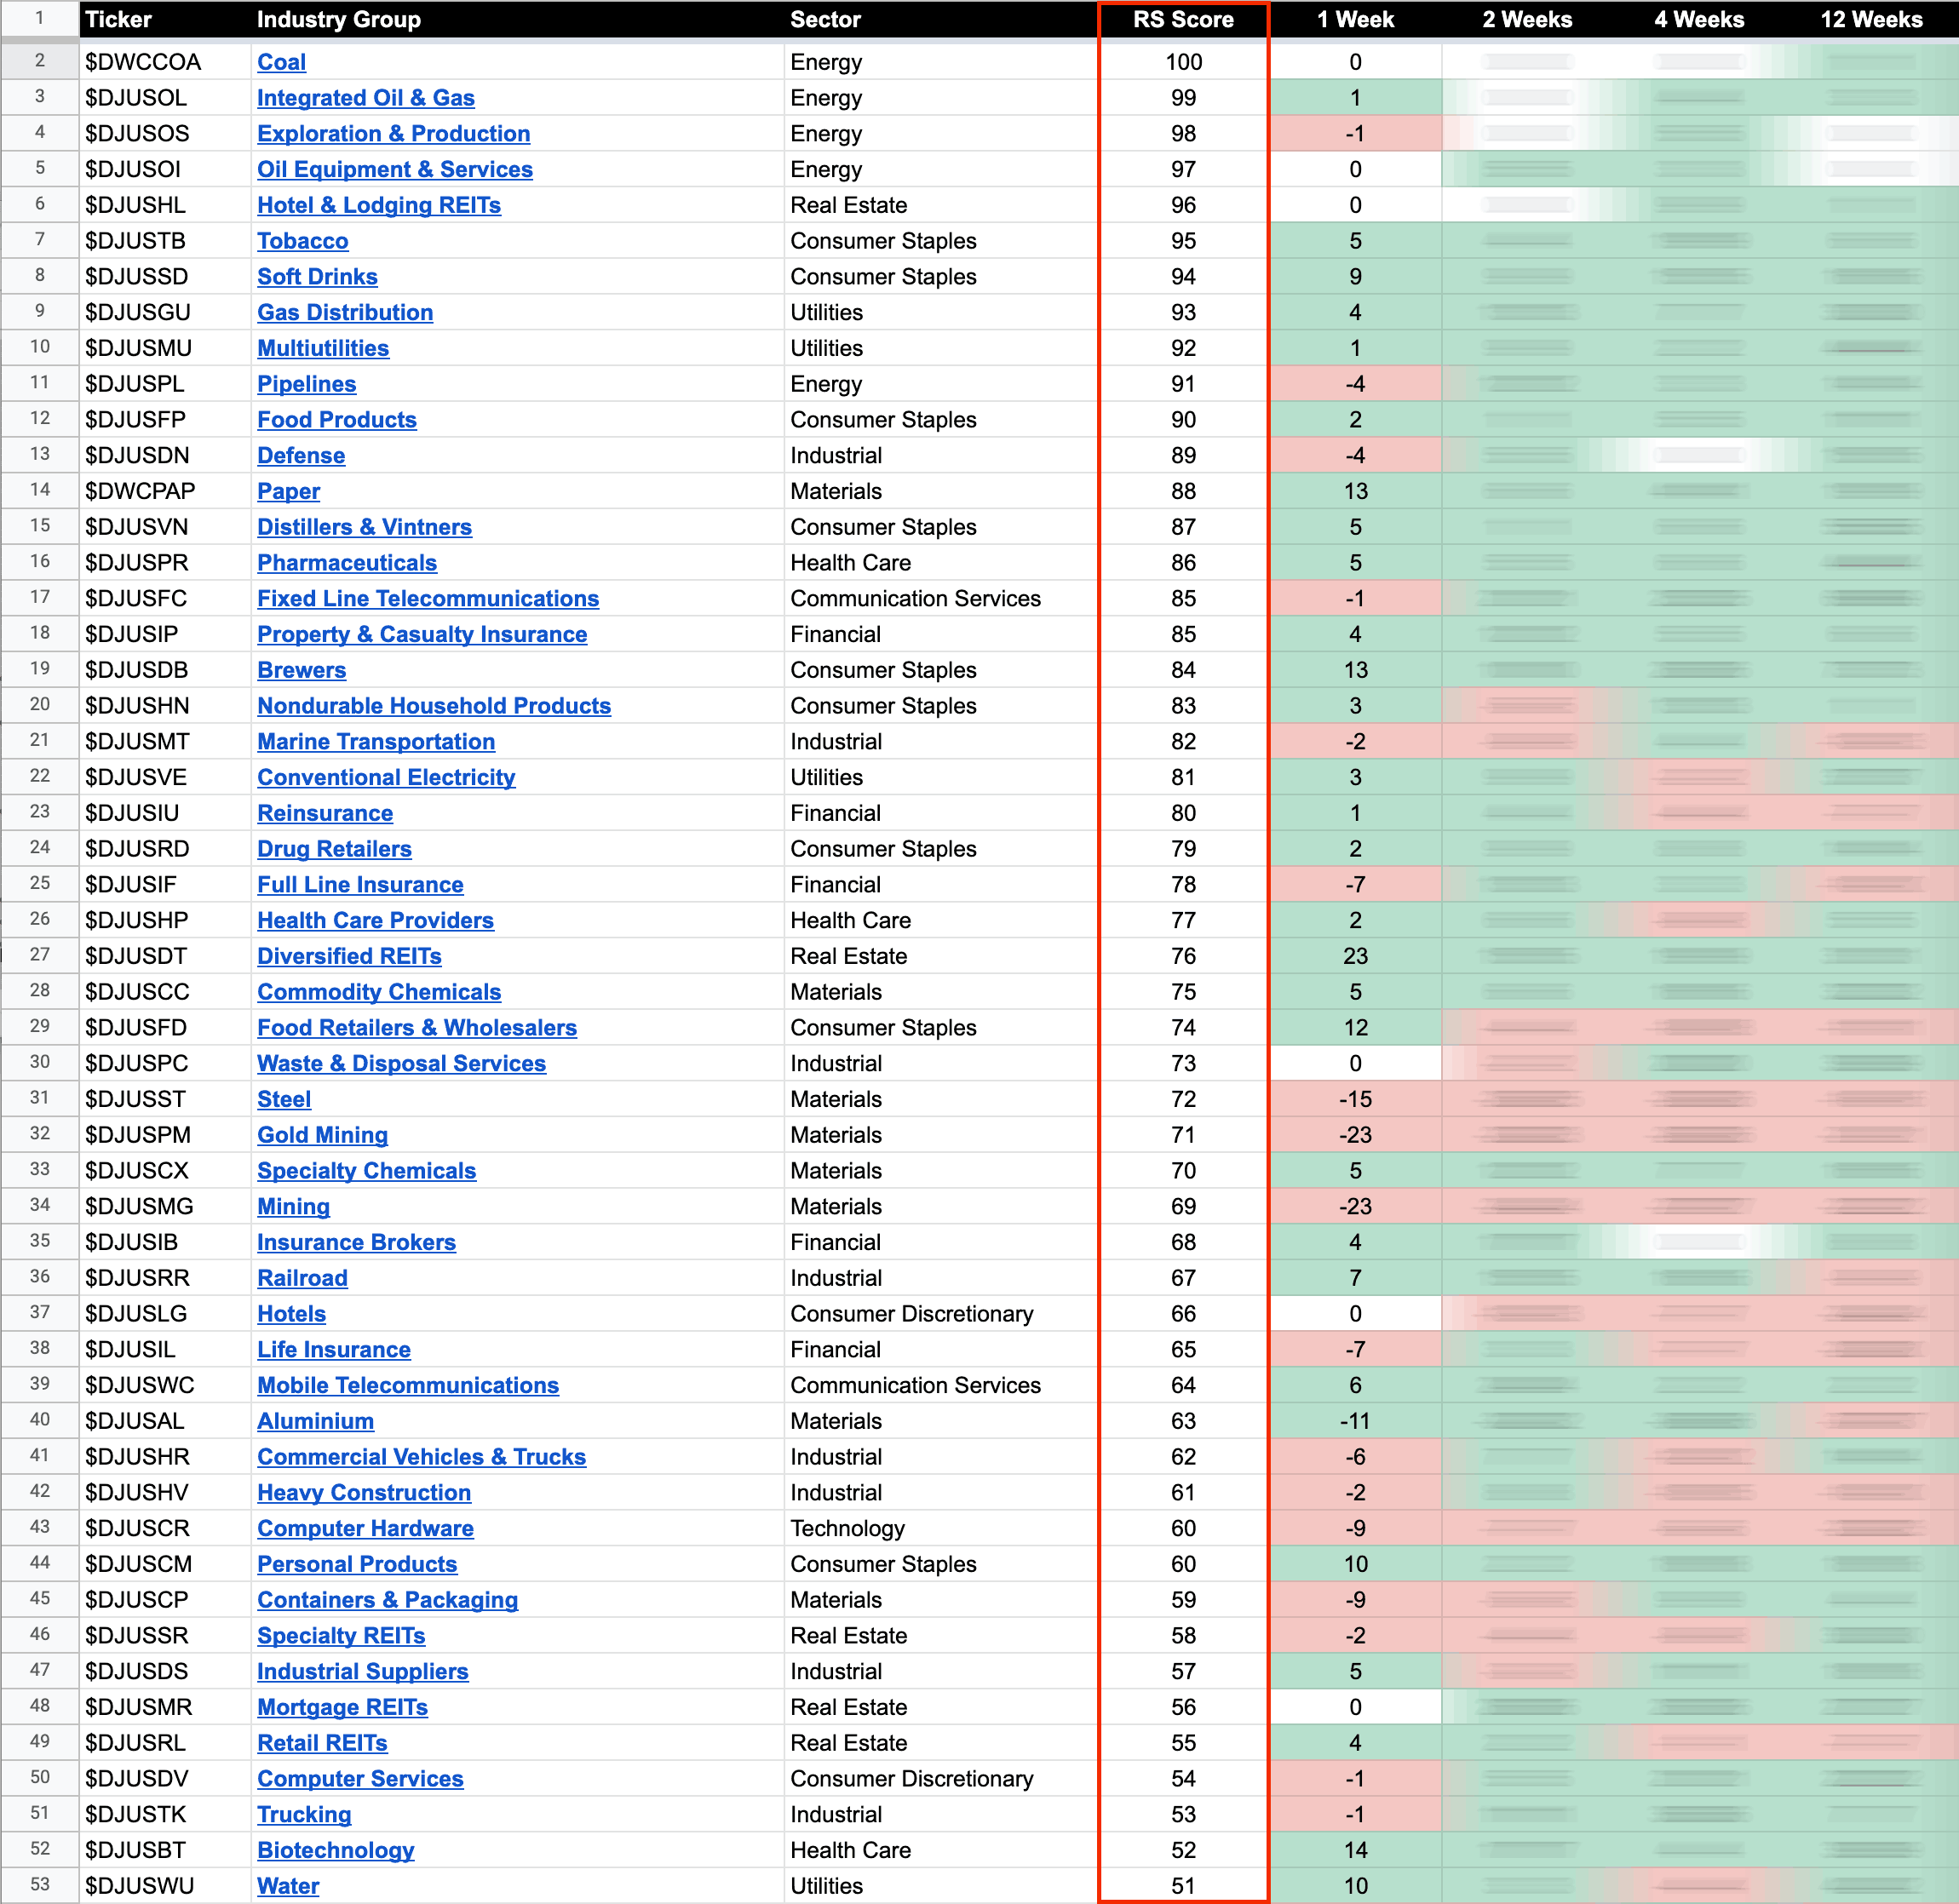
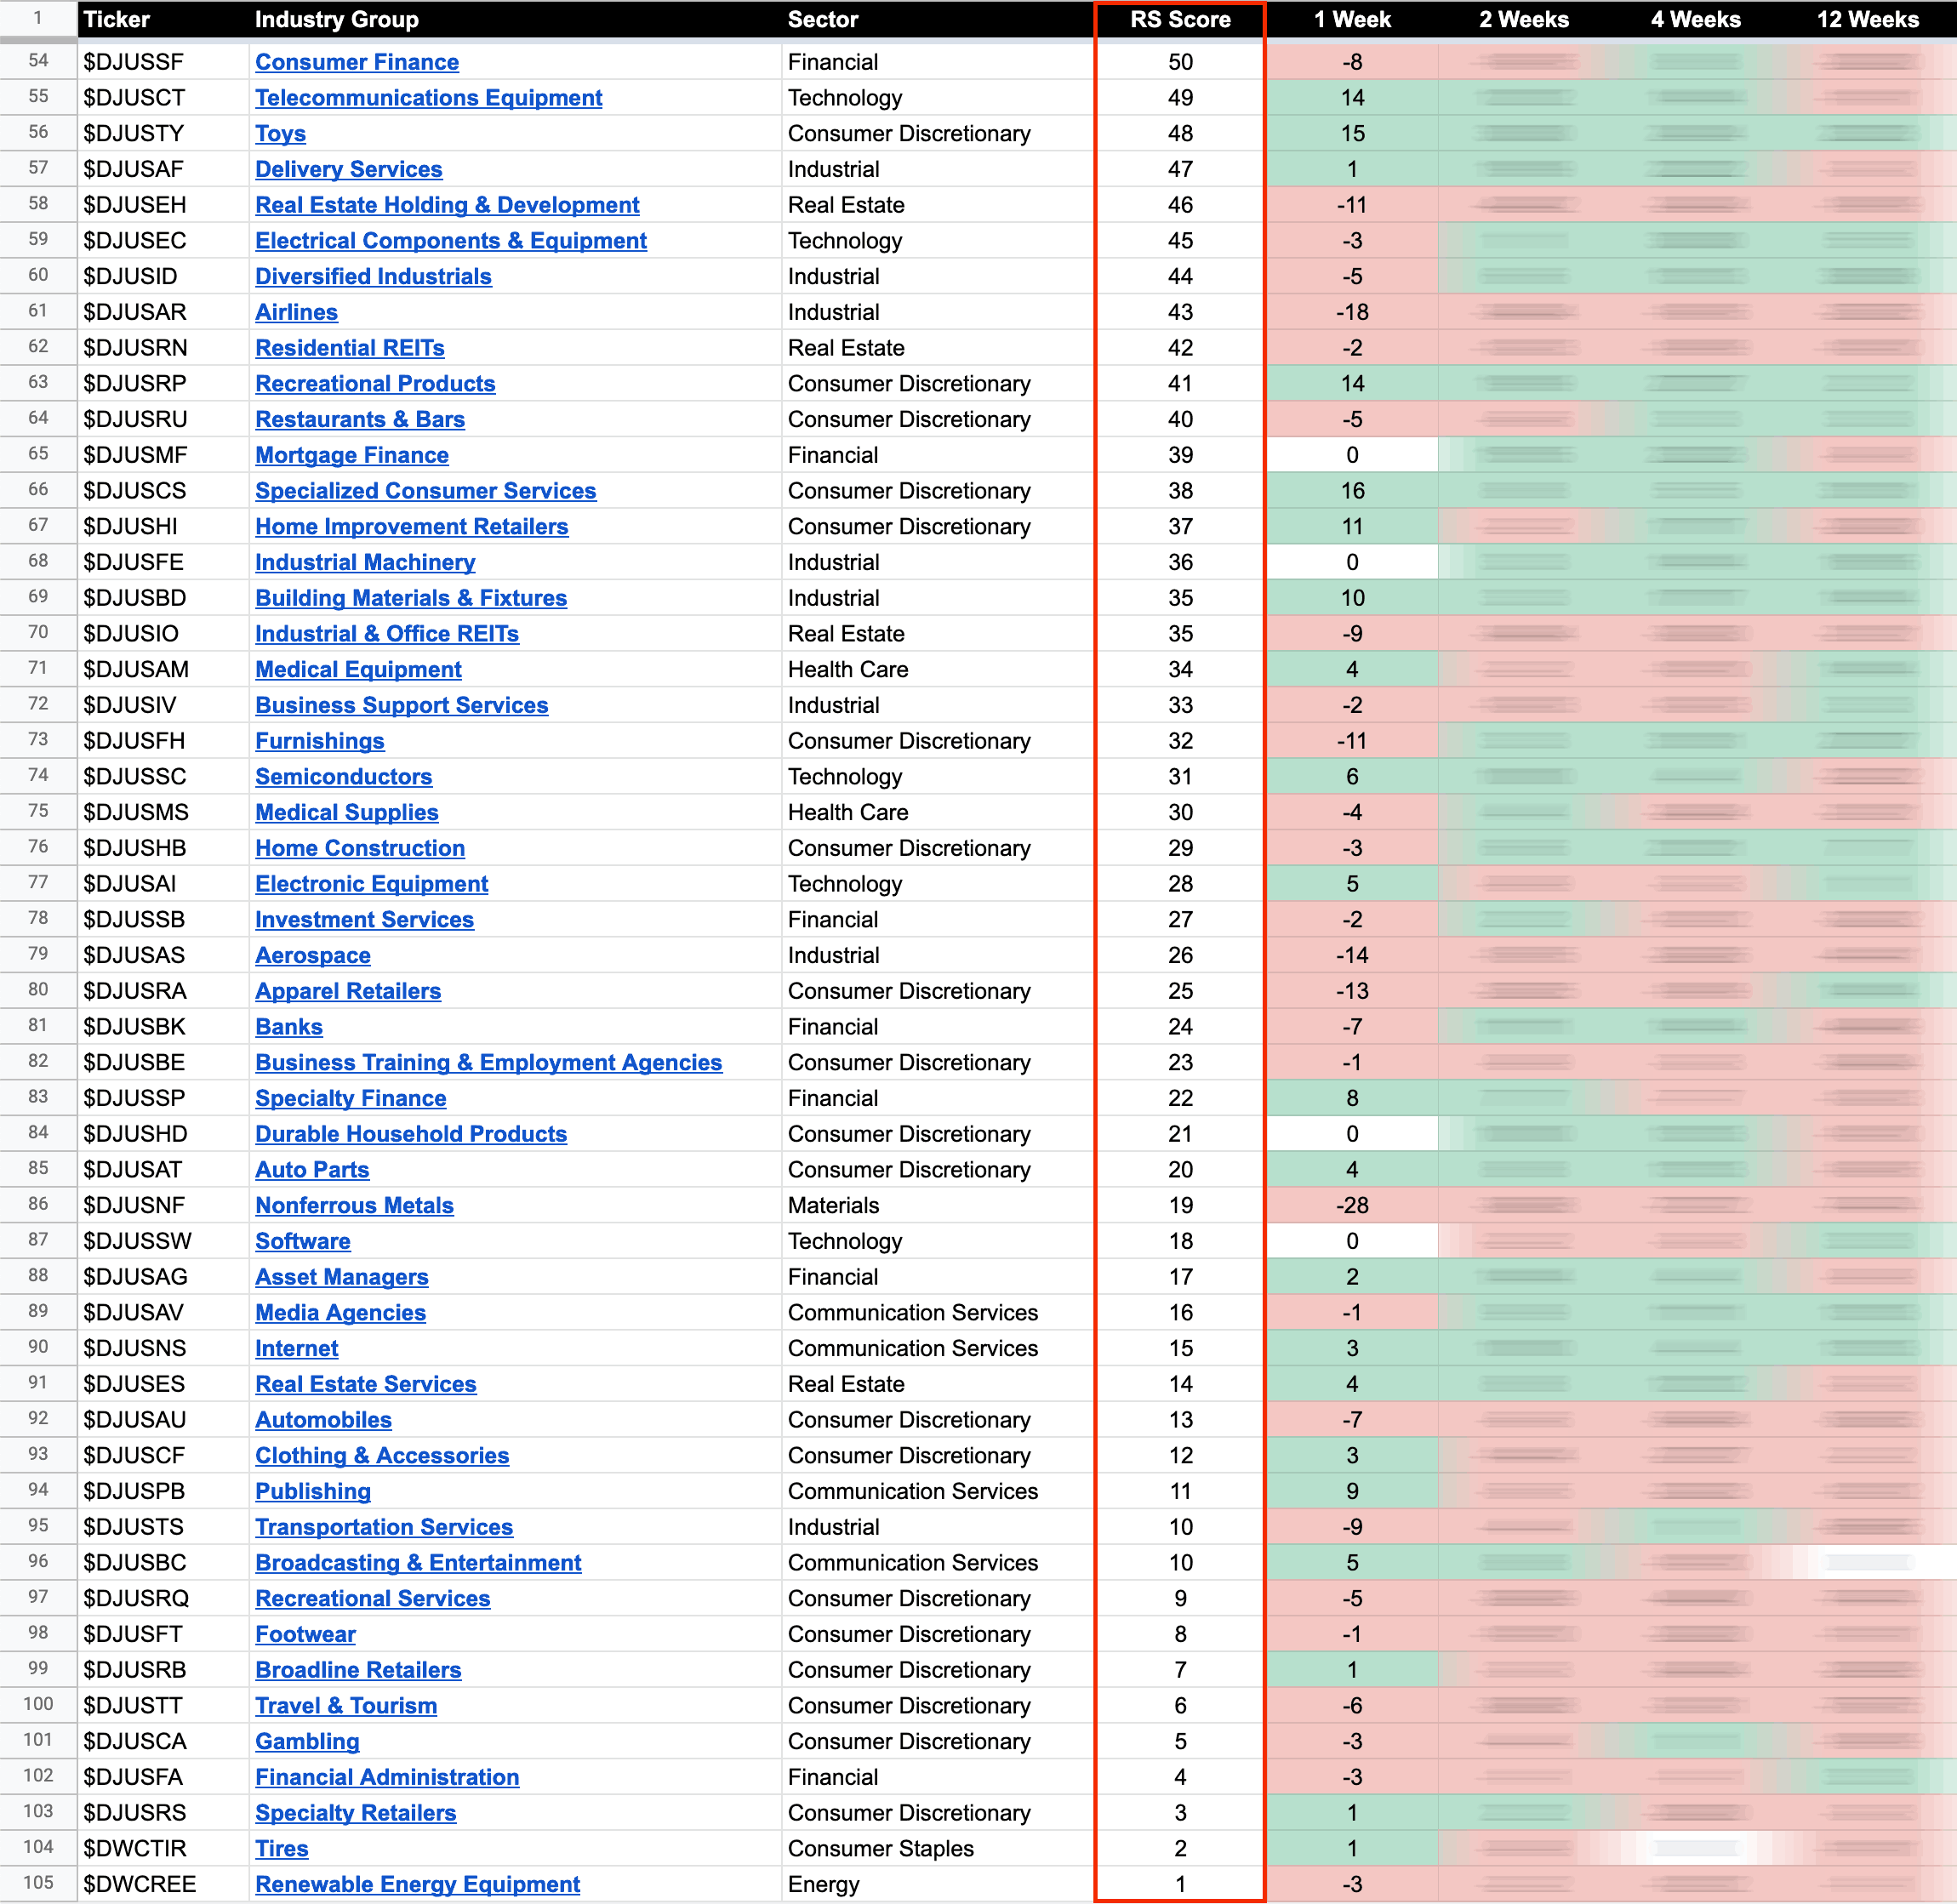
104 Dow Jones Industry Groups sorted by Relative Strength
The purpose of the Relative Strength (RS) tables is to track the short, medium and long term RS changes of the individual groups to find the new leadership earlier than the crowd.
RS Score of 100 is the strongest, and 0 is the weakest.
In the Stage Analysis method we are looking to focus on the strongest groups, as what is strong, tends to stay strong for a long time. But we also want to find the improving / up and coming groups that are starting to rise up strongly through the RS table from the lower zone, in order to find the future leading stocks before they breakout from a Stage 1 base and move into a Stage 2 advancing phase.
Each week I go through the most interesting groups on the move in more detail during the Stage Analysis Members weekend video – as Industry Group analysis is a key part of Stan Weinstein's Stage Analysis method.
Become a Stage Analysis Member:
To see more like this – US Stocks watchlist posts, detailed videos each weekend, use our unique Stage Analysis tools, such as the US Stocks & ETFs Screener, Charts, Market Breadth, Group Relative Strength and more...
Join Today
Disclaimer: For educational purpose only. Not investment advice. Seek professional advice from a financial advisor before making any investing decisions.