
Market Breadth: Percentage of Stocks Above their 50 Day, 150 Day & 200 Day Moving Averages Combined
The full post is available to view by members only. For immediate access:

19.74% (-1.27% 1wk)
Status: Very Difficult Environment in Stage 4 zone
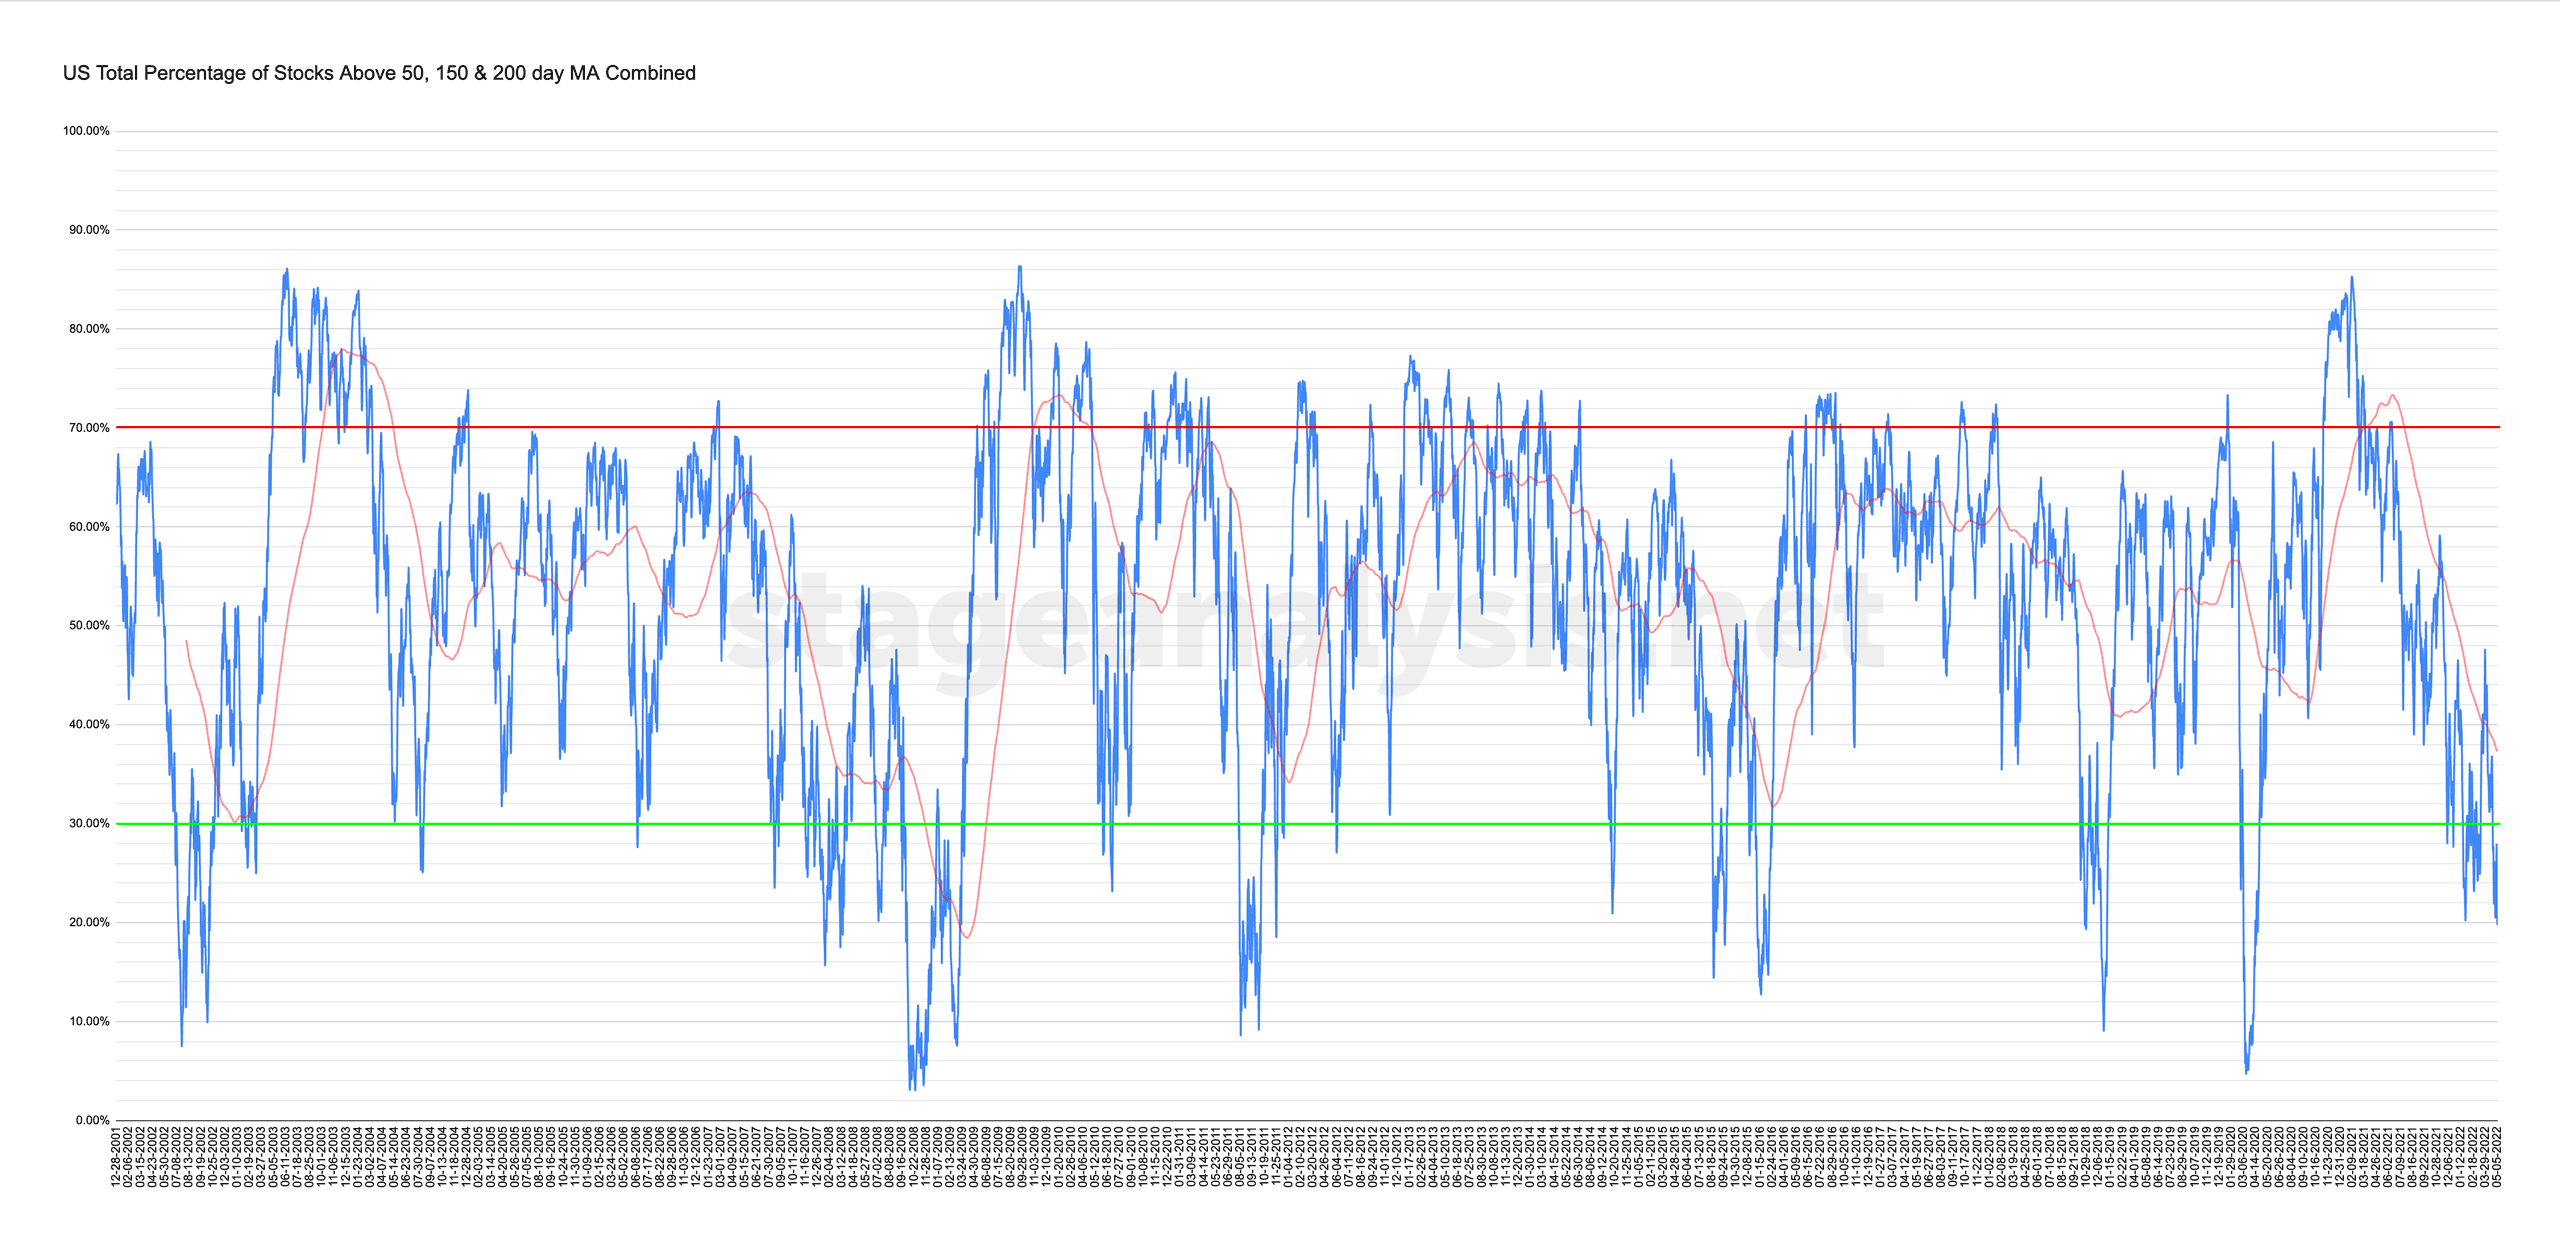
The US Total Percentage of Stocks Above their 50 Day, 150 Day & 200 Day Moving Averages Combined chart declined a further -1.27% over the last week to end the week at a new low of 19.74%. So less than 1/5th of stocks in the US market are now above their short, medium and long term moving averages, and hence 80% are below them. Which are extreme levels, that have been reached in the last 20 years during the worst of the Stage 4 bear markets. So it puts into context where we are in the current cycle, even if the large cap index charts aren't showing the depth of the damage that we are seeing in individual stocks.
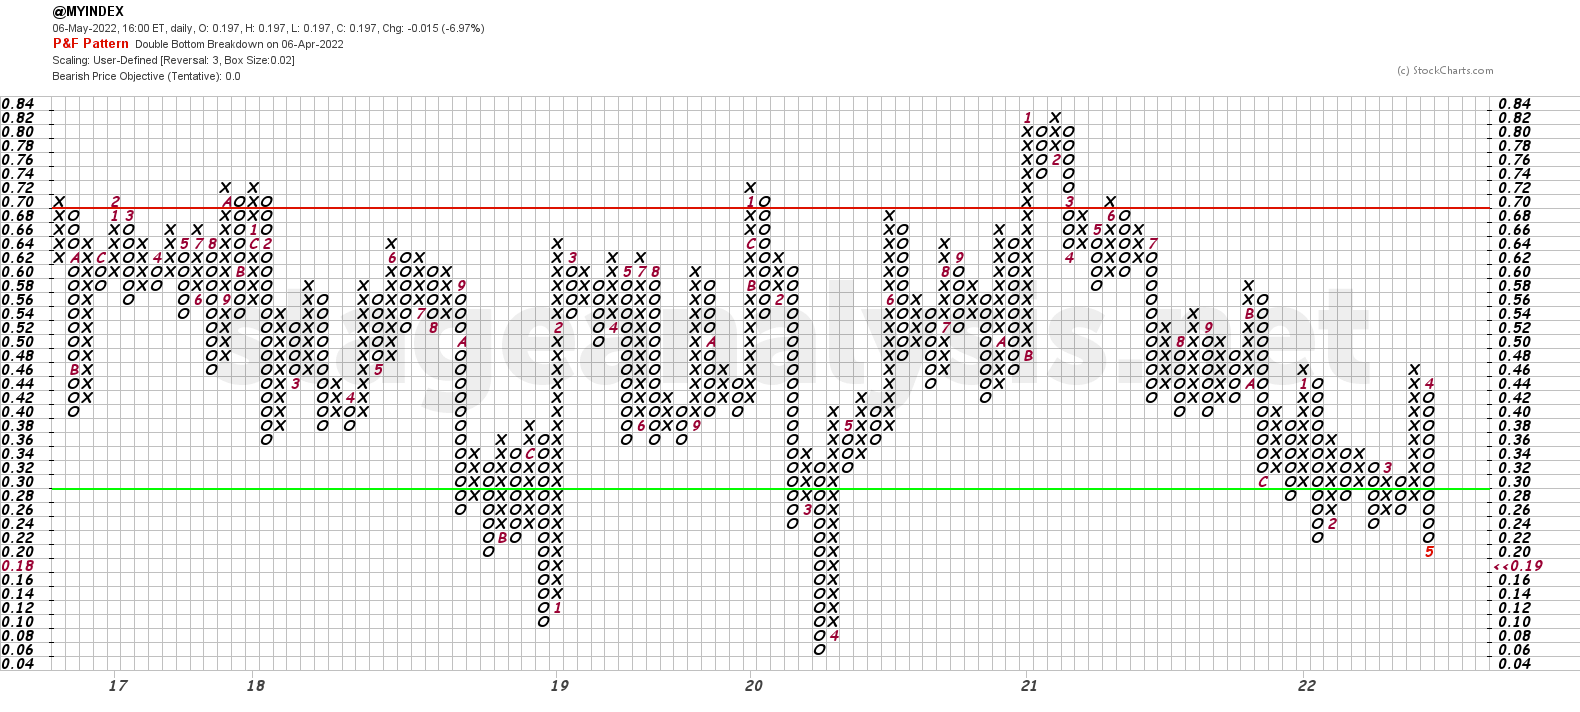
The Point and Figure chart (see below), added a further O to its current column. So its P&F status remains on Bear Confirmed and on Defense (in a column of Os) and Very Difficult Environment Status in the lower zone. Hence, the risk remains extremely elevated, with an increased risk of a Stage 4 capitulation type move (climactic action) in the market. So extreme caution until we start to see some short term breadth improvements.
I'll discuss this in more detail in the members weekend video (due out later on Sunday afternoon EST)
Long Term Chart: US Total % Stocks Above their 50 Day, 150 Day & 200 Day Moving Averages Combined
Become a Stage Analysis Member:
To see more like this – US Stocks watchlist posts, detailed videos each weekend, use our unique Stage Analysis tools, such as the US Stocks & ETFs Screener, Charts, Market Breadth, Group Relative Strength and more...
Join Today
Disclaimer: For educational purpose only. Not investment advice. Seek professional advice from a financial advisor before making any investing decisions.