
Stocks Breakouts – Breakdowns Remains on a Risk Off Signal
Attached is my updated custom breadth charts that I do based on the daily point and figure double top breakouts and double bottom breakdowns.
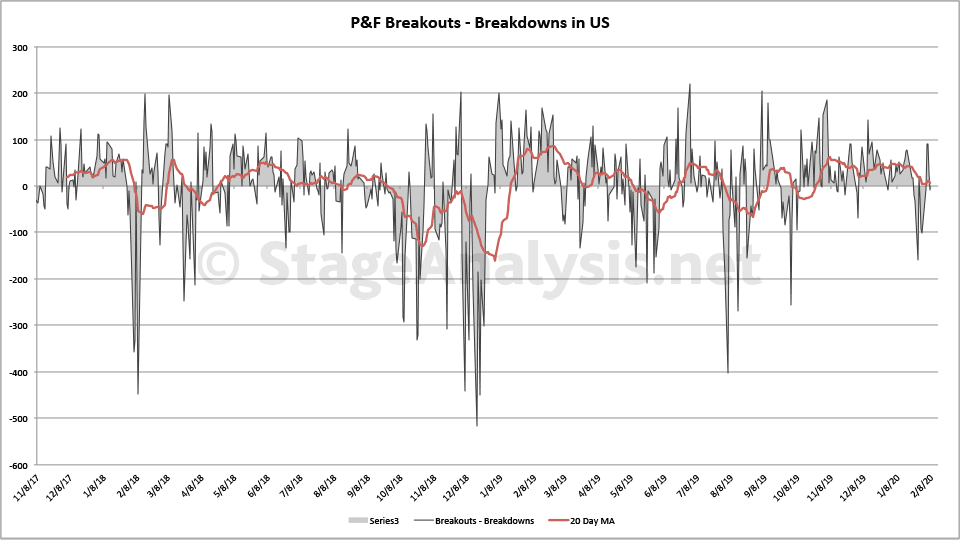
Totals for the week:
+419 double top stock breakouts
-223 double bottom stock breakdowns
+196 net stock breakouts - stock breakdowns
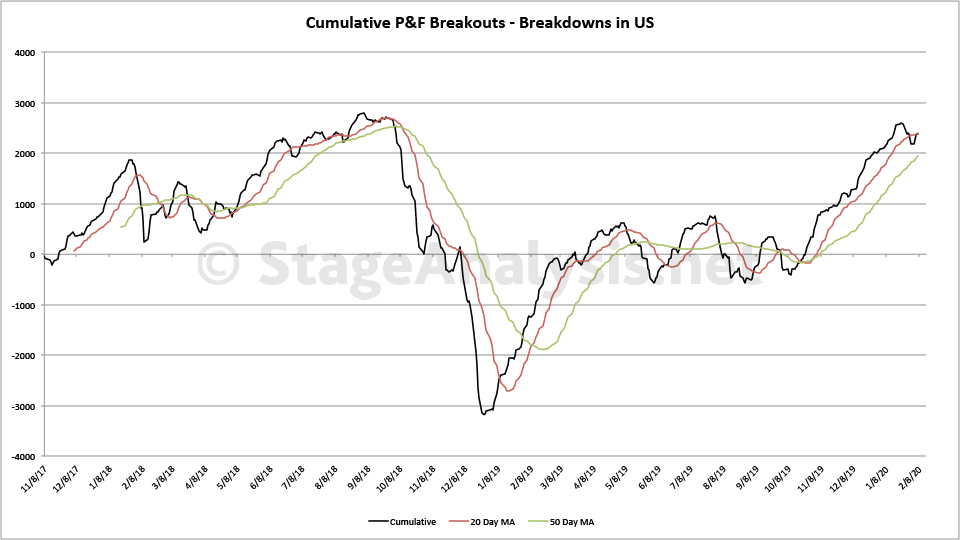
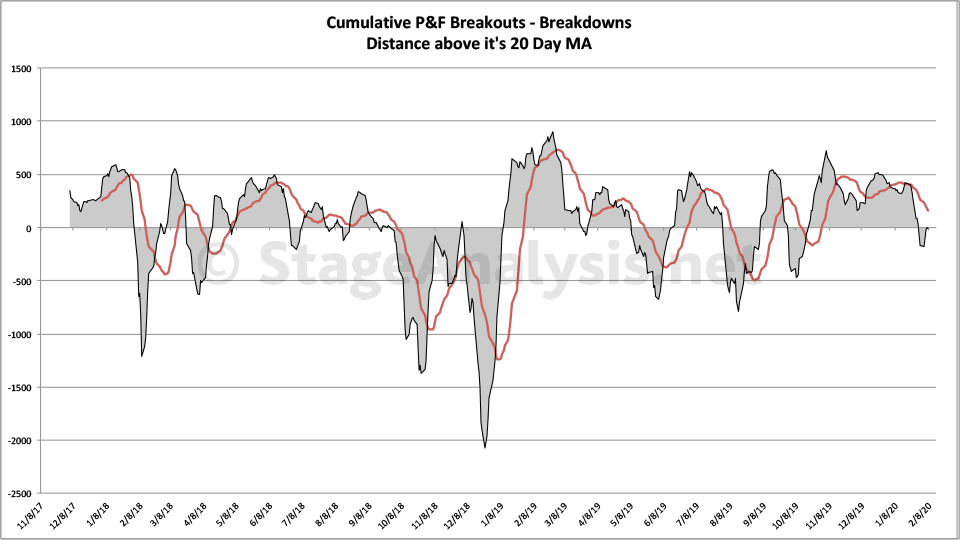
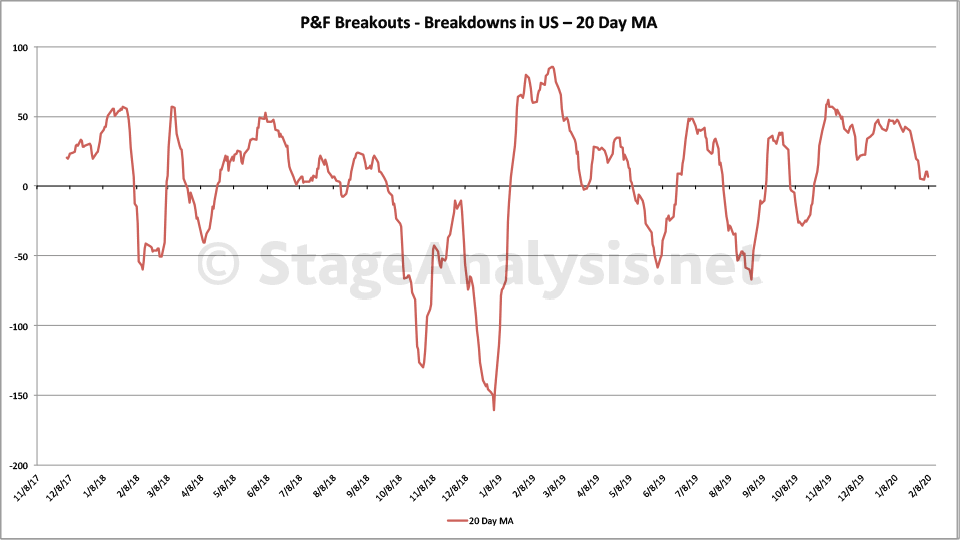
Note: Although there was net gain of 196 stock breakouts - stock breakdowns this week, the cumulative line chart failed to get back and hold above the 20 day moving average, and so remains on a risk off signal for another week. The distance below the 20 day moving average chart also remains on a negative signal with it below zero and a declining moving average of its own.
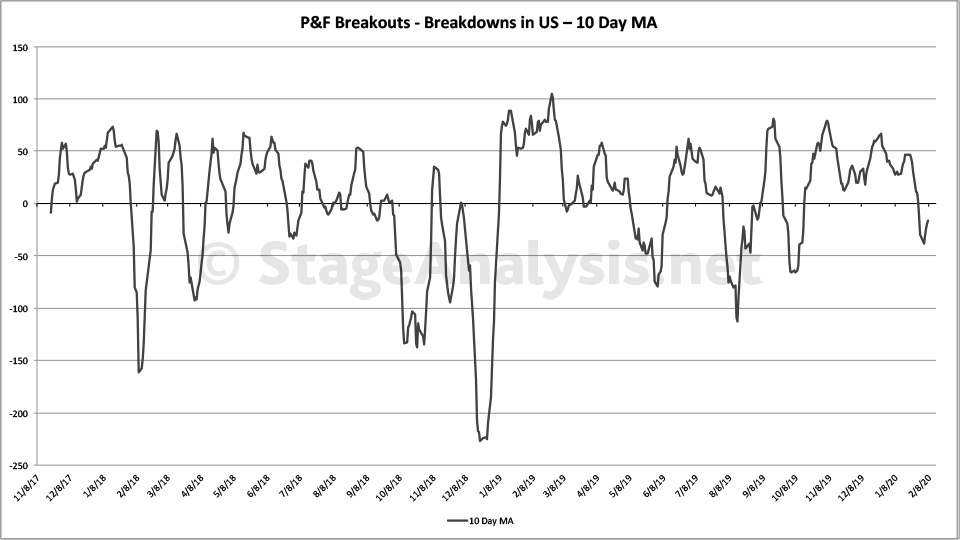
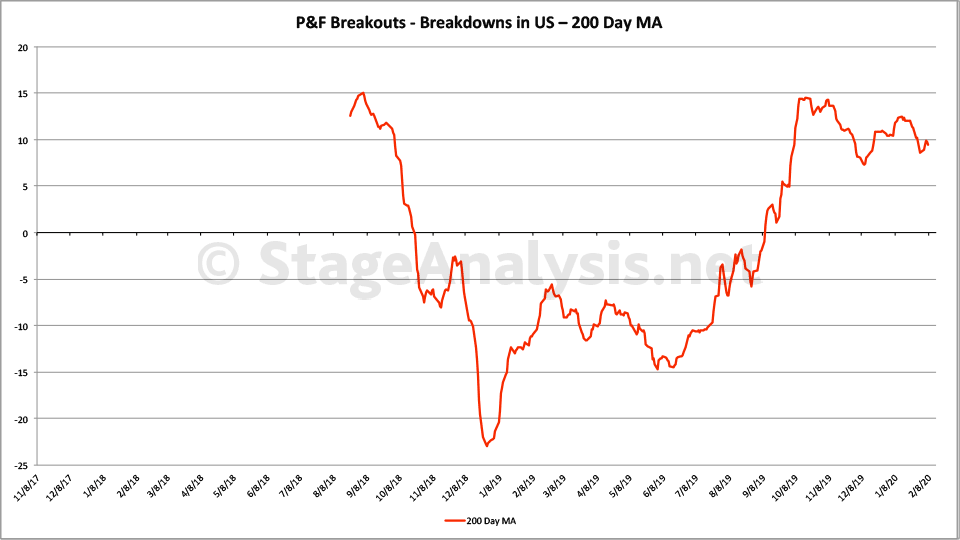
The short term 10 day moving average momentum chart also showed little bounce this week while the stock market indexes like the S&P 500, Nasdaq and NYSE all moved higher, and also failed to recover its zero line, while the longer term 200 day moving average chart is now showing a divergence and is near to a potential breakdown level.
So there are numerous warnings signs in these particular stock market breadth indicators charts.
Below are the charts:
Disclaimer: For educational purpose only. Not investment advice. Seek professional advice from a financial advisor before making any investing decisions.