
Market Breadth: Percentage of Stocks Above their 50 Day, 150 Day & 200 Day Moving Averages Combined
The full post is available to view by members only. For immediate access:
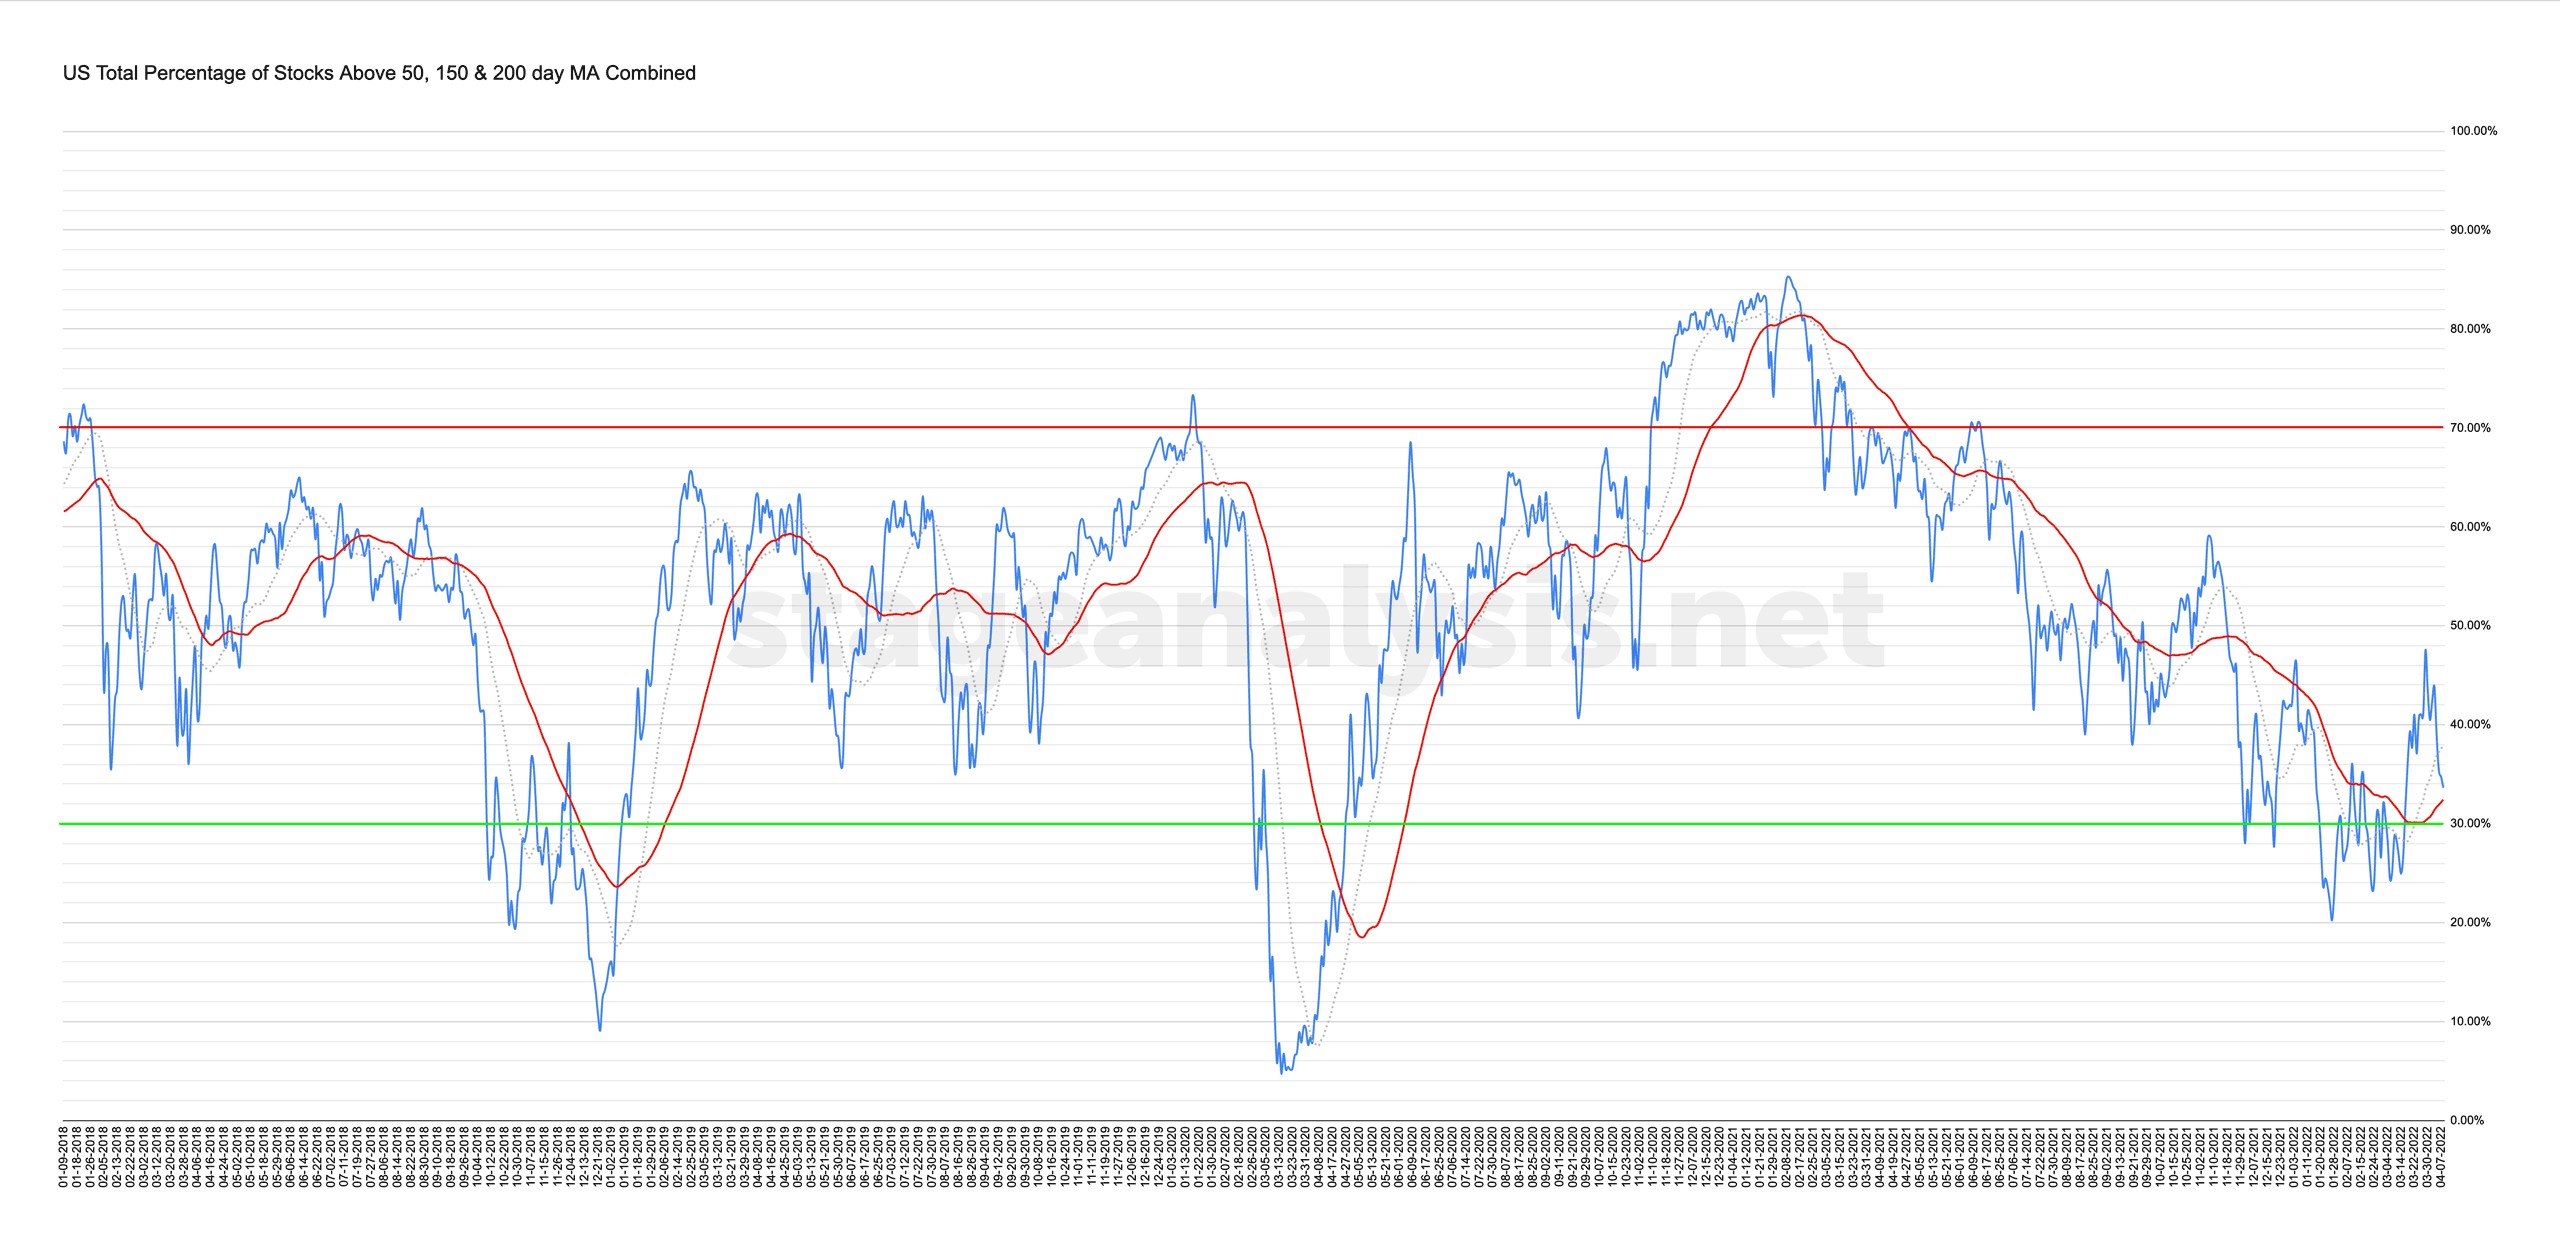
33.64% (-8.73% 1wk)
Status: Neutral Environment
The US Total Percentage of Stocks Above their 50 Day, 150 Day & 200 Day Moving Averages Combined chart moved back to a Neutral status this week as it reversed strongly back below its own 20 day MA and the P&F chart reversed to a column of Os – which puts it on Defensive Posture. However, it remains above its 50 day MA, which I use for the major signal line for the market environment status, and so hence the Neutral rating.
I will go through this breadth data, the current strategy its position suggests and the rest of the market breadth charts in detail in the Stage Analysis Members Weekend Video on Sunday.
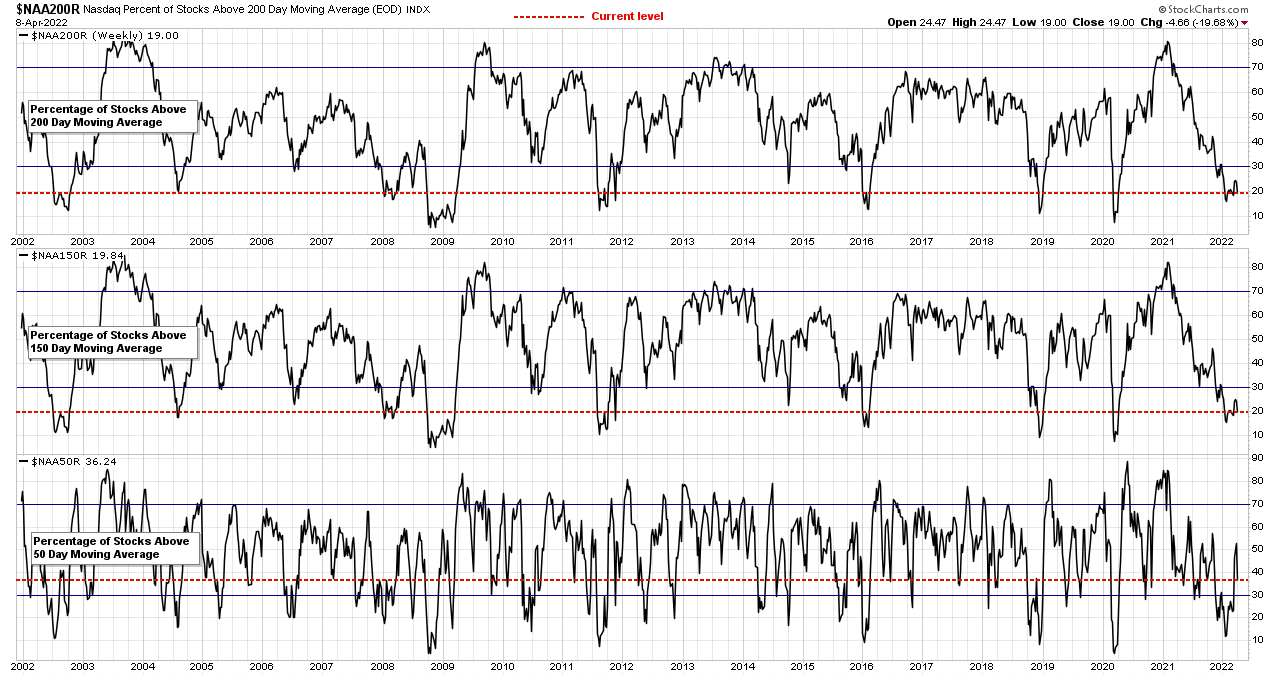
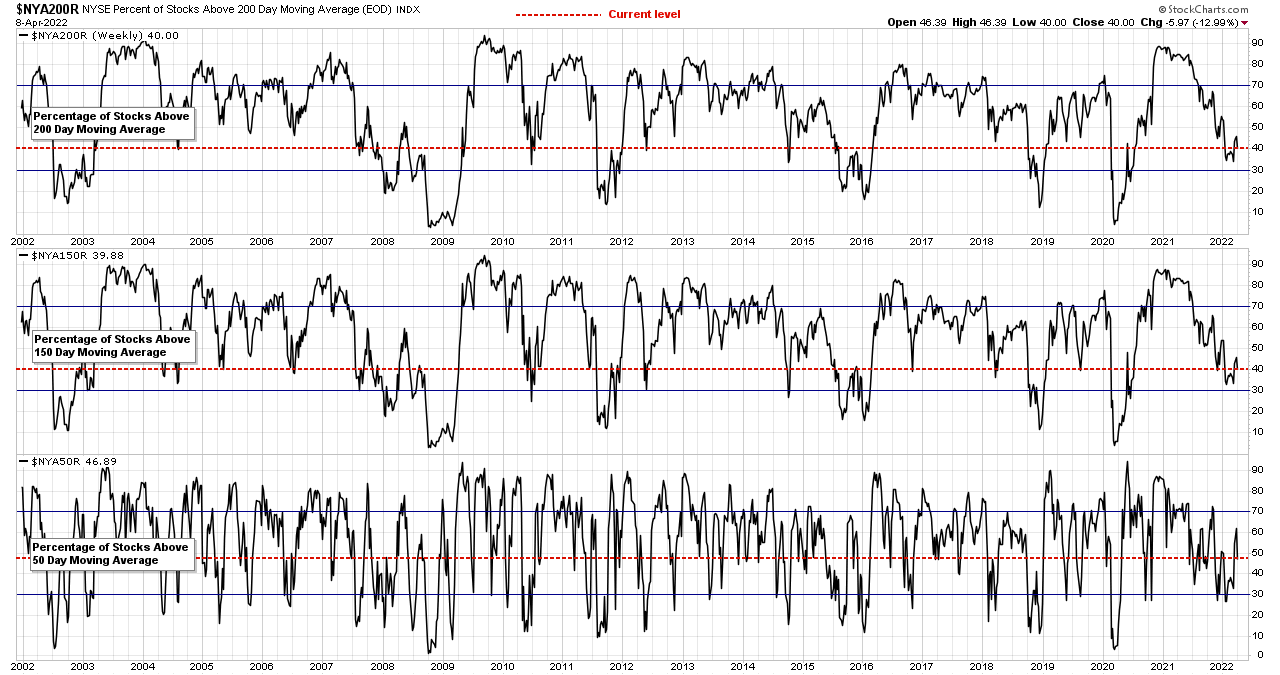
20 Year Chart of the Nasdaq Composite and the NYSE Percentage of Stocks Above their 50 Day, 150 Day & 200 Day Moving Averages
Below is the 20 year charts of the Nasdaq and NYSE which makes up the data for the combined chart. Note the Nasdaq medium and long term data remains in the lower zone (below 30%) – which it's been below since the start of the year.
Nasdaq Composite Stocks
NYSE Stocks
Disclaimer: For educational purpose only. Not investment advice. Seek professional advice from a financial advisor before making any investing decisions.