
Percentage of Stocks Above their 50 Day, 150 Day & 200 Day Moving Averages Combined – Positive Environment
The full post is available to view by members only. For immediate access:
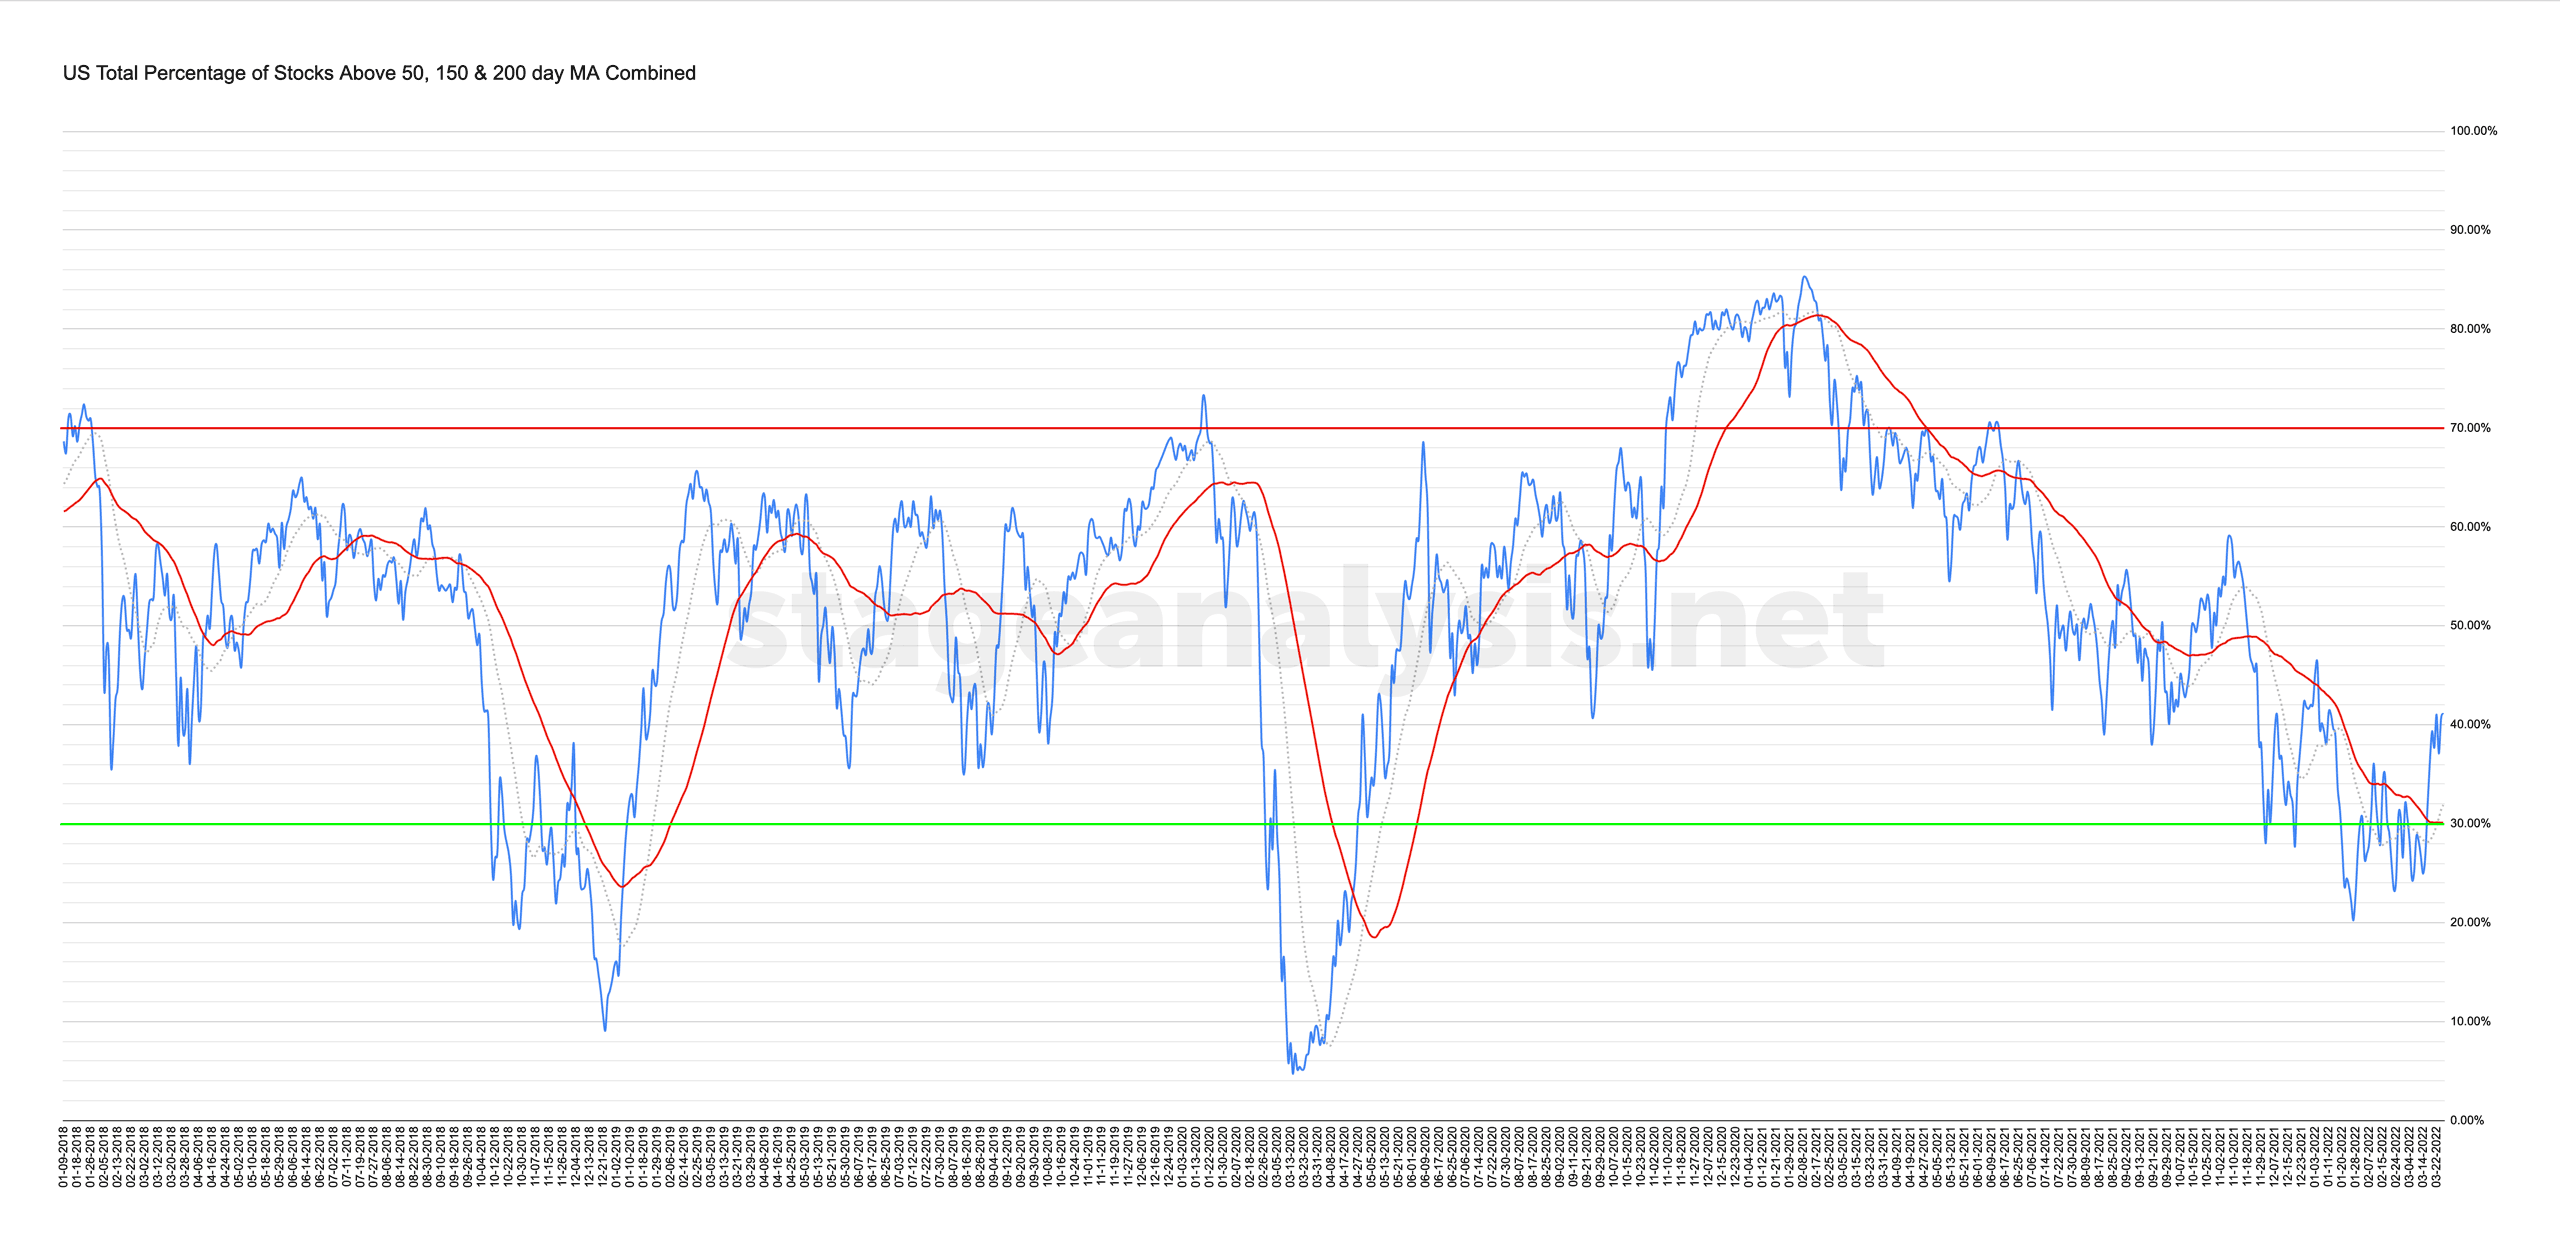
41.06% (1.72% 1wk)
Status: Positive Environment
The US Total Percentage of Stocks Above their 50 Day, 150 Day & 200 Day Moving Averages Combined chart made a small gain week on week with only a minor pullback of a few percent during the week. So it held last weeks breakout move above its own 50 day MA – which I use for the signal line for this breadth measure, and so is the longest period its remained above its 50 day MA year to date, and so last weeks neutral / positive environment status changes to postive environment status, and so is another improvement to add to the overall Weight of Evidence.
Disclaimer: For educational purpose only. Not investment advice. Seek professional advice from a financial advisor before making any investing decisions.