
Percentage of Crypto Currencies above their Moving Averages breadth charts
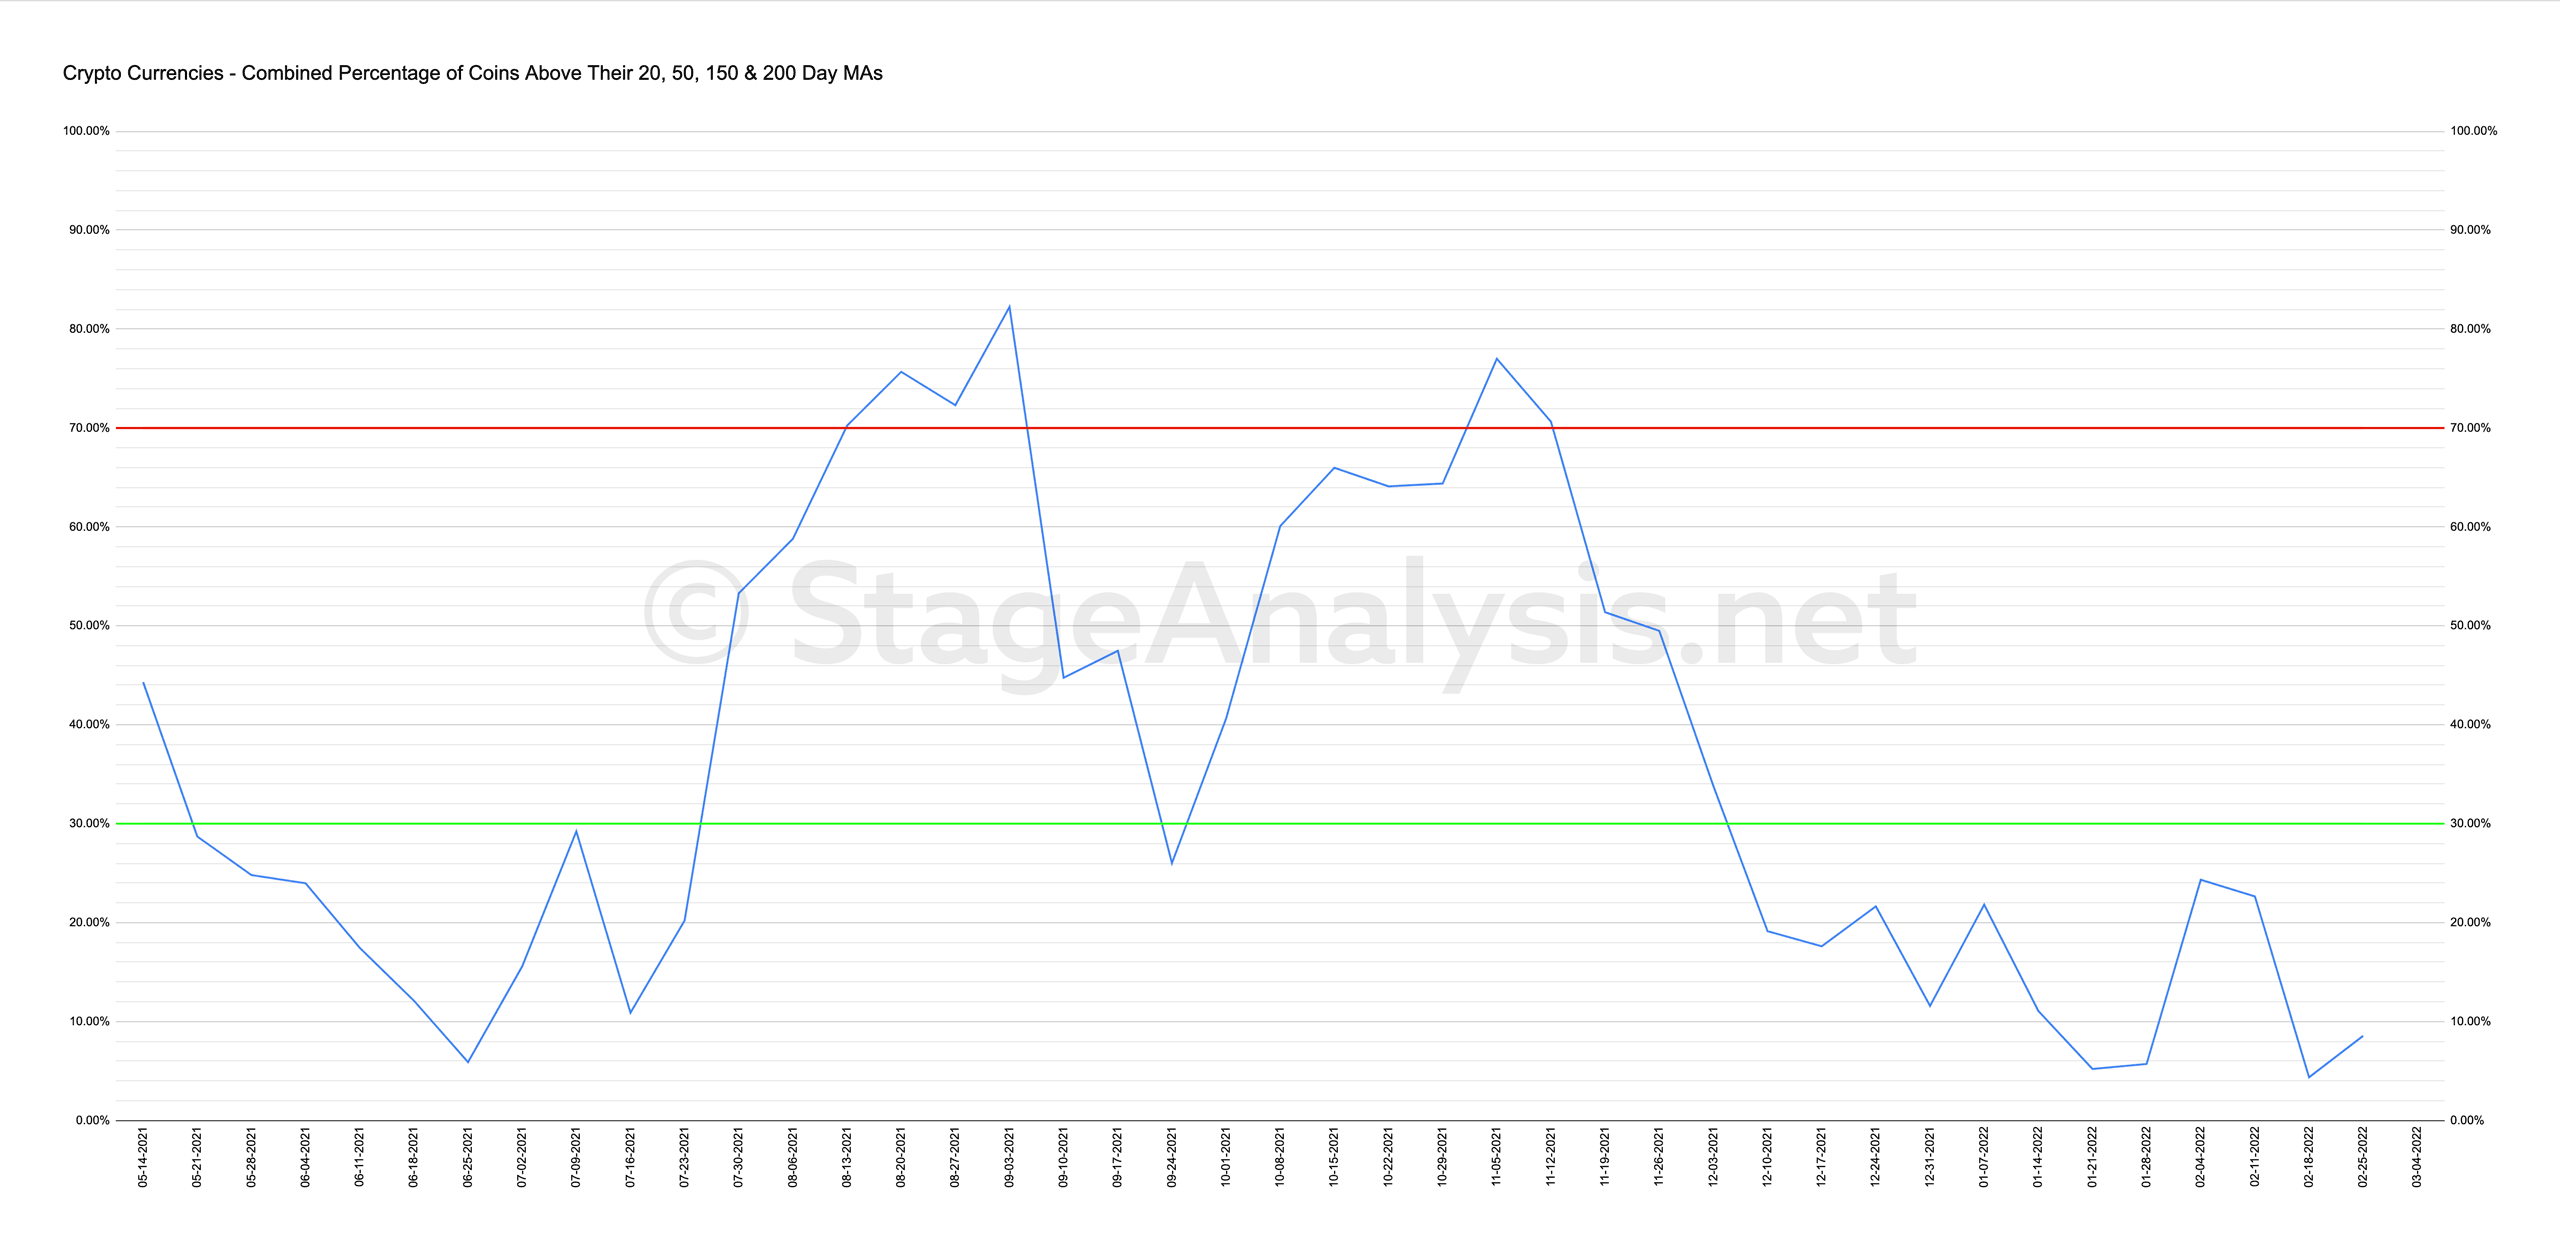
% Above 20 day MA: 10.07% (+4.70%)
% Above 50 day MA: 12.08% (+8.05%)
% Above 150 day MA: 4.70% (+2.01%)
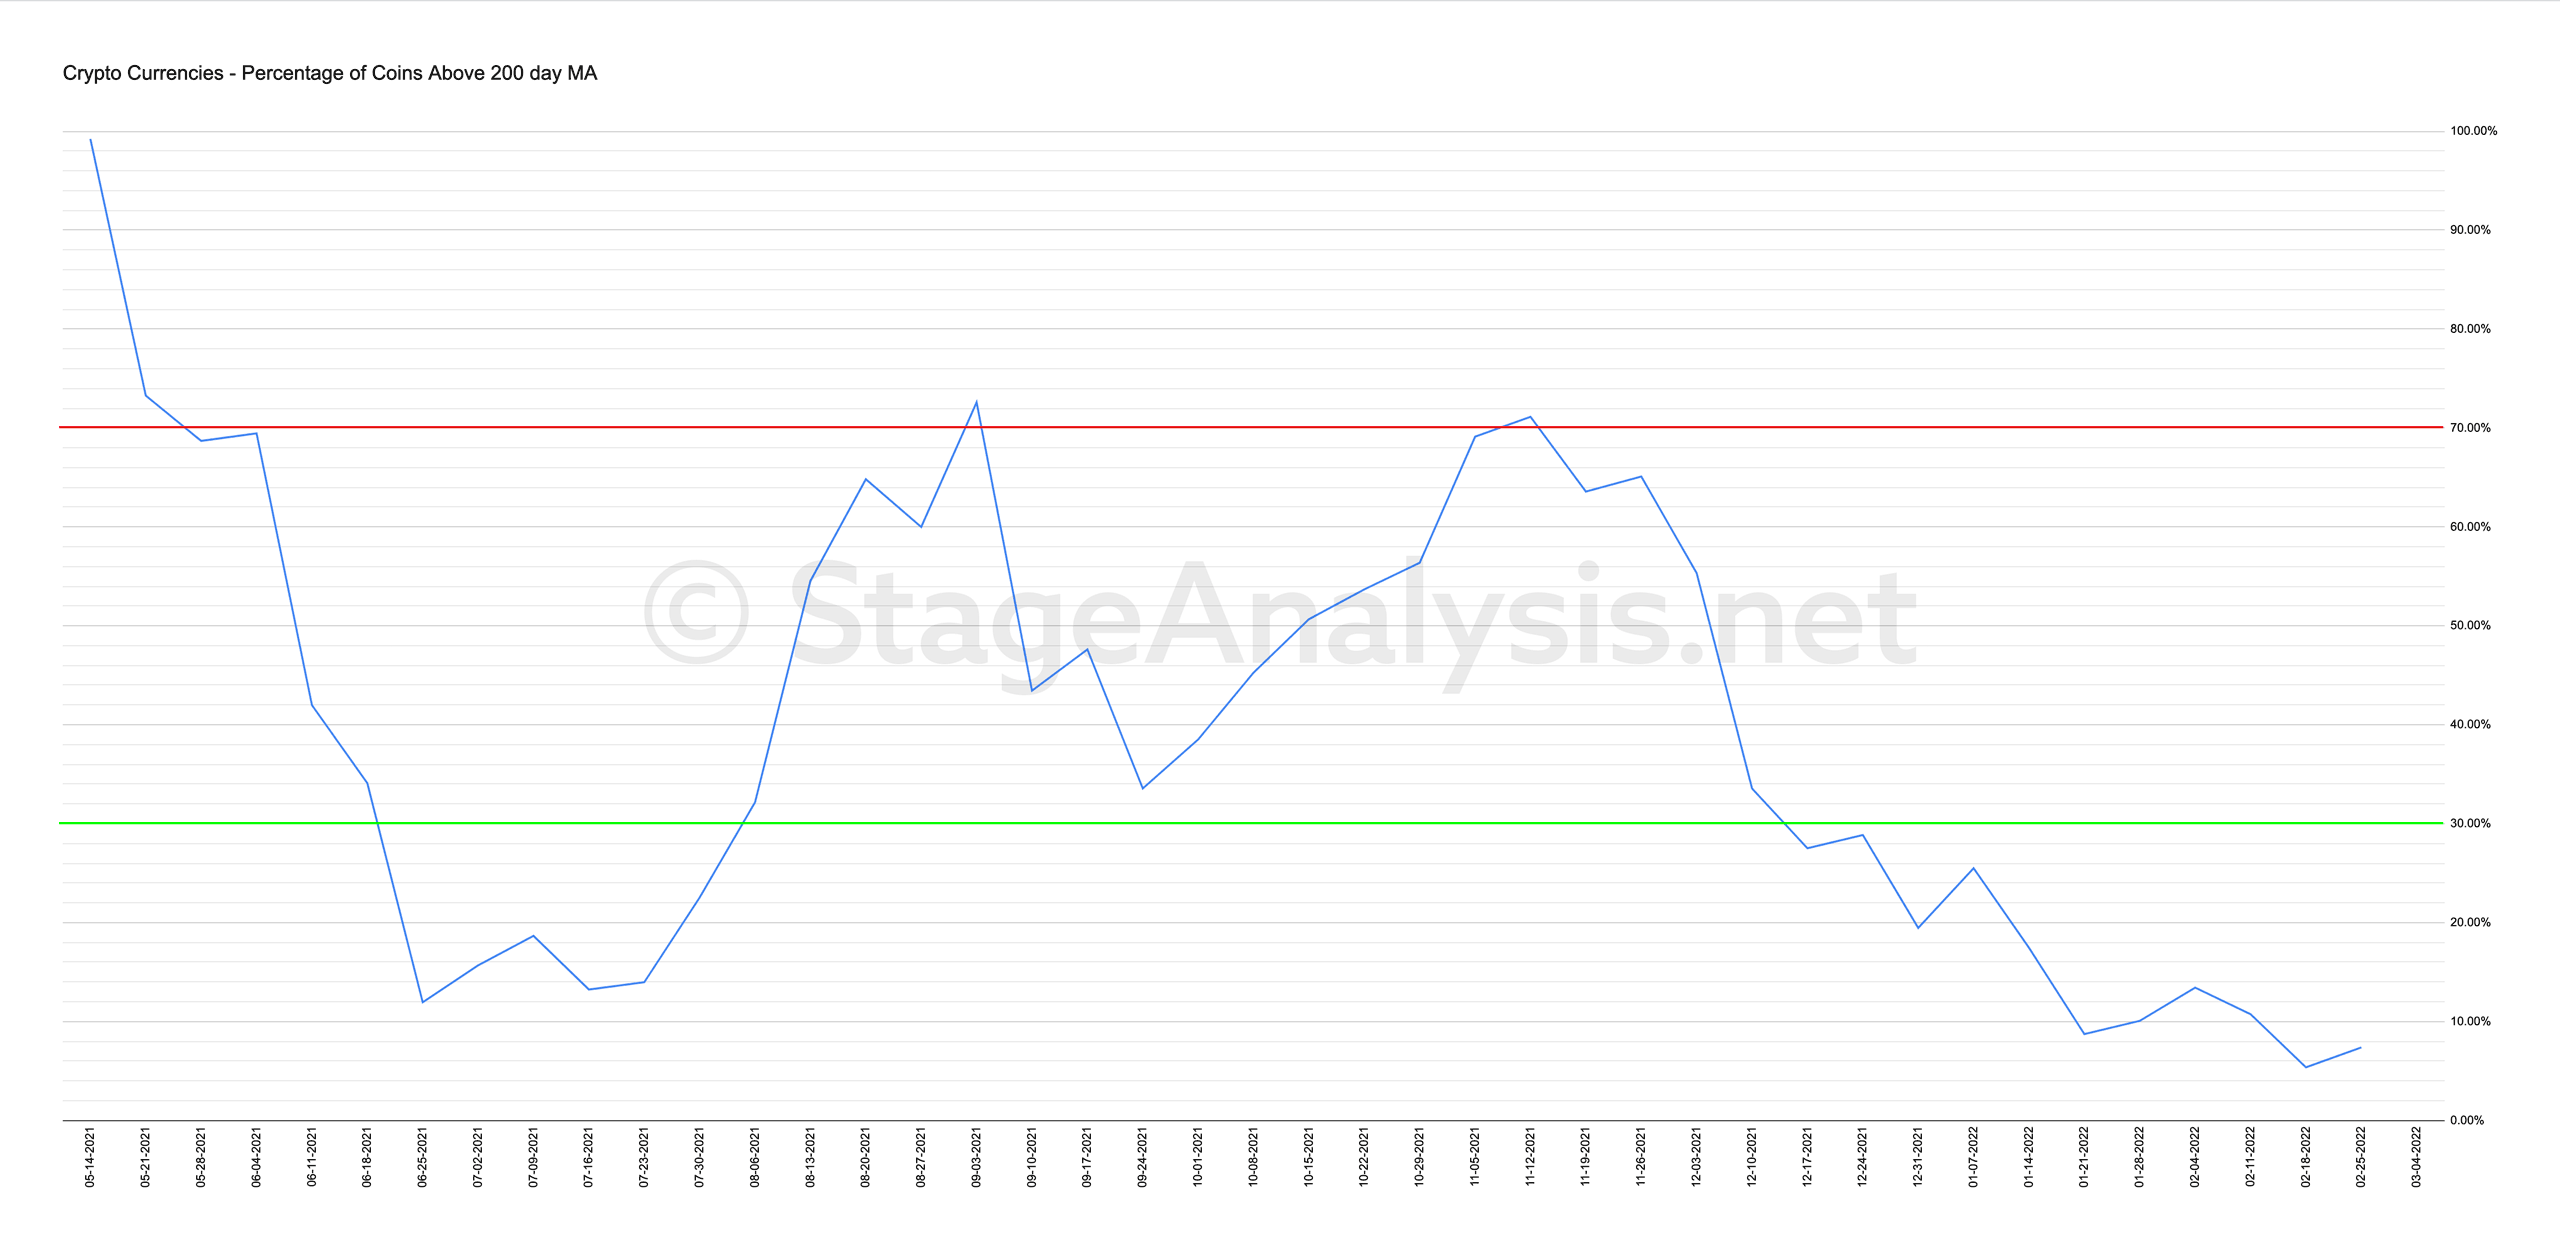
% Above 200 day MA: 7.38% (+2.01%)
Average: 8.56% (+4.19% 1wk)
The overall average remains at extremely low levels, closing the week at 8.56%.
In order to move to crypto breadth buy signal, the overall average needs to move out of the lower zone and close above the key 30% level.
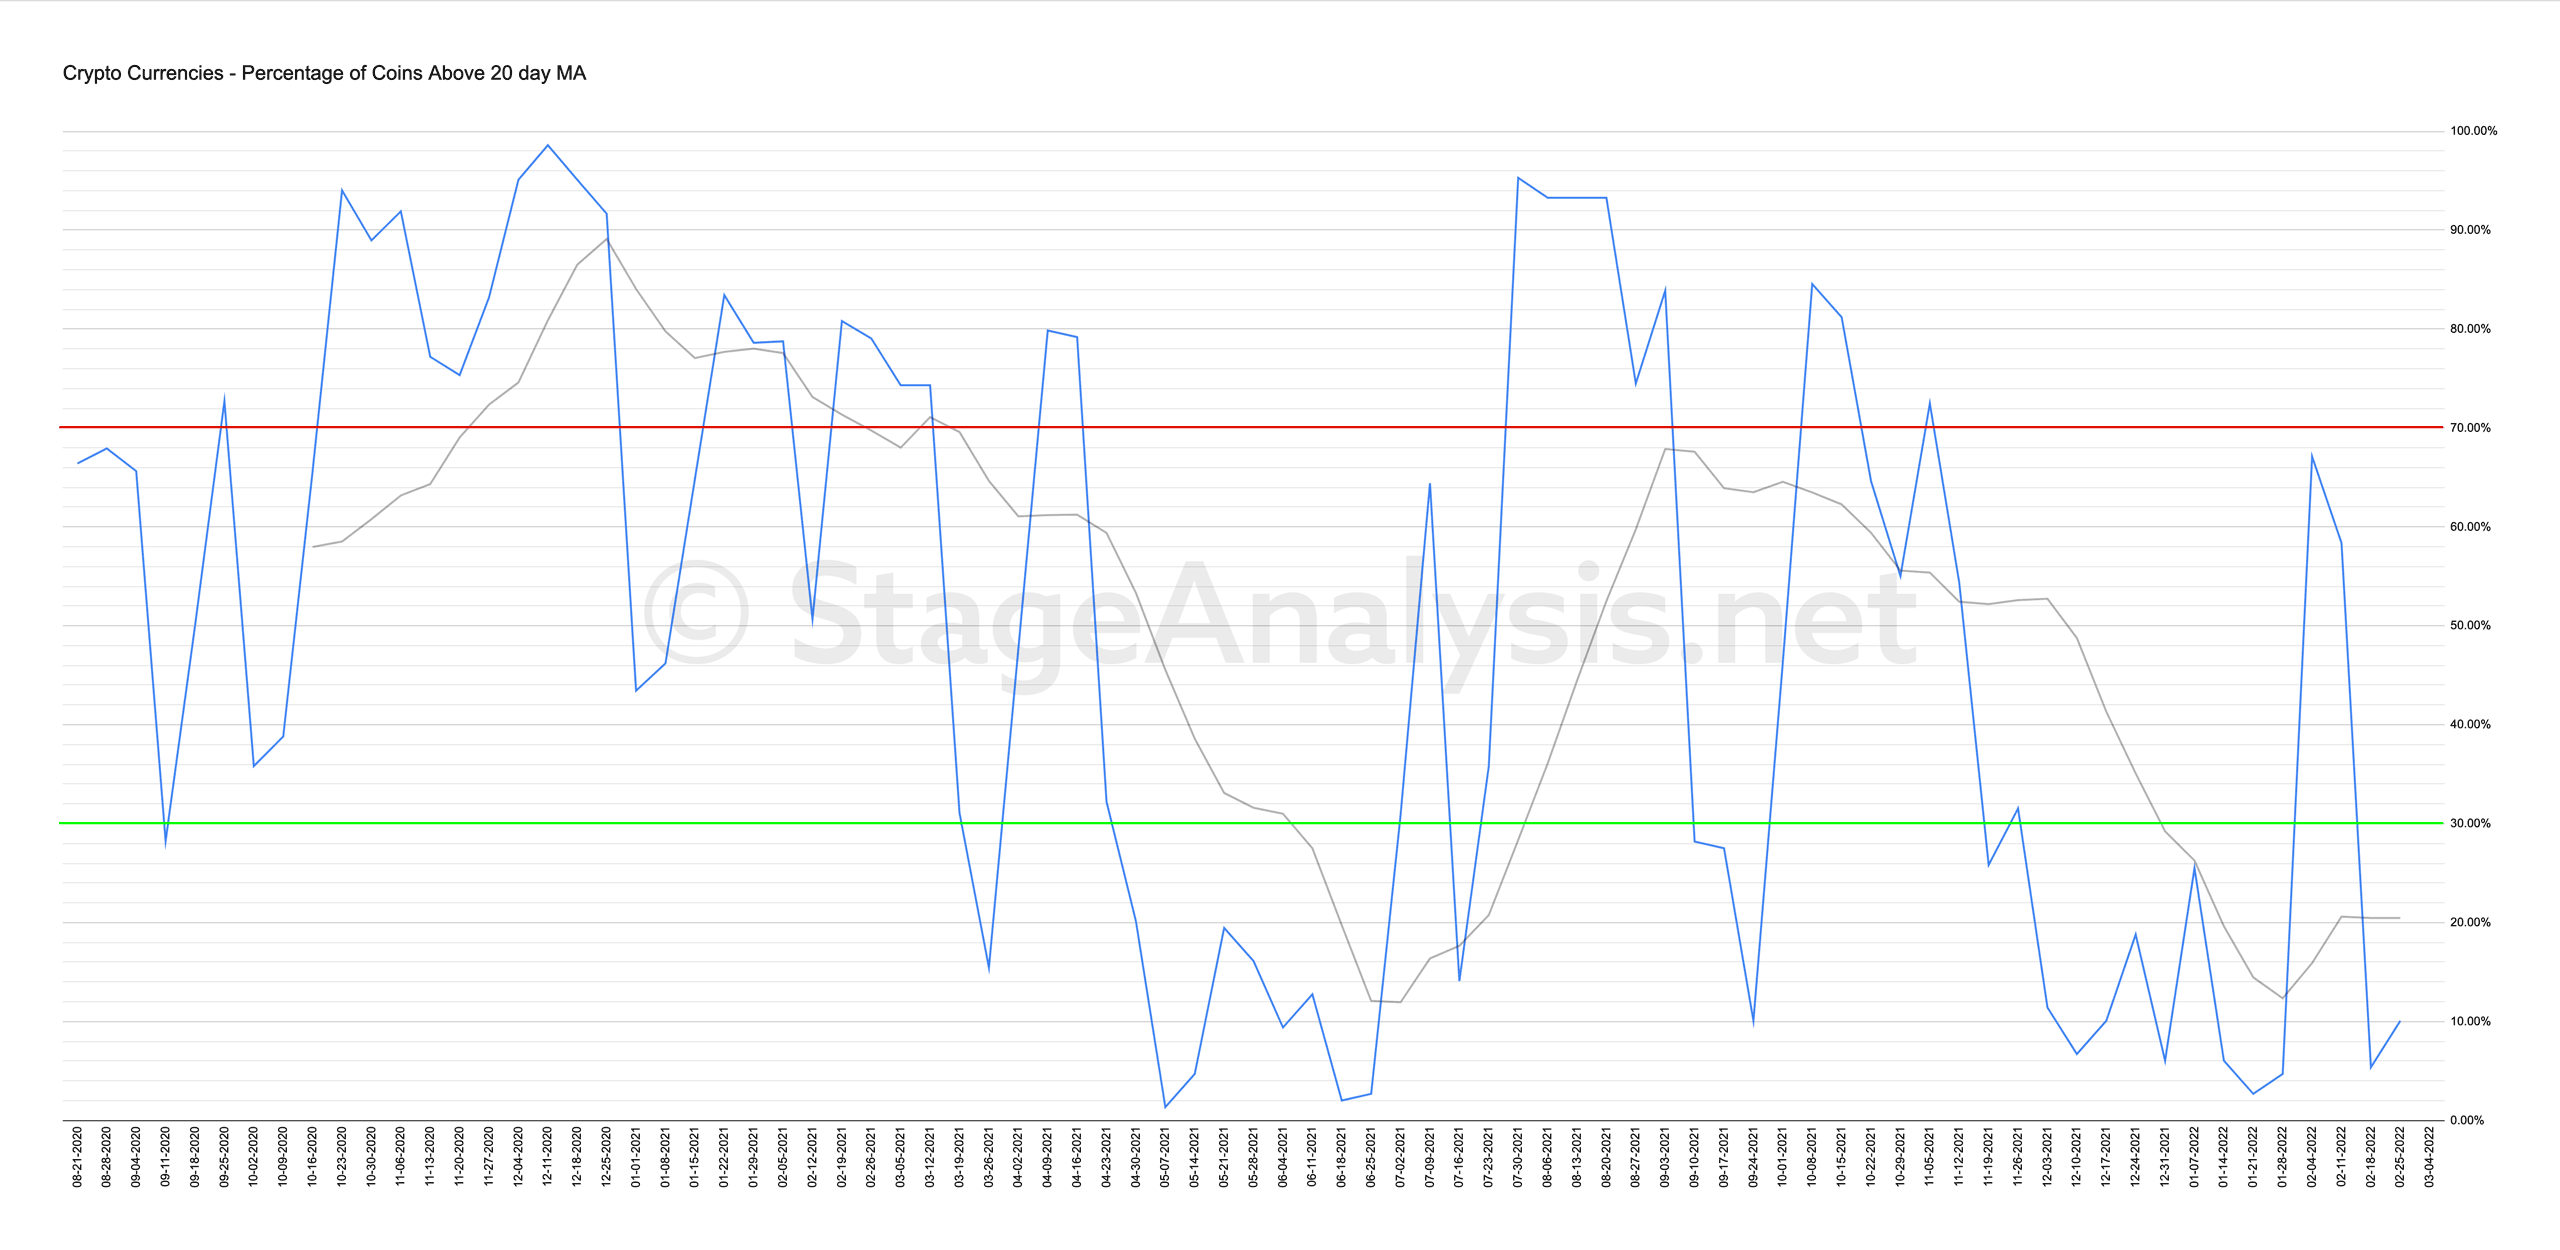
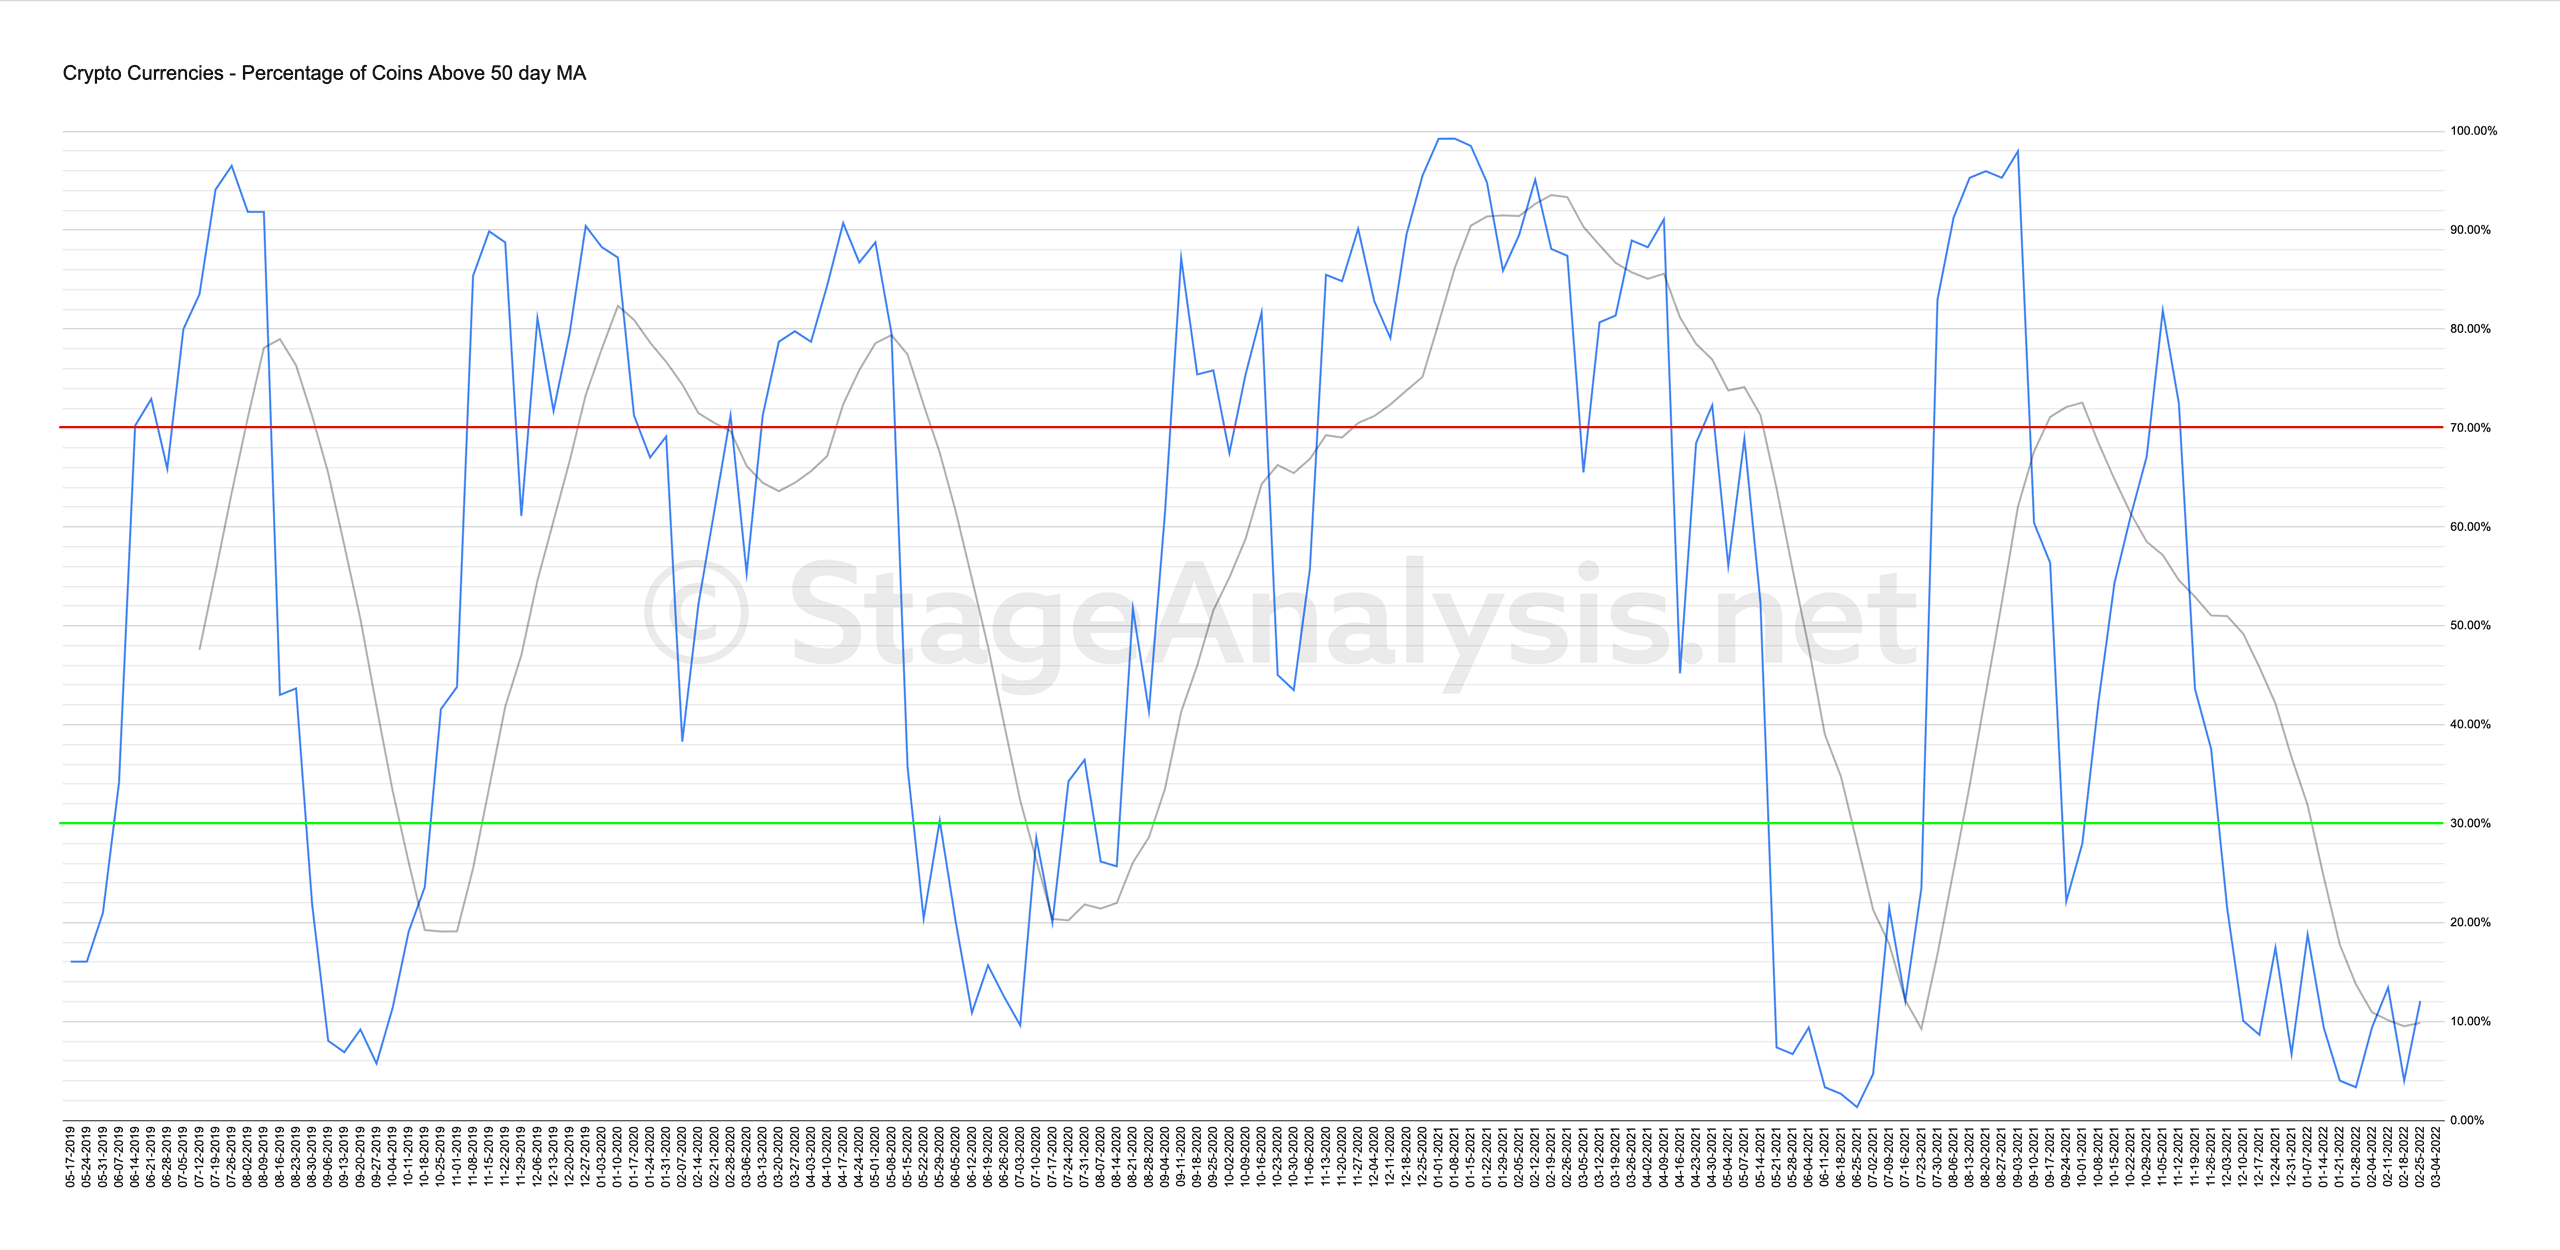
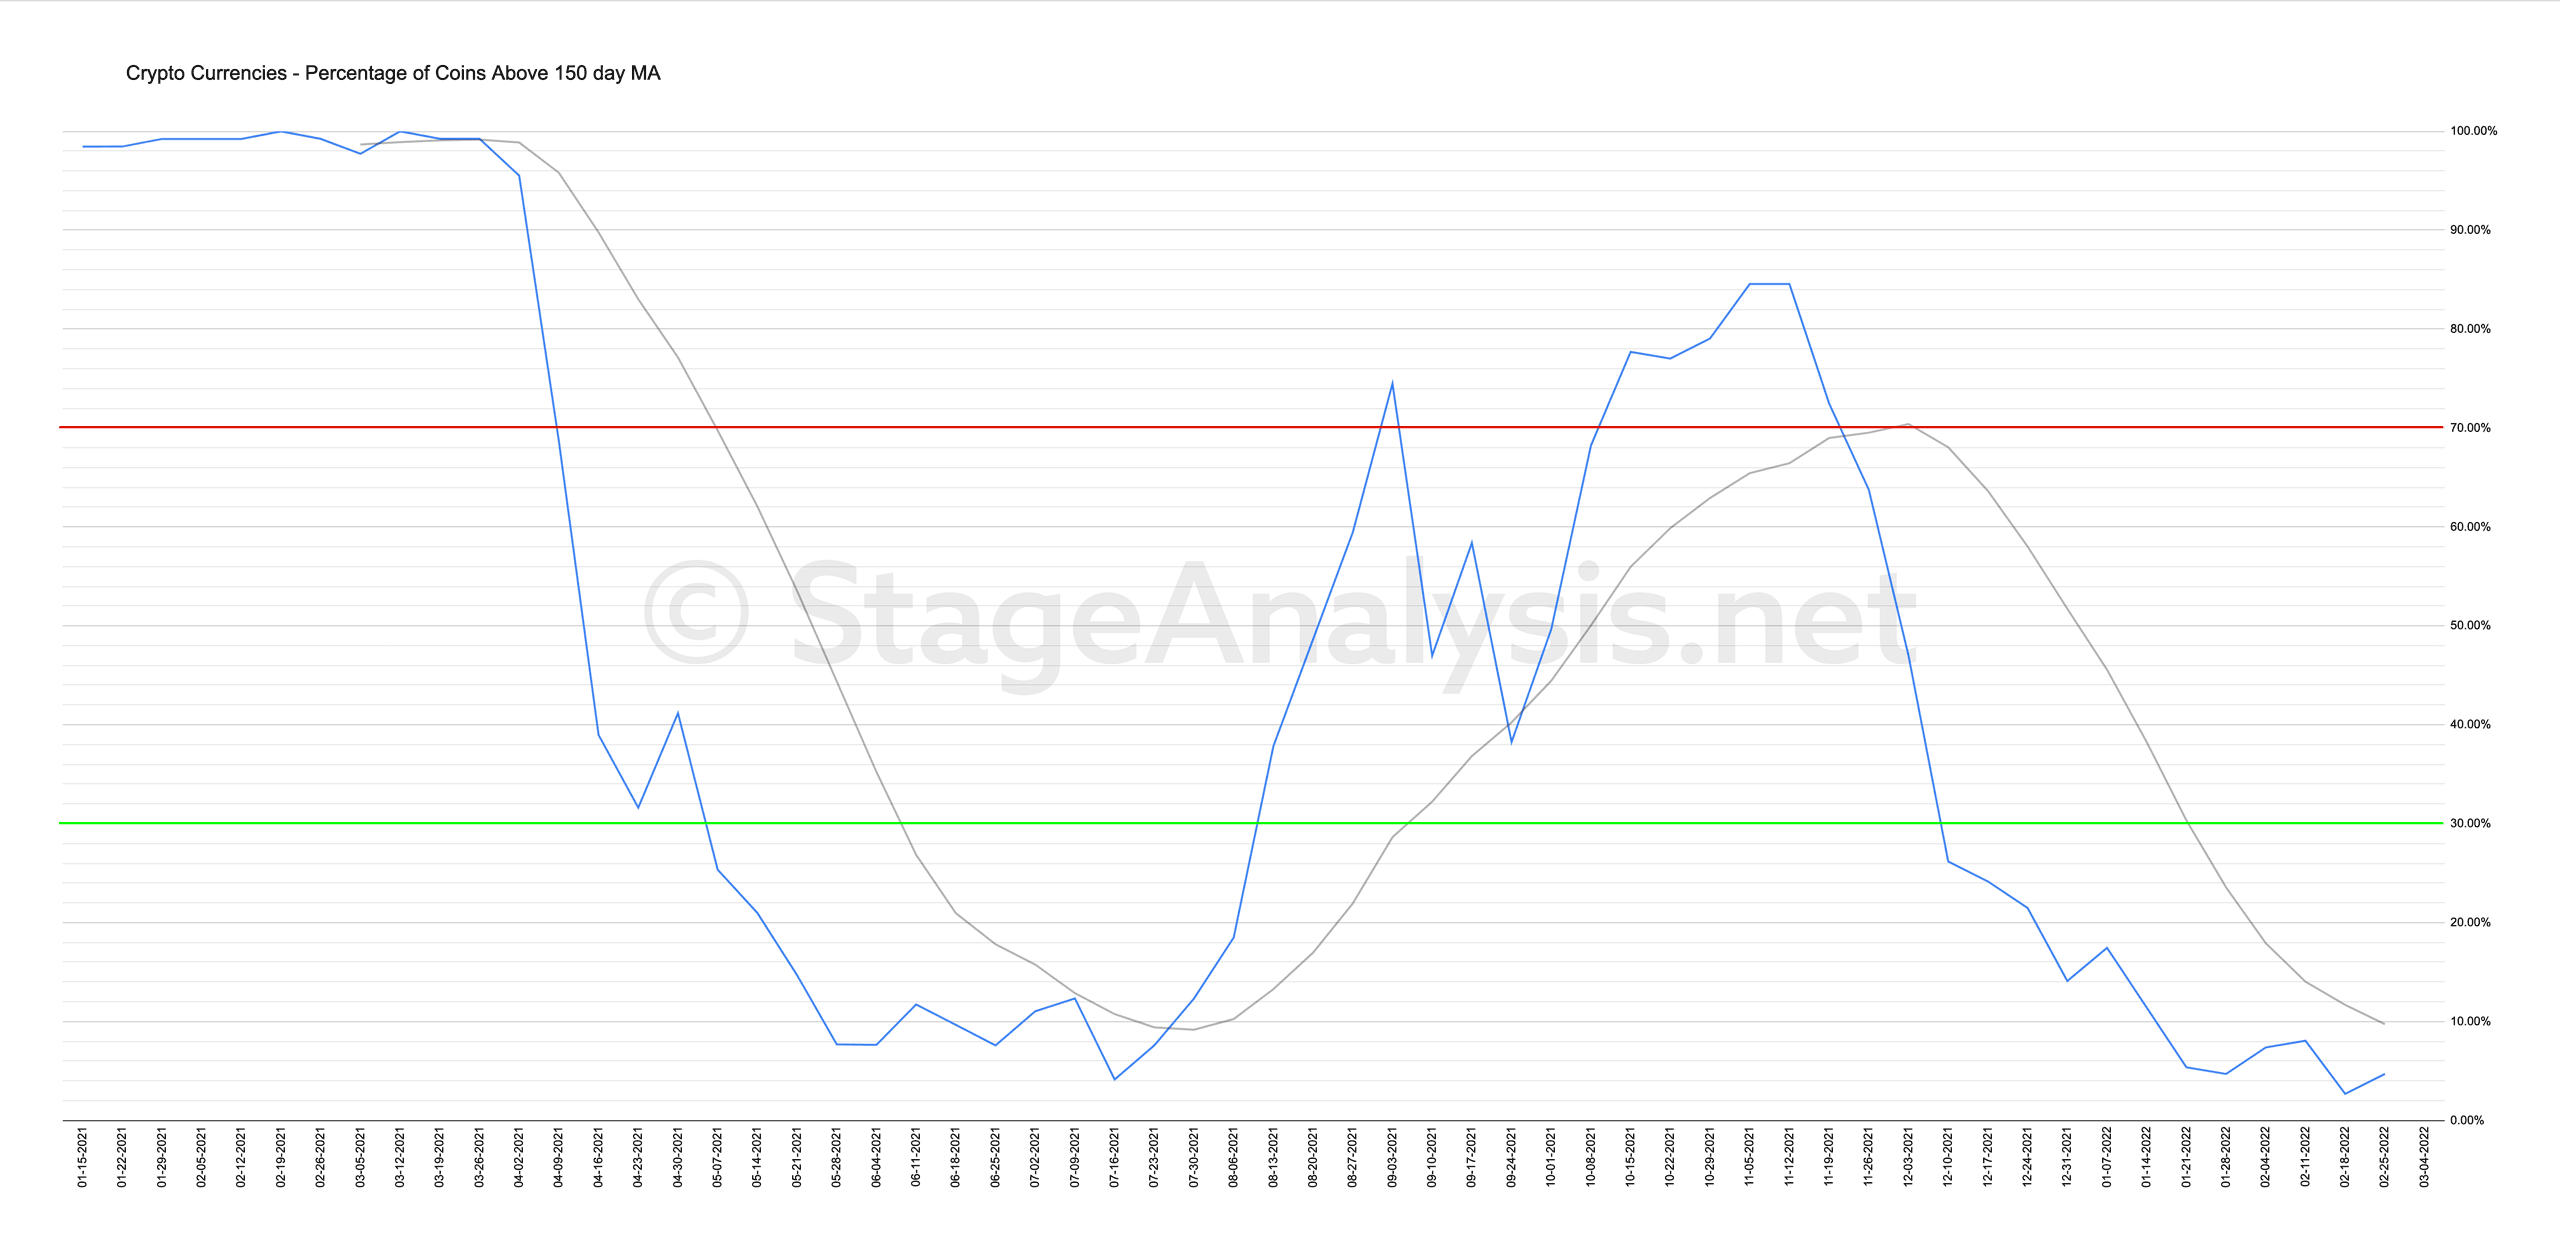
Here's the individual charts
Become a Stage Analysis Member:
To see more like this – US Stocks watchlist posts, detailed videos each weekend, use our unique Stage Analysis tools, such as the US Stocks & ETFs Screener, Charts, Market Breadth, Group Relative Strength and more...
Join Today
Disclaimer: For educational purpose only. Not investment advice. Seek professional advice from a financial advisor before making any investing decisions.