
US Stocks Industry Groups Relative Strength Rankings
The full post is available to view by members only. For immediate access:
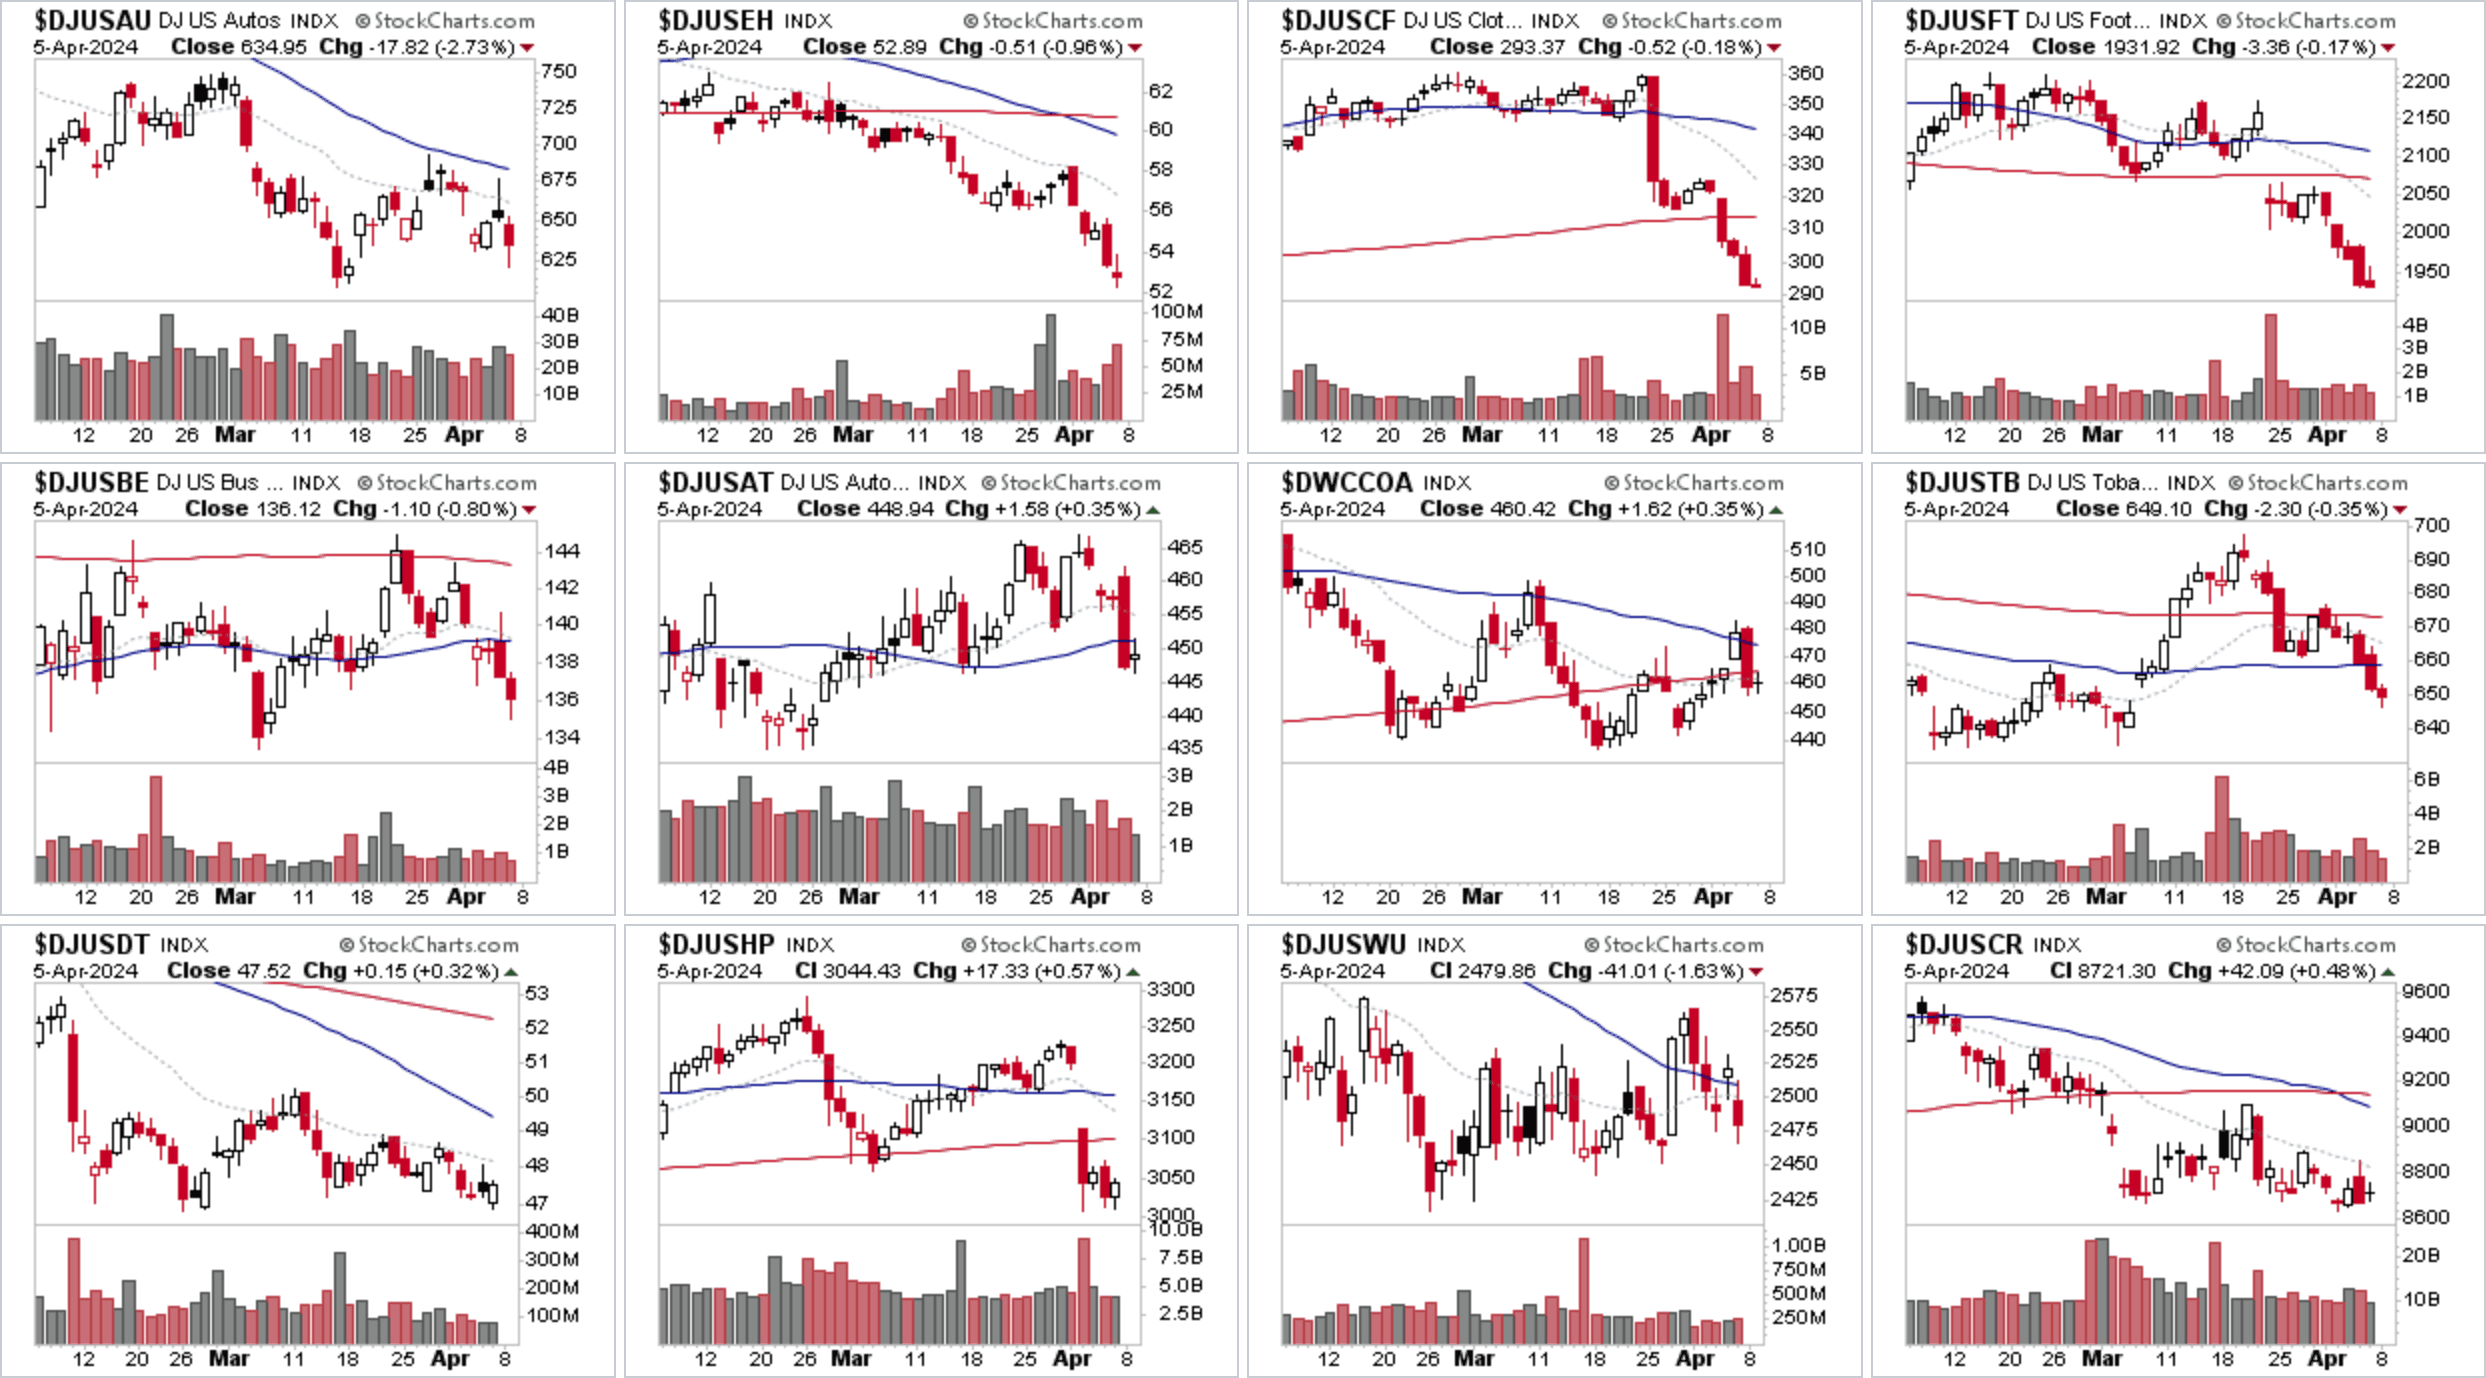
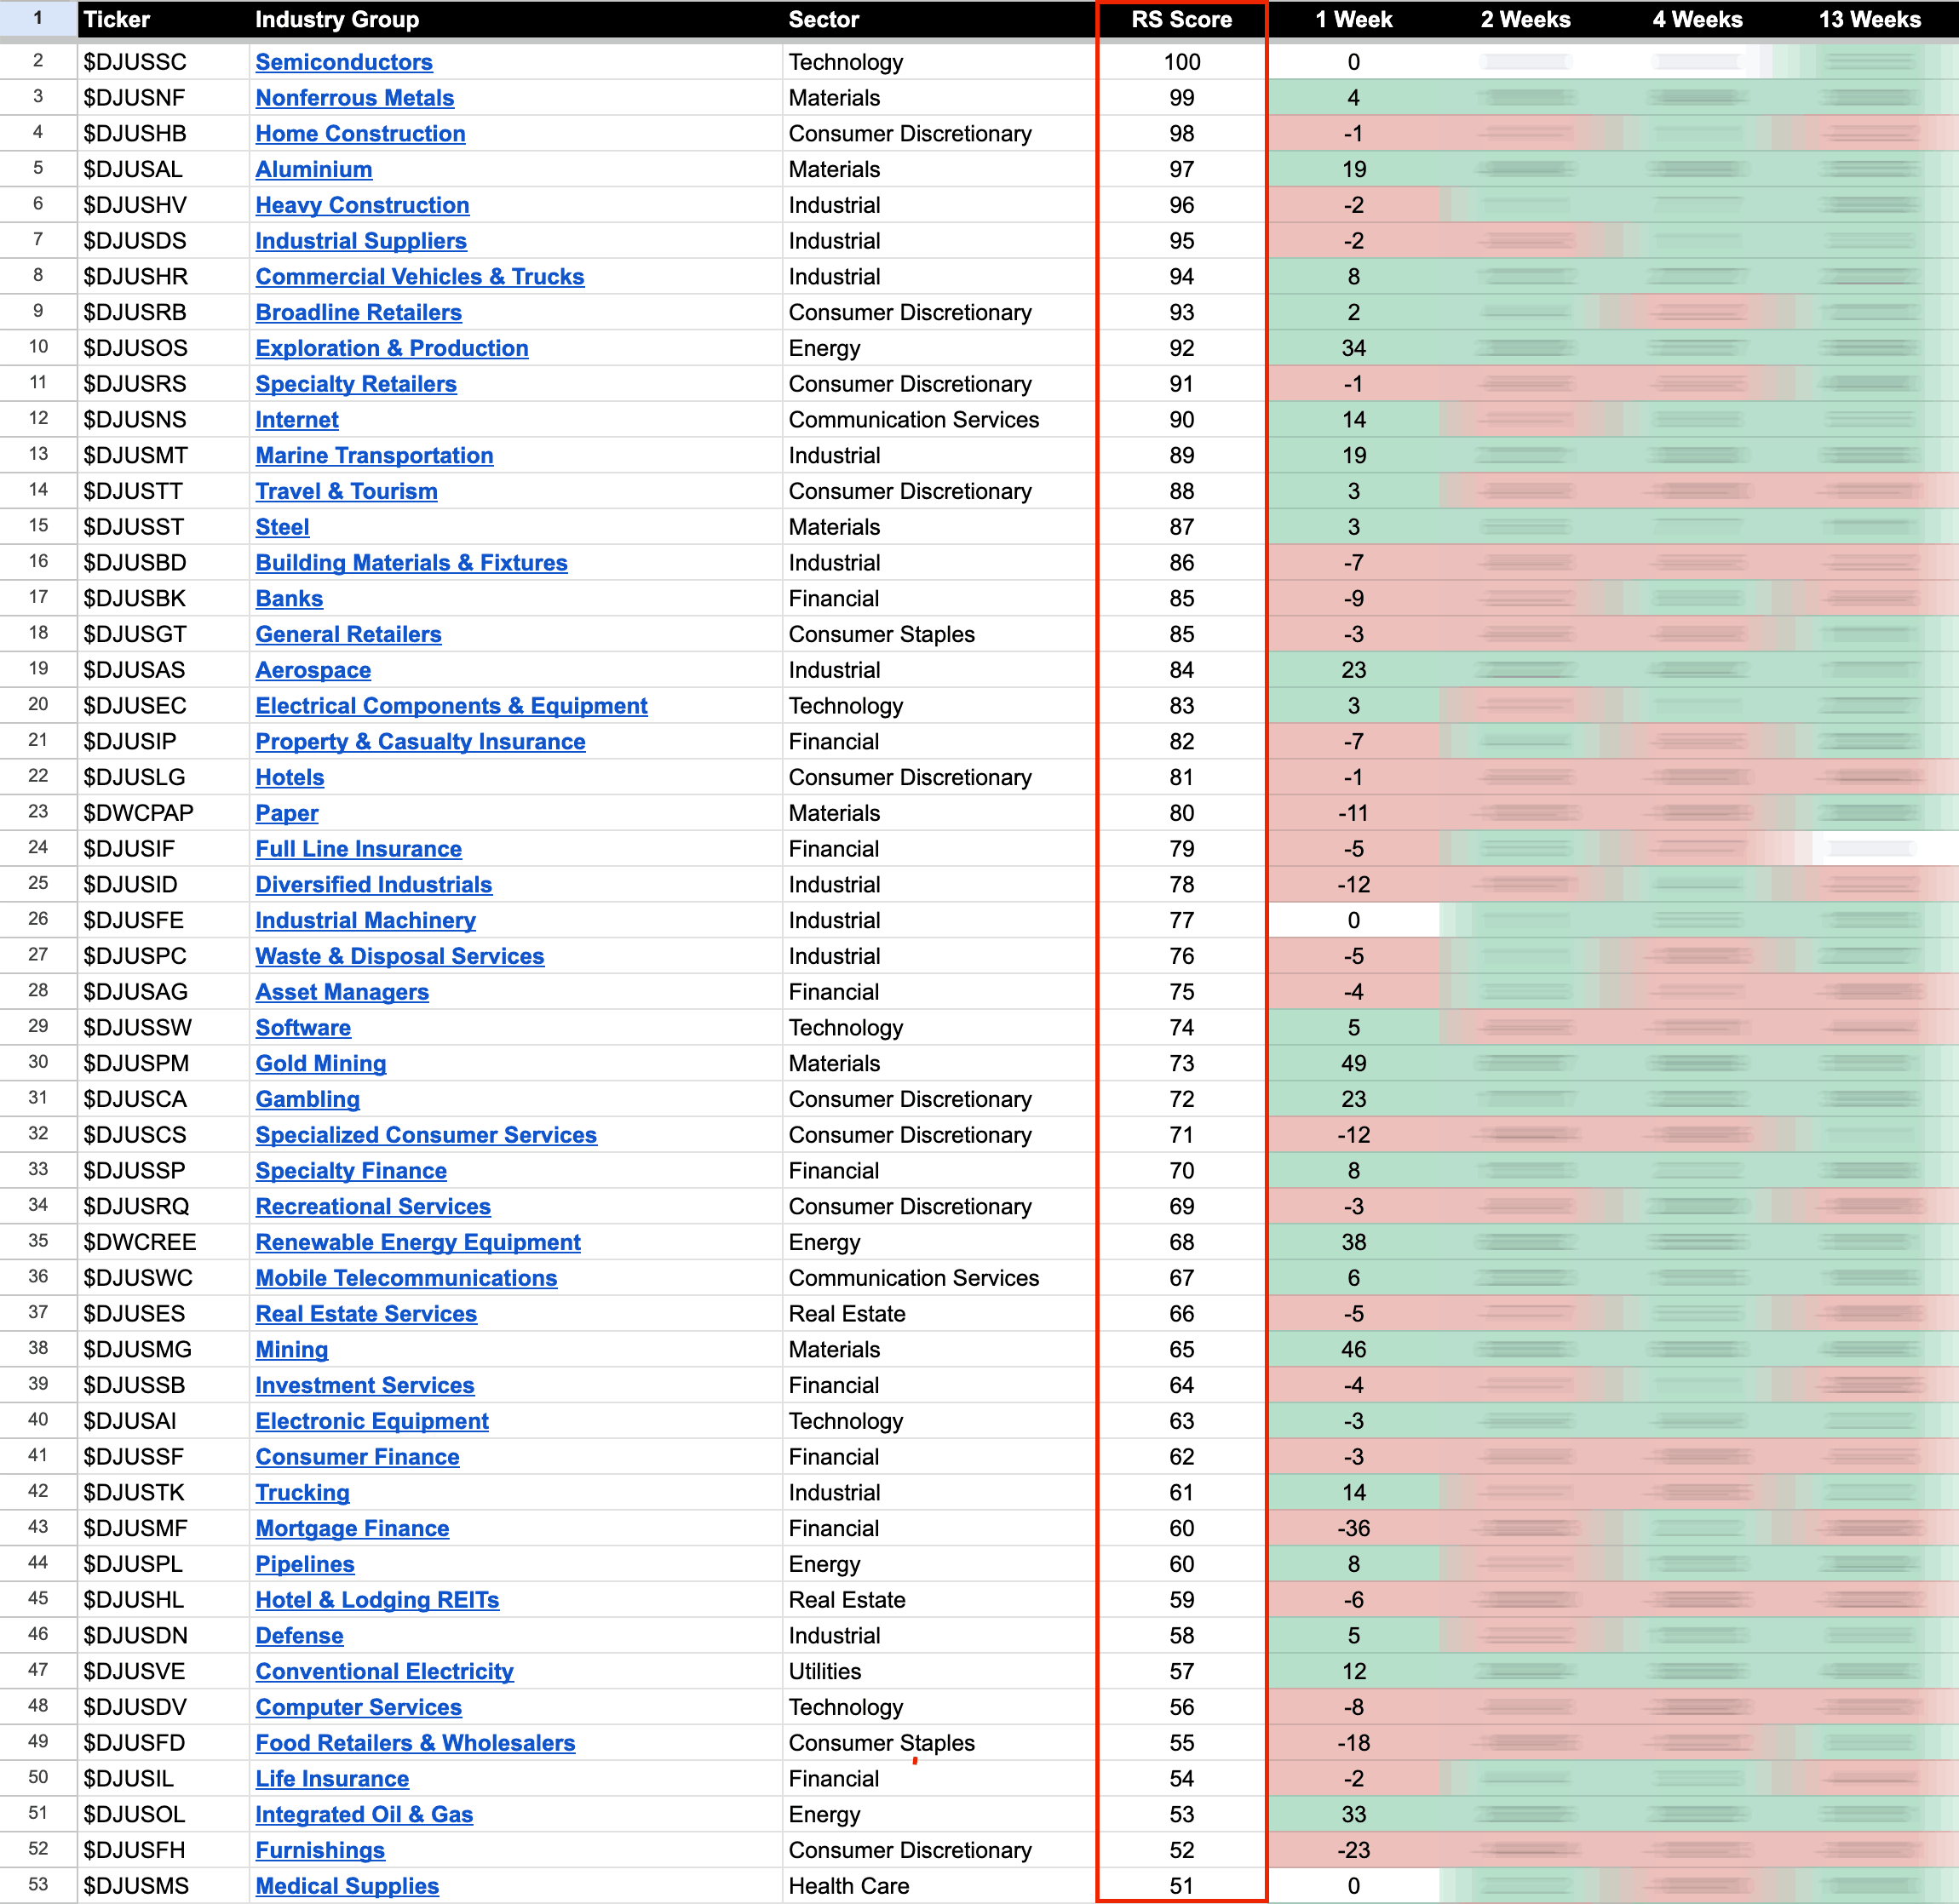
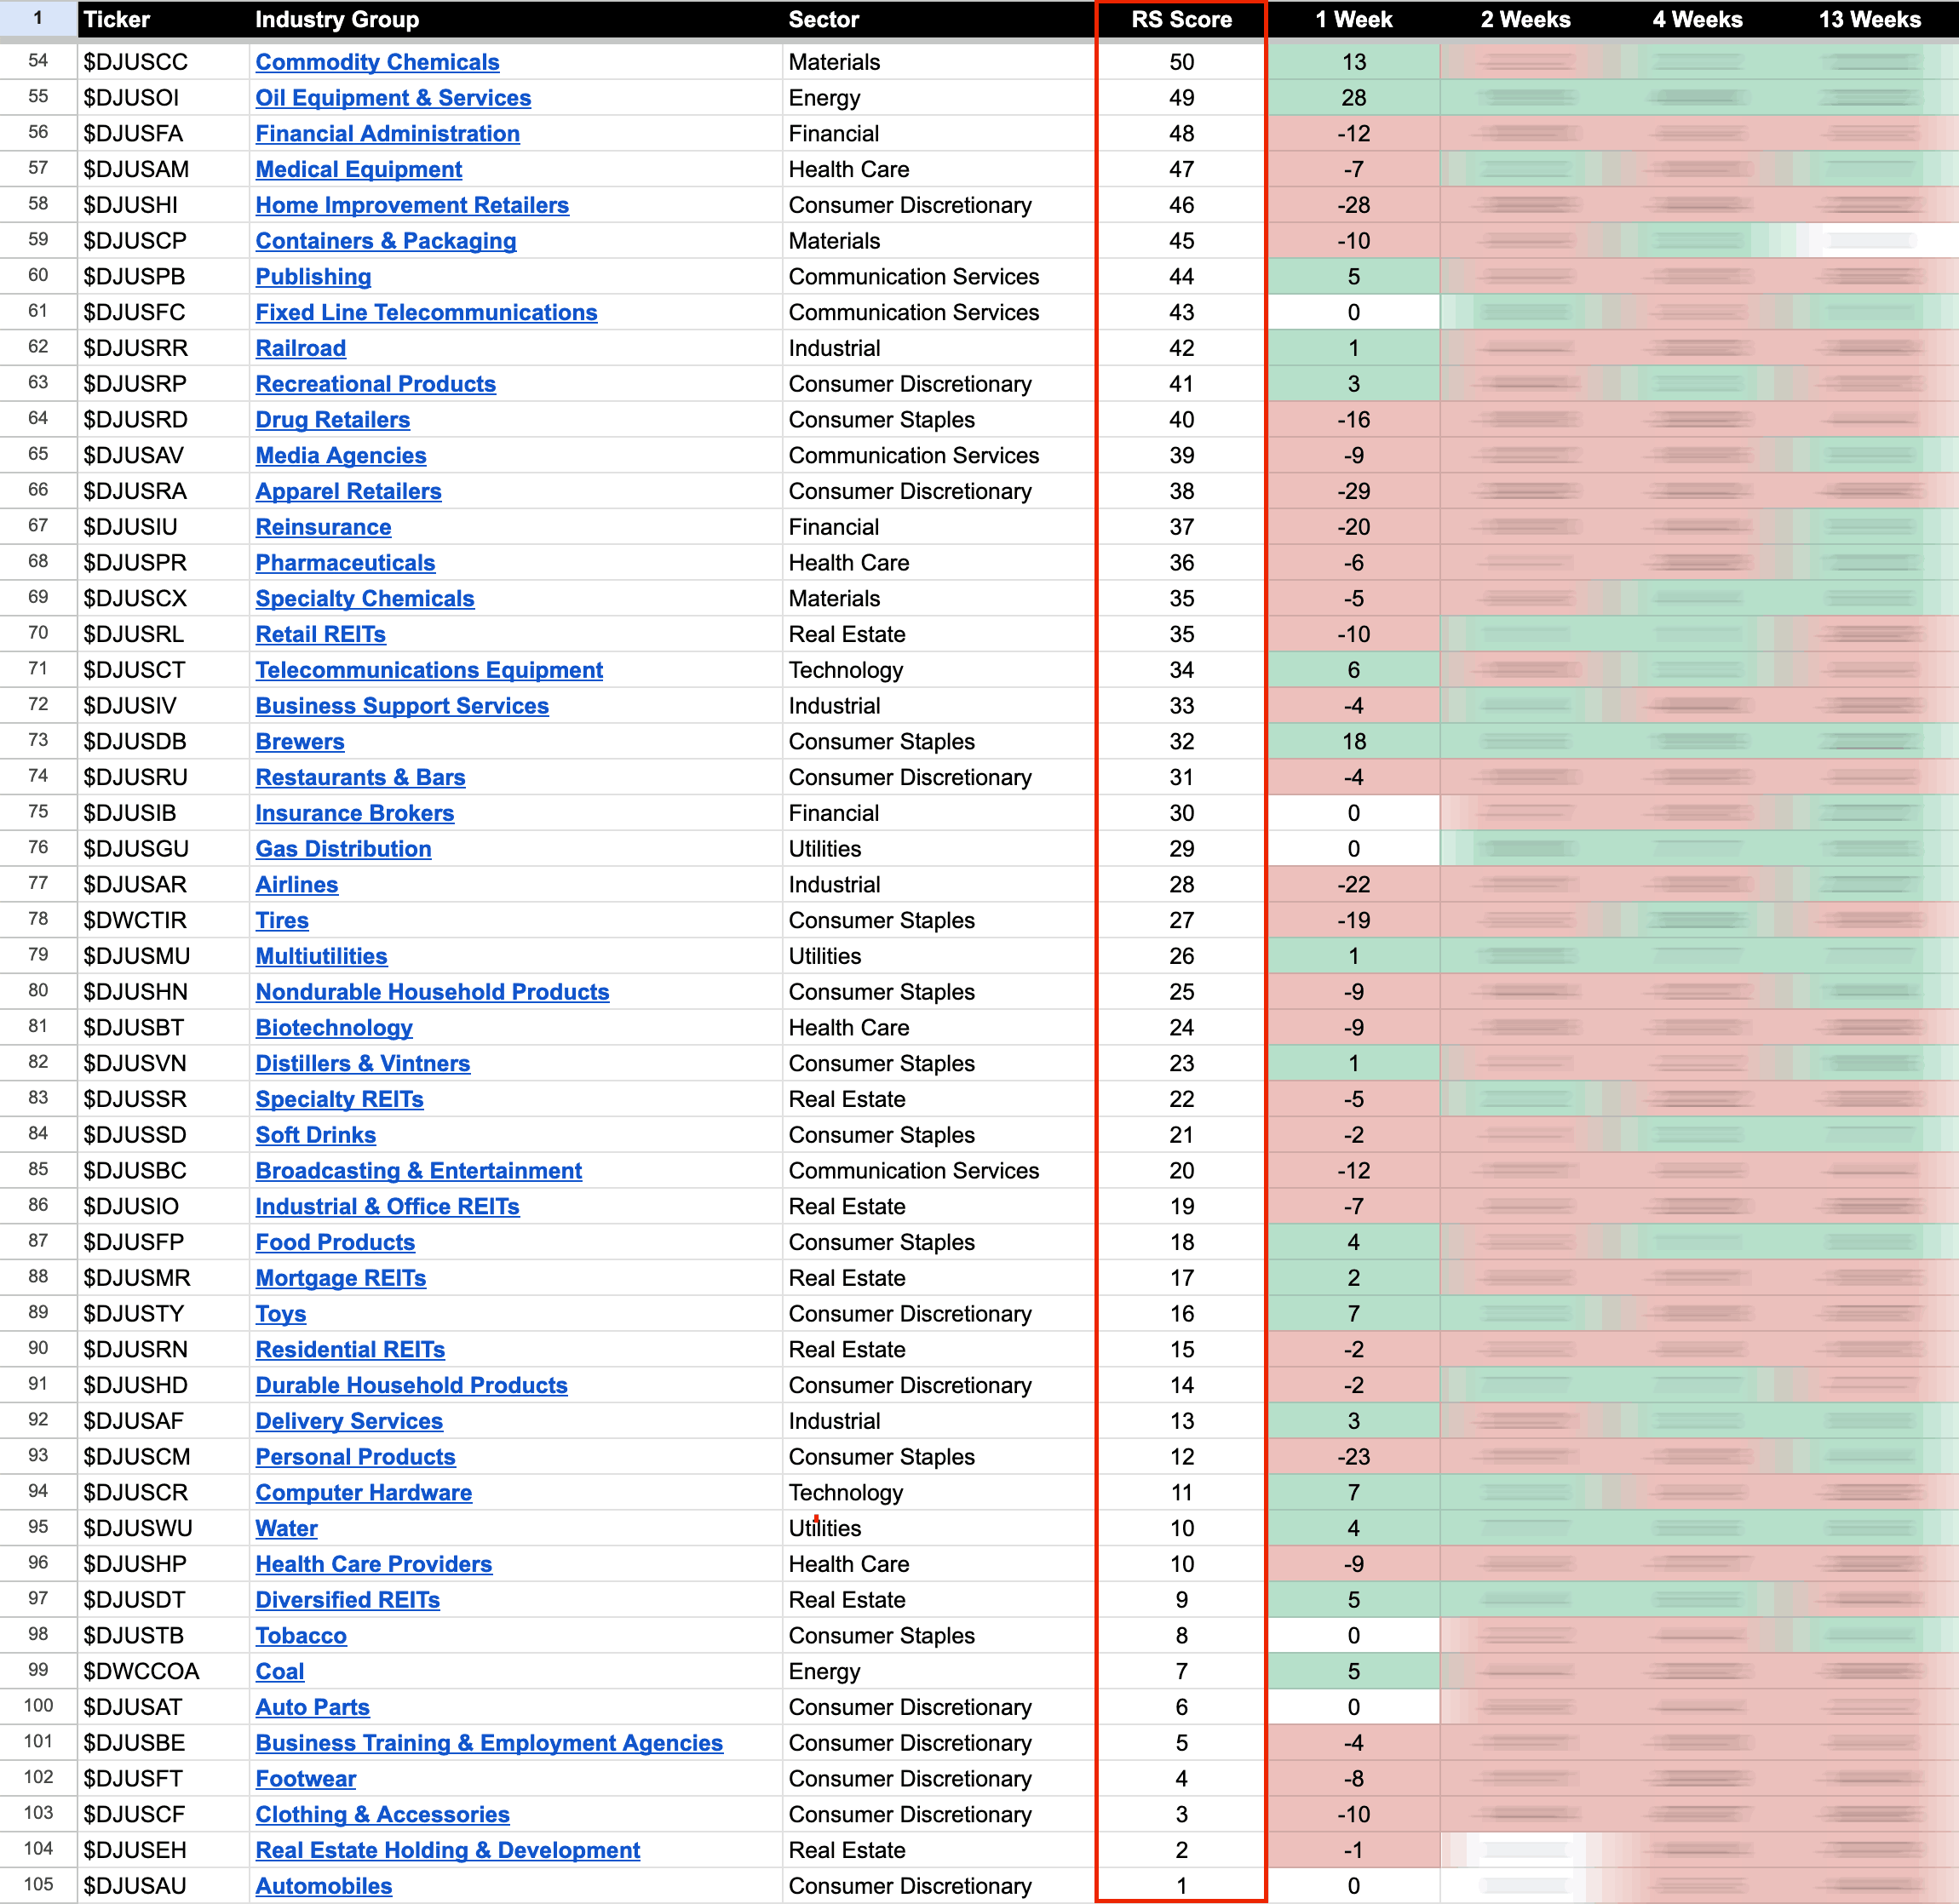
US Industry Groups by Highest RS Score
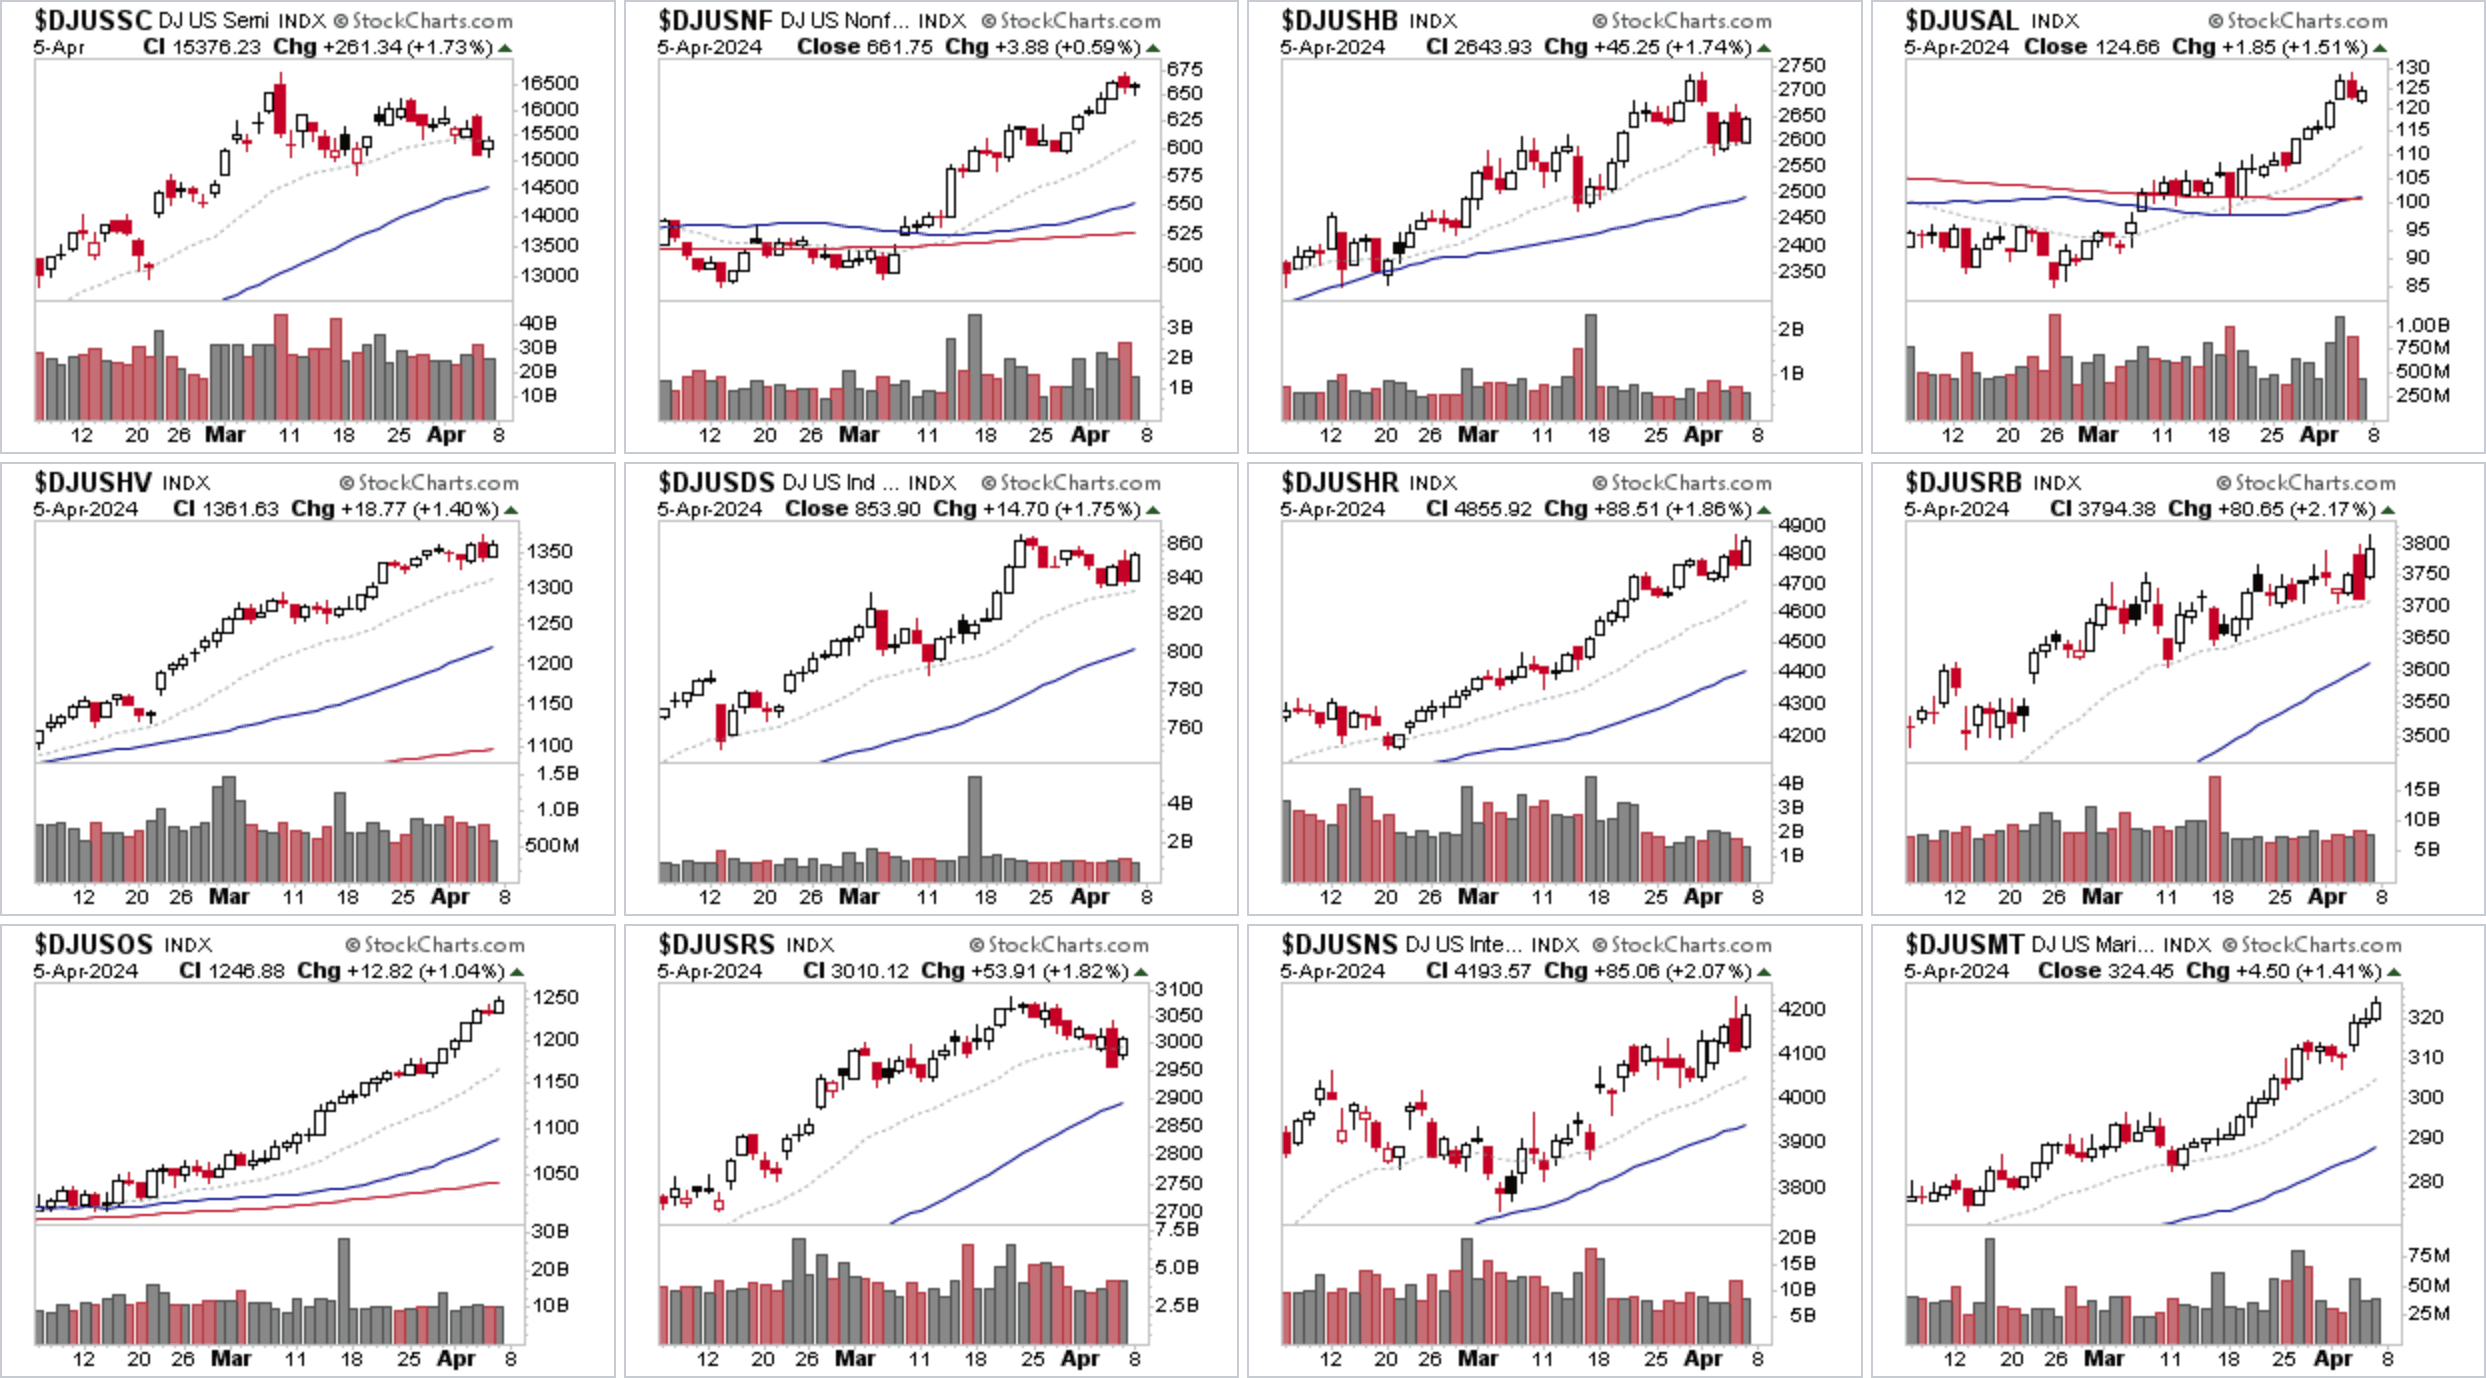
Semiconductors ($DJUSSC) once again holding onto the top spot in the Industry Groups Relative Strength (RS) Rankings. But this weeks strongest movers were in the Materials and Energy sector groups, with Gold Mining ($DJUSPM) and Mining ($DJUSMG) surging up the RS rankings and Nonferrous Metals ($DJUSNF) moving into second position overall, as physical Silver (highlighted in the 15th March post) make a strong Stage 2 breakout attempt. Closing near the highs of the week on its heaviest volume in years.
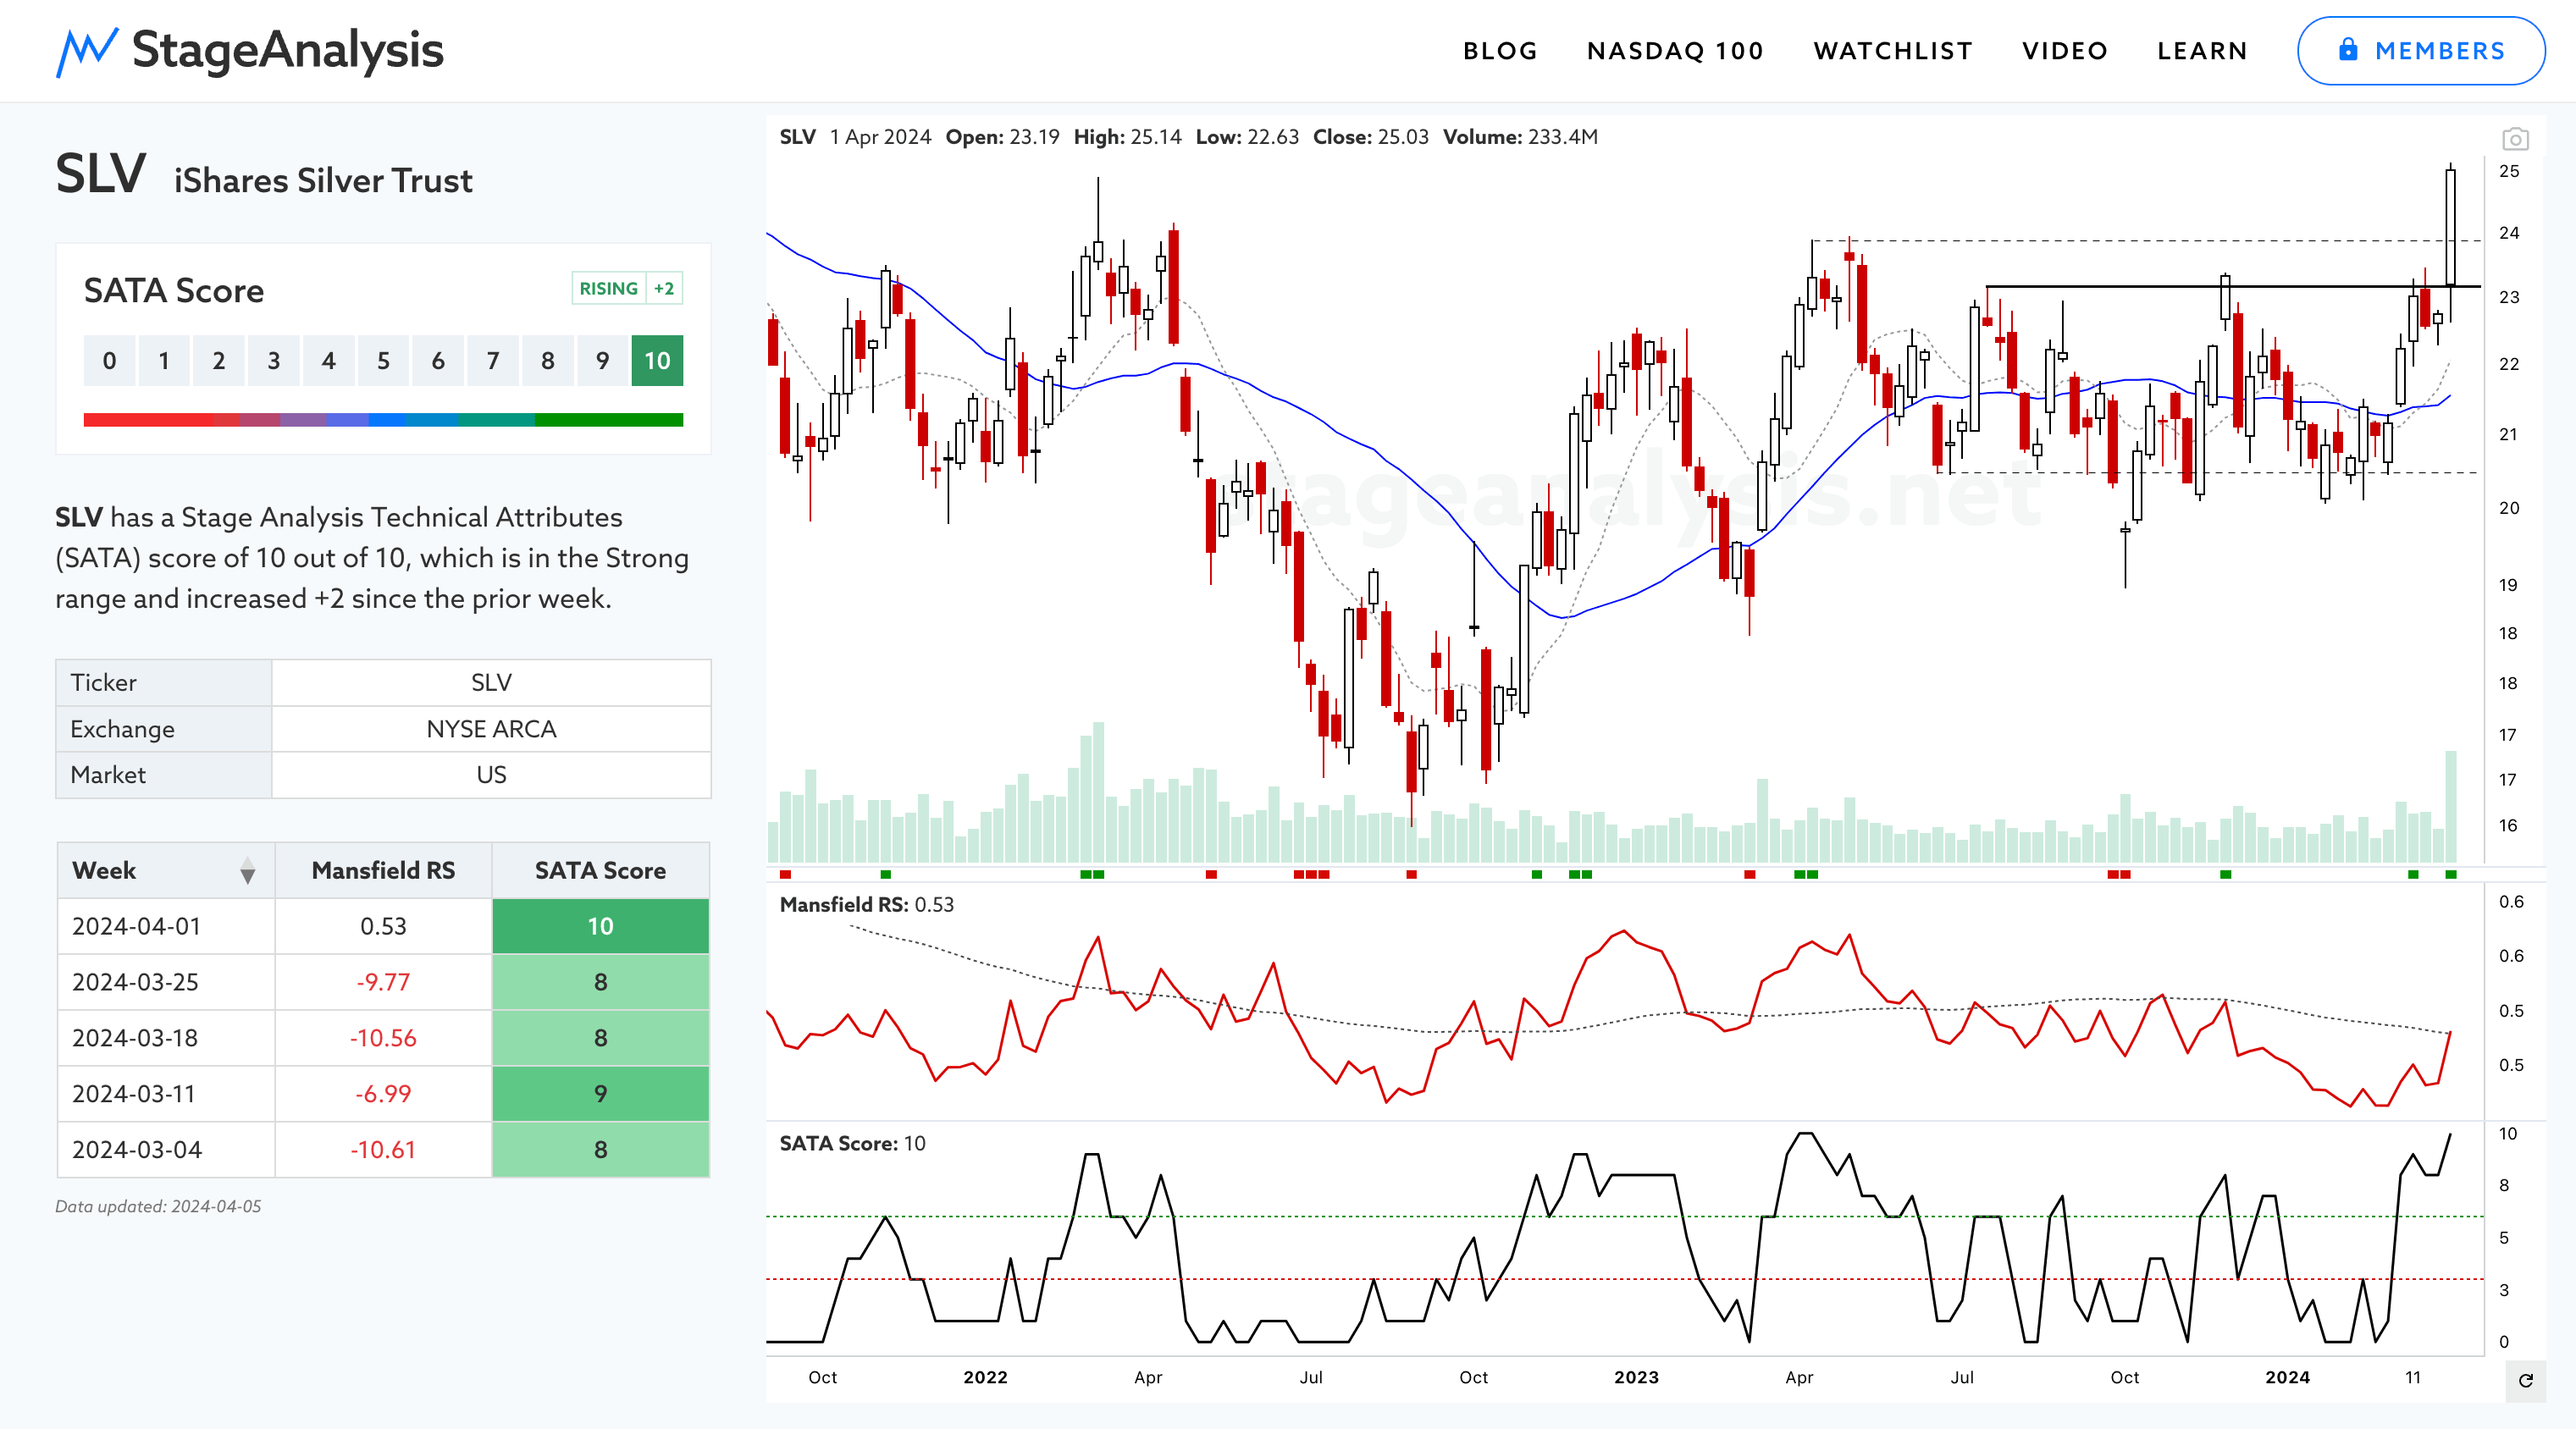
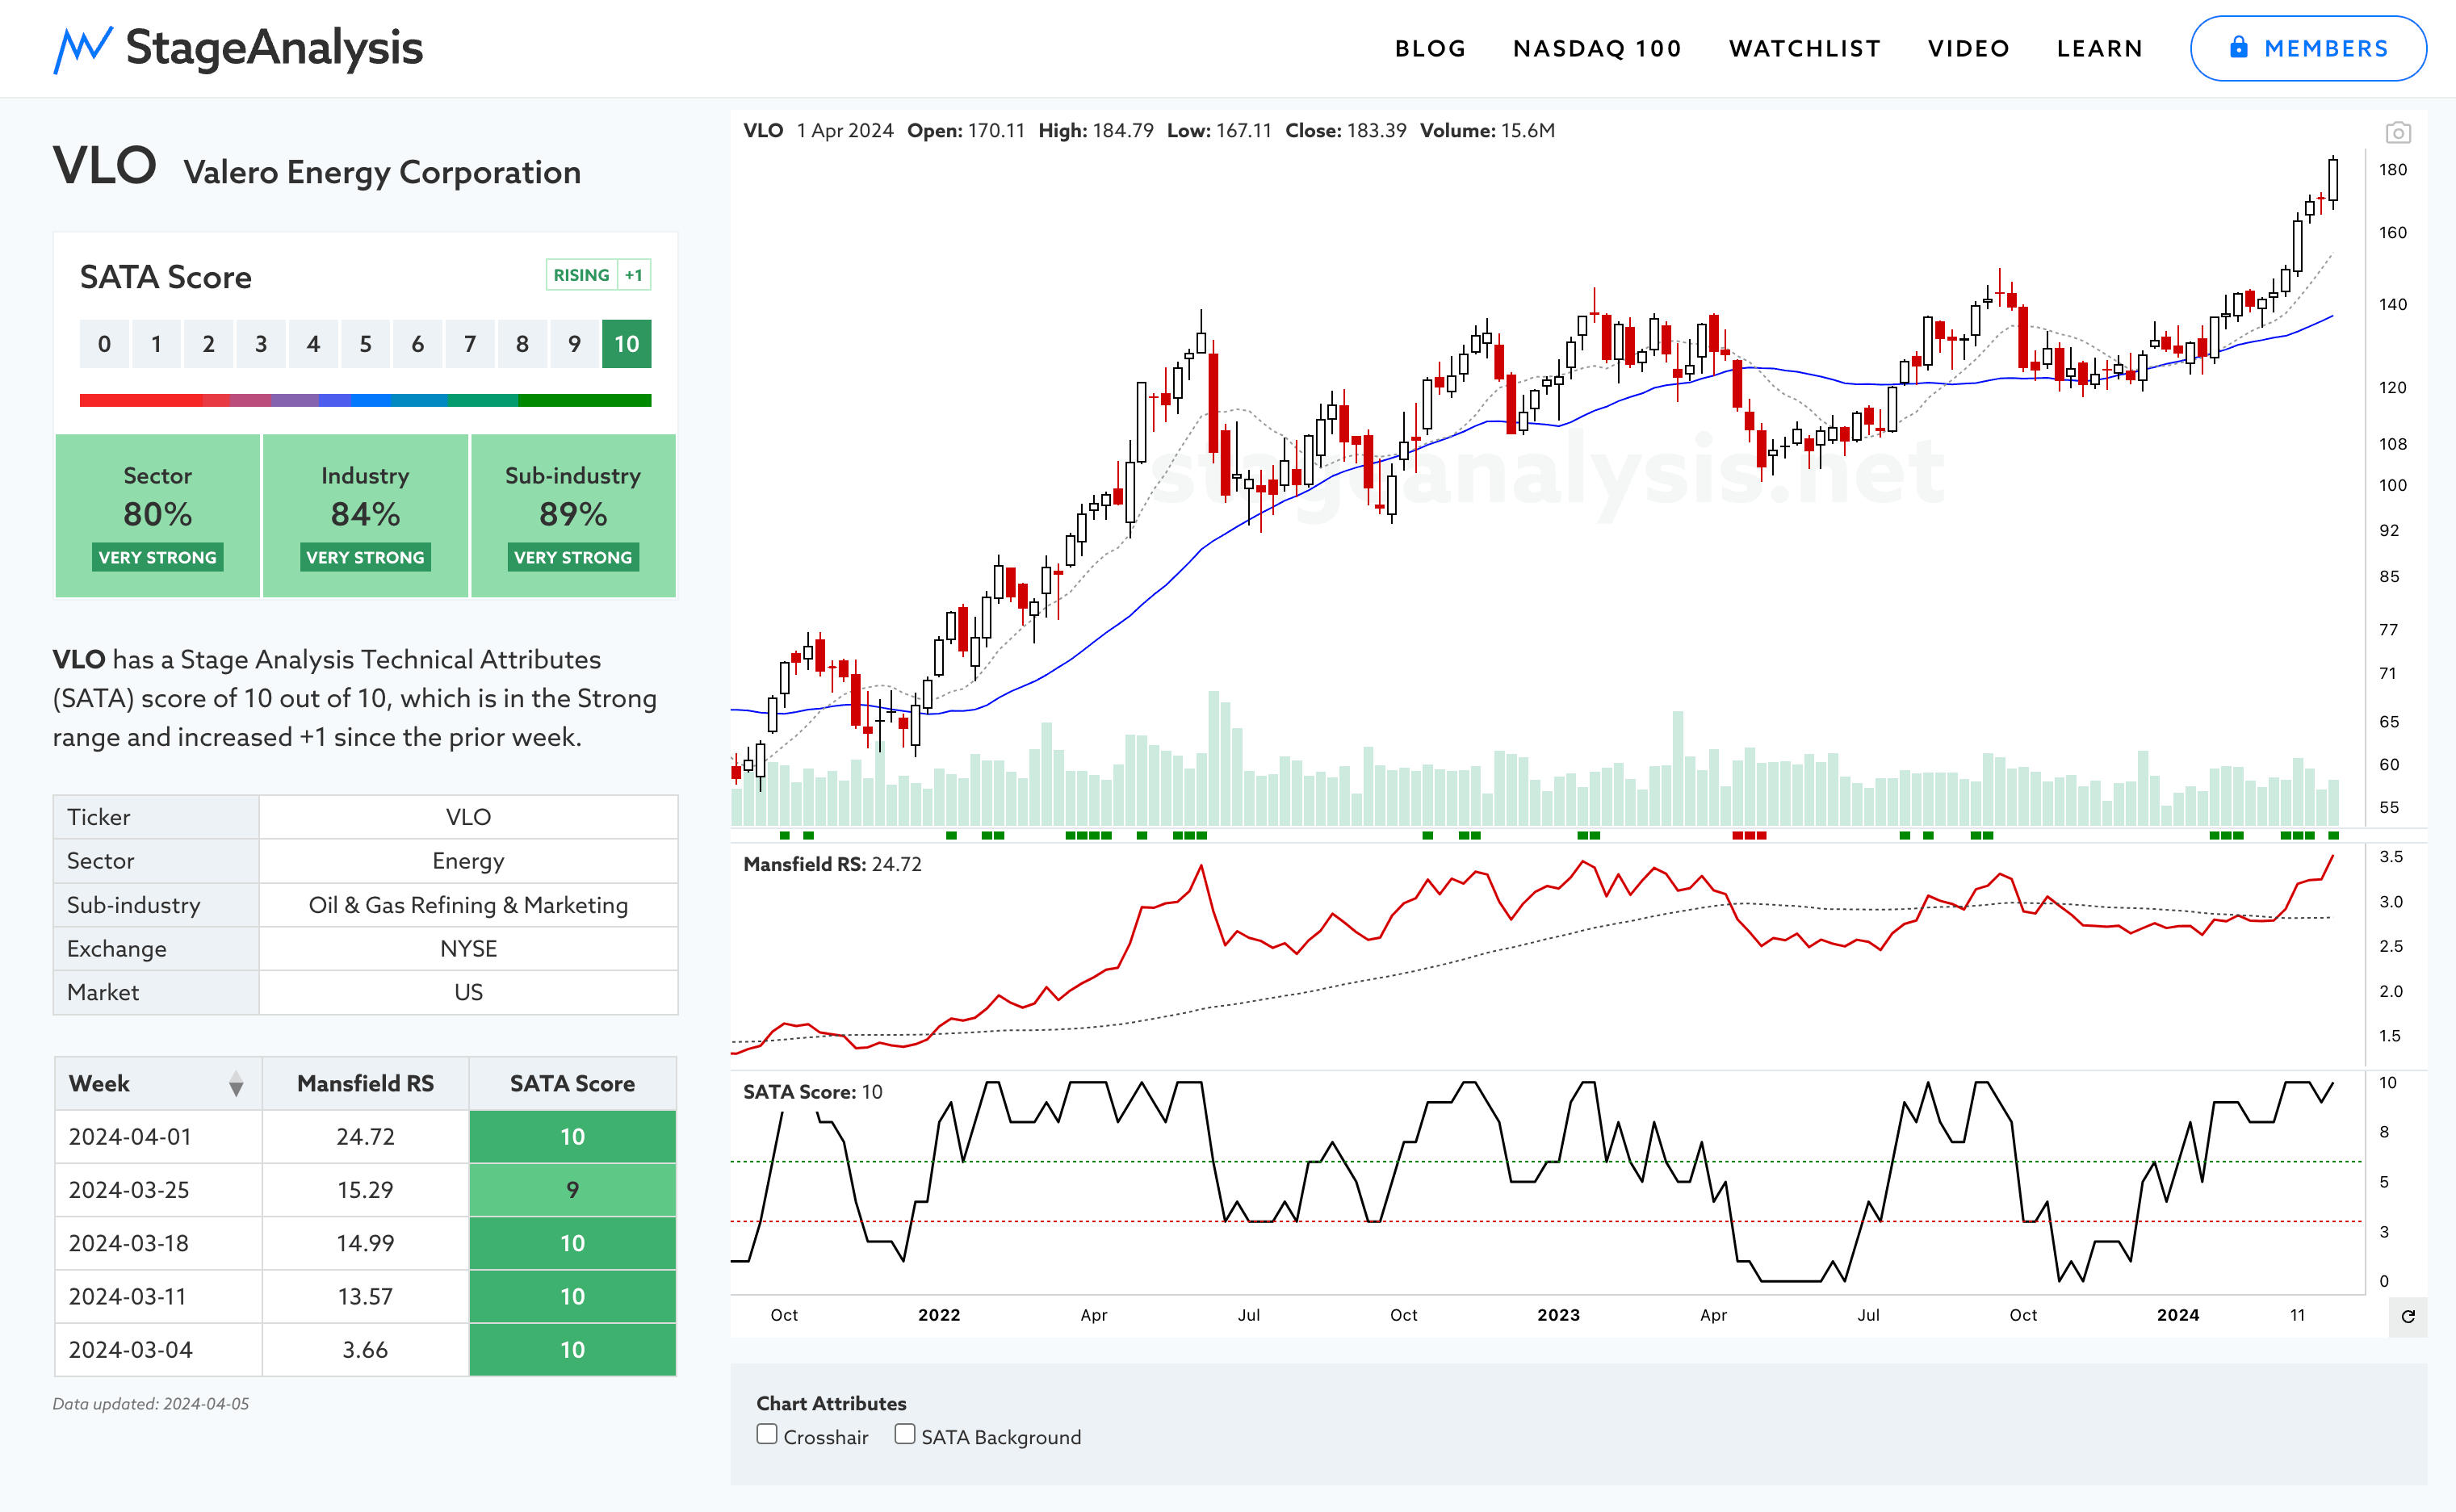
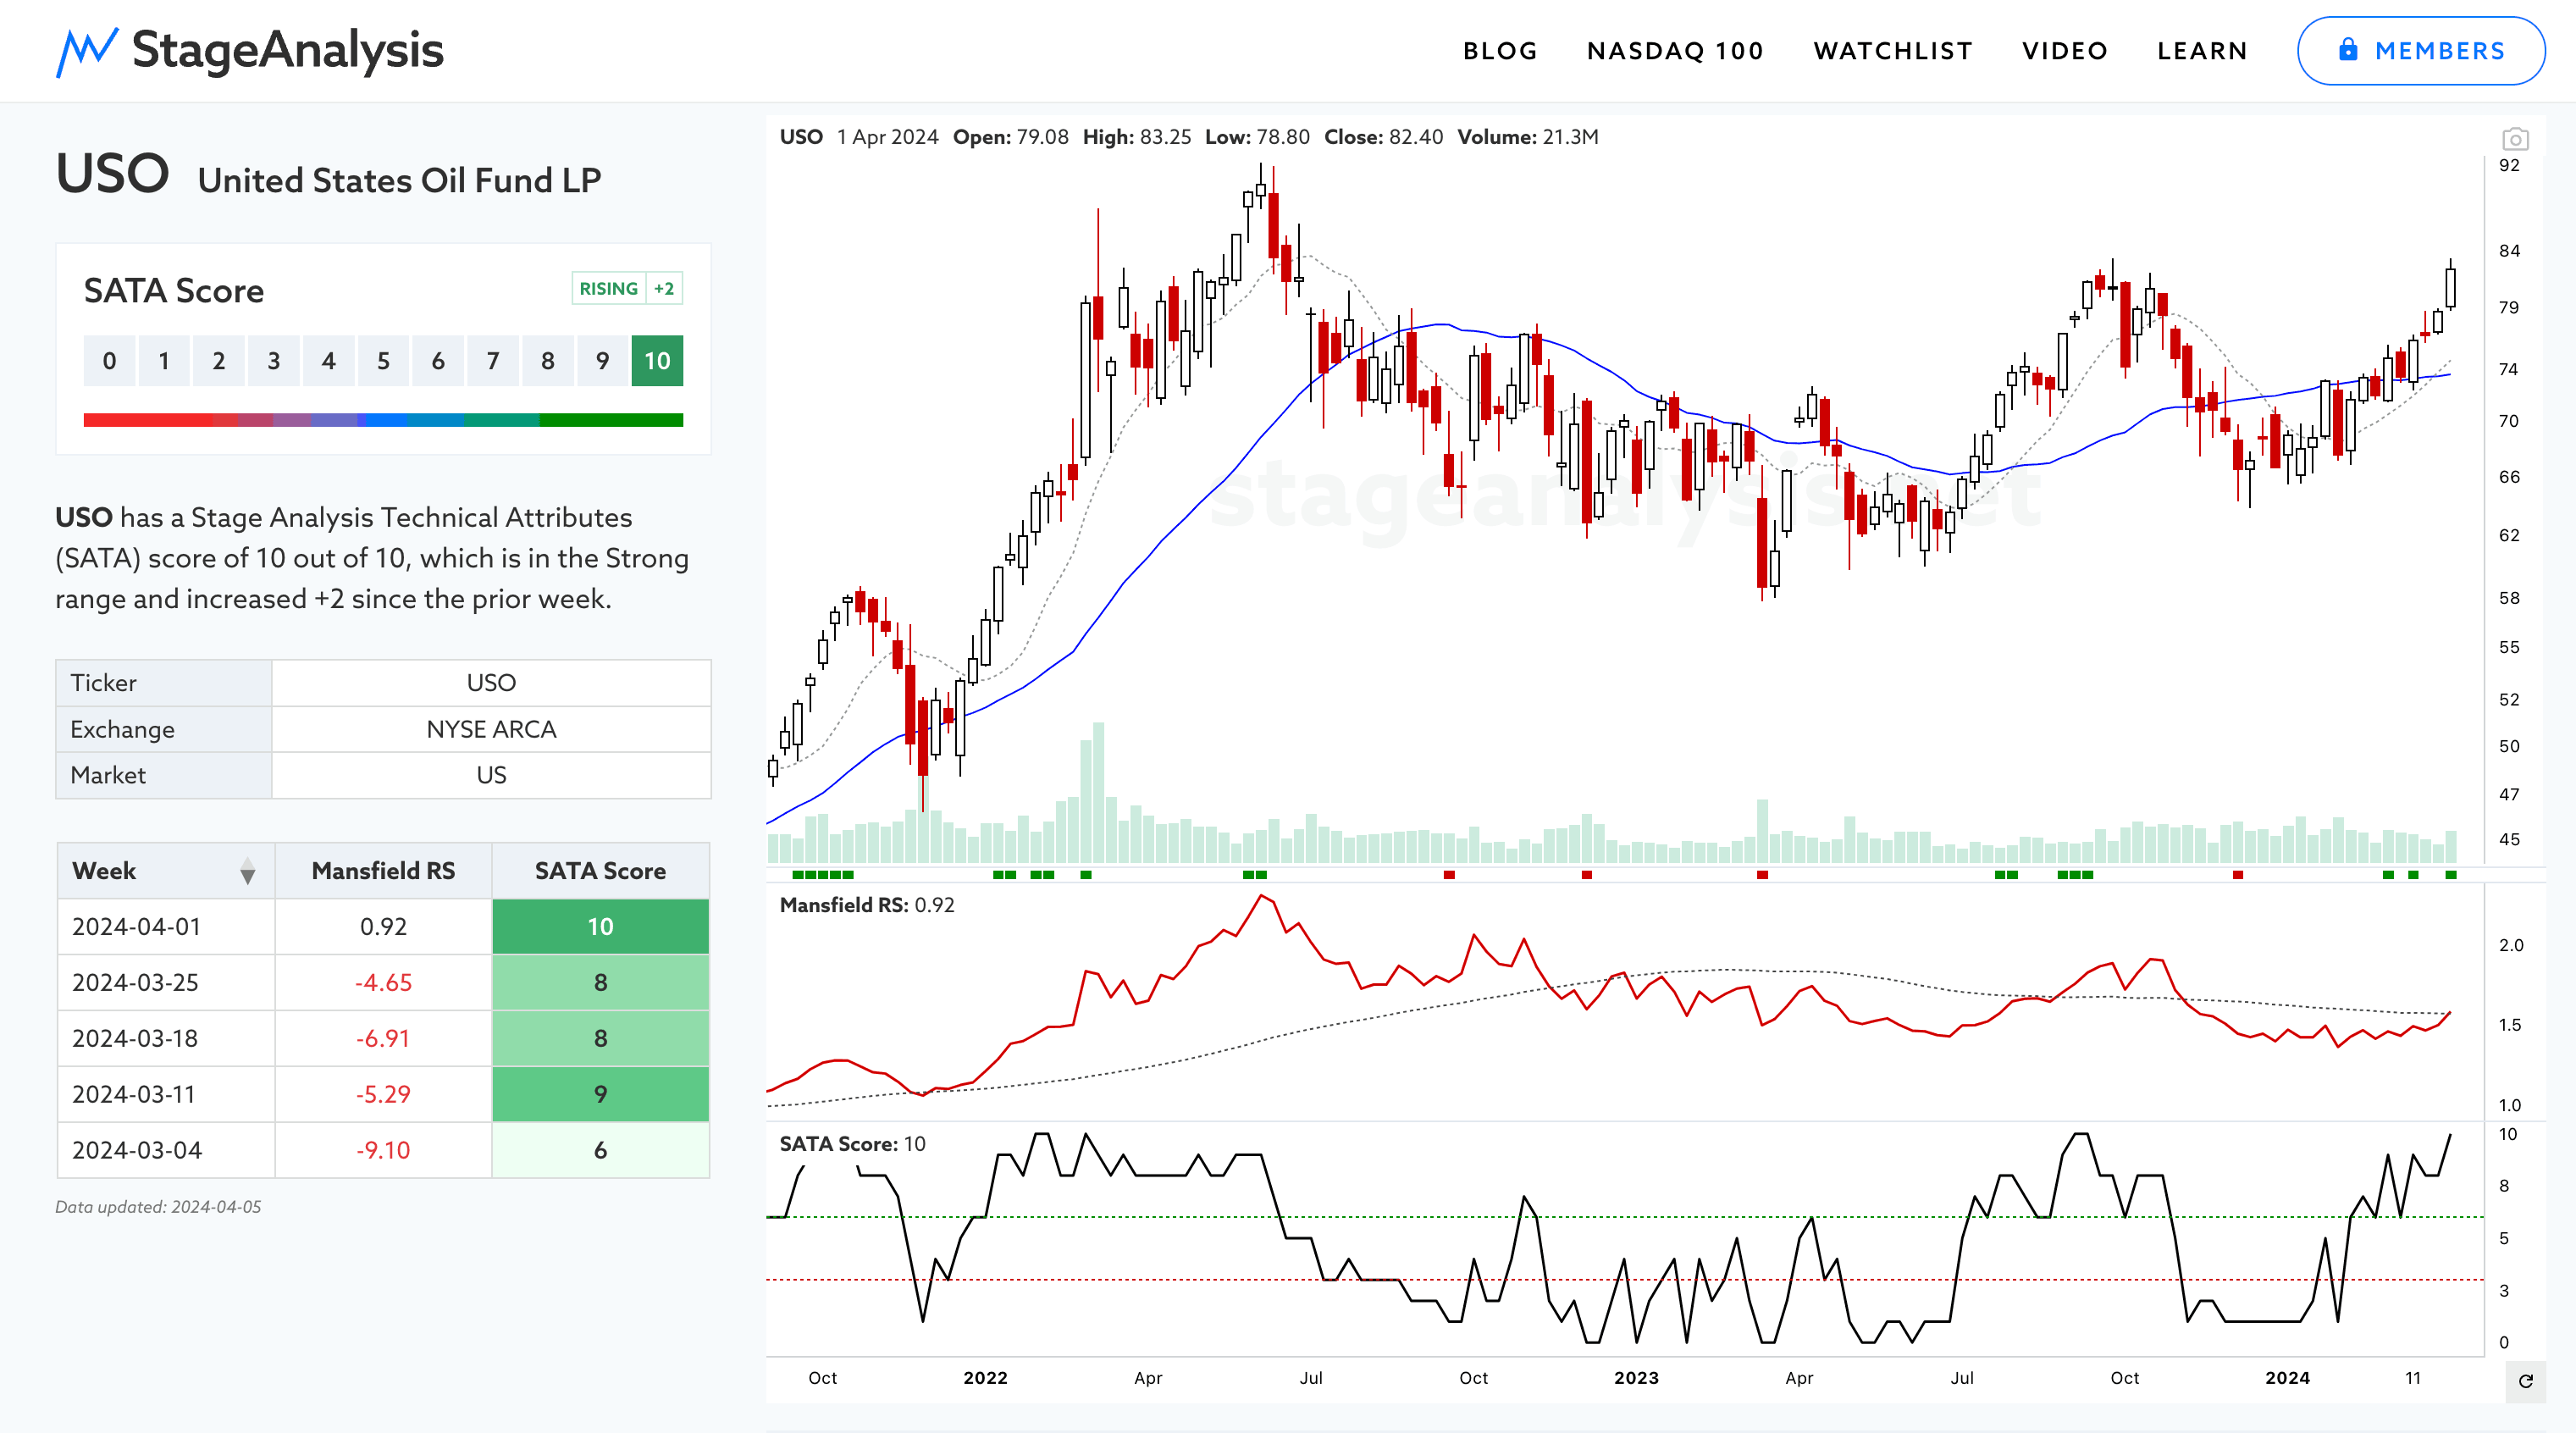
Oil & Gas groups were also on the rise this week, with the Exploration & Production ($DJUSOS) group rising 34 RS points to 9th position overall and Integrated Oil & Gas ($DJUSOL) also up strongly by 33 RS points, and Oil Equipment & Services ($DJUSOI) up by 28 RS points. This can be seen with the USO etf moving back above its Mansfield RS zero line on the below SATA chart (which website members have access to), and also VLO, which is one of the current leaders in the S&P 1500 on a SATA 10 and strong Mansfield RS score.
Note the Sector, Industry and Sub-industry panels on the left of the VLO chart. These are an exclusive feature on the Stage Analysis website that help to quickly show a stocks technical position in the market and make it really easy to compare stocks to each other, and if you click on the Sub-industry or Sector names in the table below those, it opens a side panel that shows the stocks associated with each and their SATA scores and Mansfield (RS) Relative Strength scores. So you can quickly assess a stocks peers and view their Stage Analysis SATA charts.
US Industry Groups by Weakest RS Score
US Industry Groups sorted by Relative Strength
The purpose of the Relative Strength (RS) tables is to track the short, medium and long-term RS changes of the individual groups to find the new leadership earlier than the crowd.
RS Score of 100 is the strongest, and 0 is the weakest.
In the Stage Analysis method we are looking to focus on the strongest groups, as what is strong, tends to stay strong for a long time. But we also want to find the improving / up and coming groups that are starting to rise up strongly through the RS table from the lower zone, in order to find the future leading stocks before they break out from a Stage 1 base and move into a Stage 2 advancing phase.
Each week I go through the most interesting groups on the move in more detail during the Stage Analysis Members weekend video – as Industry Group analysis is a key part of Stan Weinstein's Stage Analysis method.
Become a Stage Analysis Member:
To see more like this – US Stocks watchlist posts, detailed videos each weekend, use our unique Stage Analysis tools, such as the US Stocks & ETFs Screener, Charts, Market Breadth, Group Relative Strength and more...
Join Today
Disclaimer: For educational purpose only. Not investment advice. Seek professional advice from a financial advisor before making any investing decisions.