
Stage Analysis Technical Attributes Scores – Nasdaq 100
The Stage Analysis Technical Attributes (SATA) score is our proprietary indicator that helps to identify the four stages from Stan Weinstein's Stage Analysis method, using a scoring system from 0 to 10 that rates key technical characteristics that we look for when analysing the weekly charts.
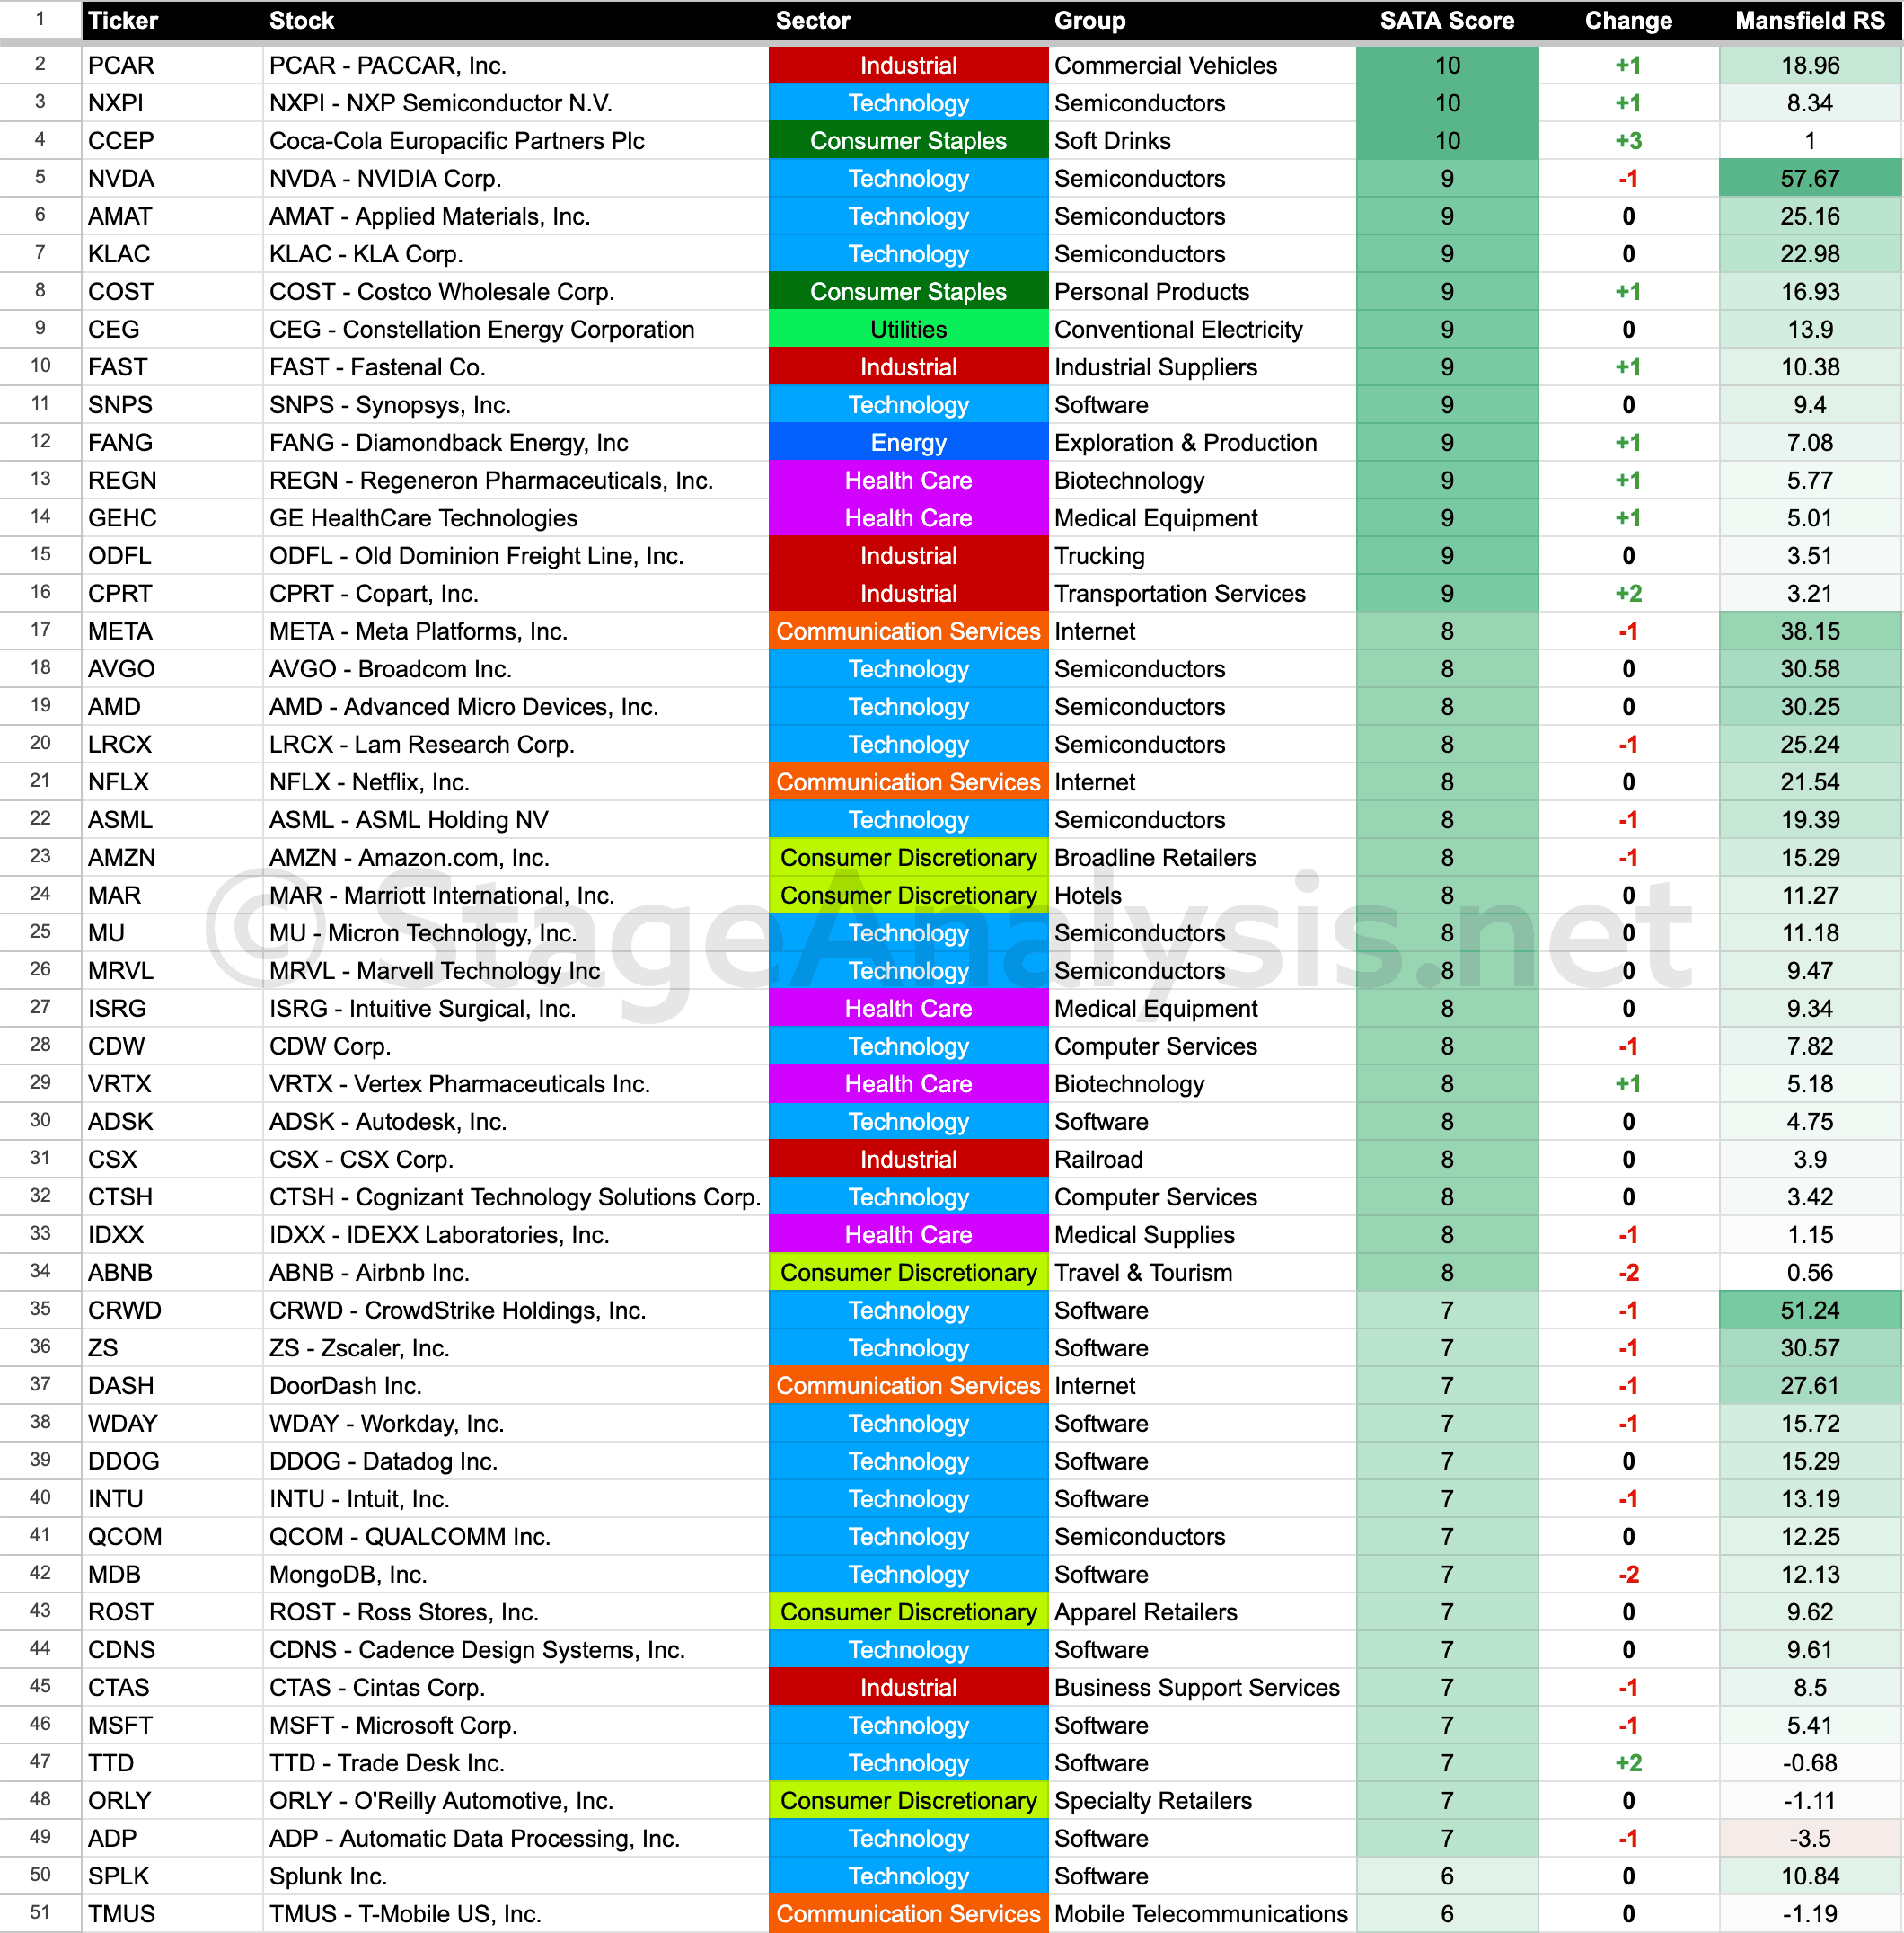
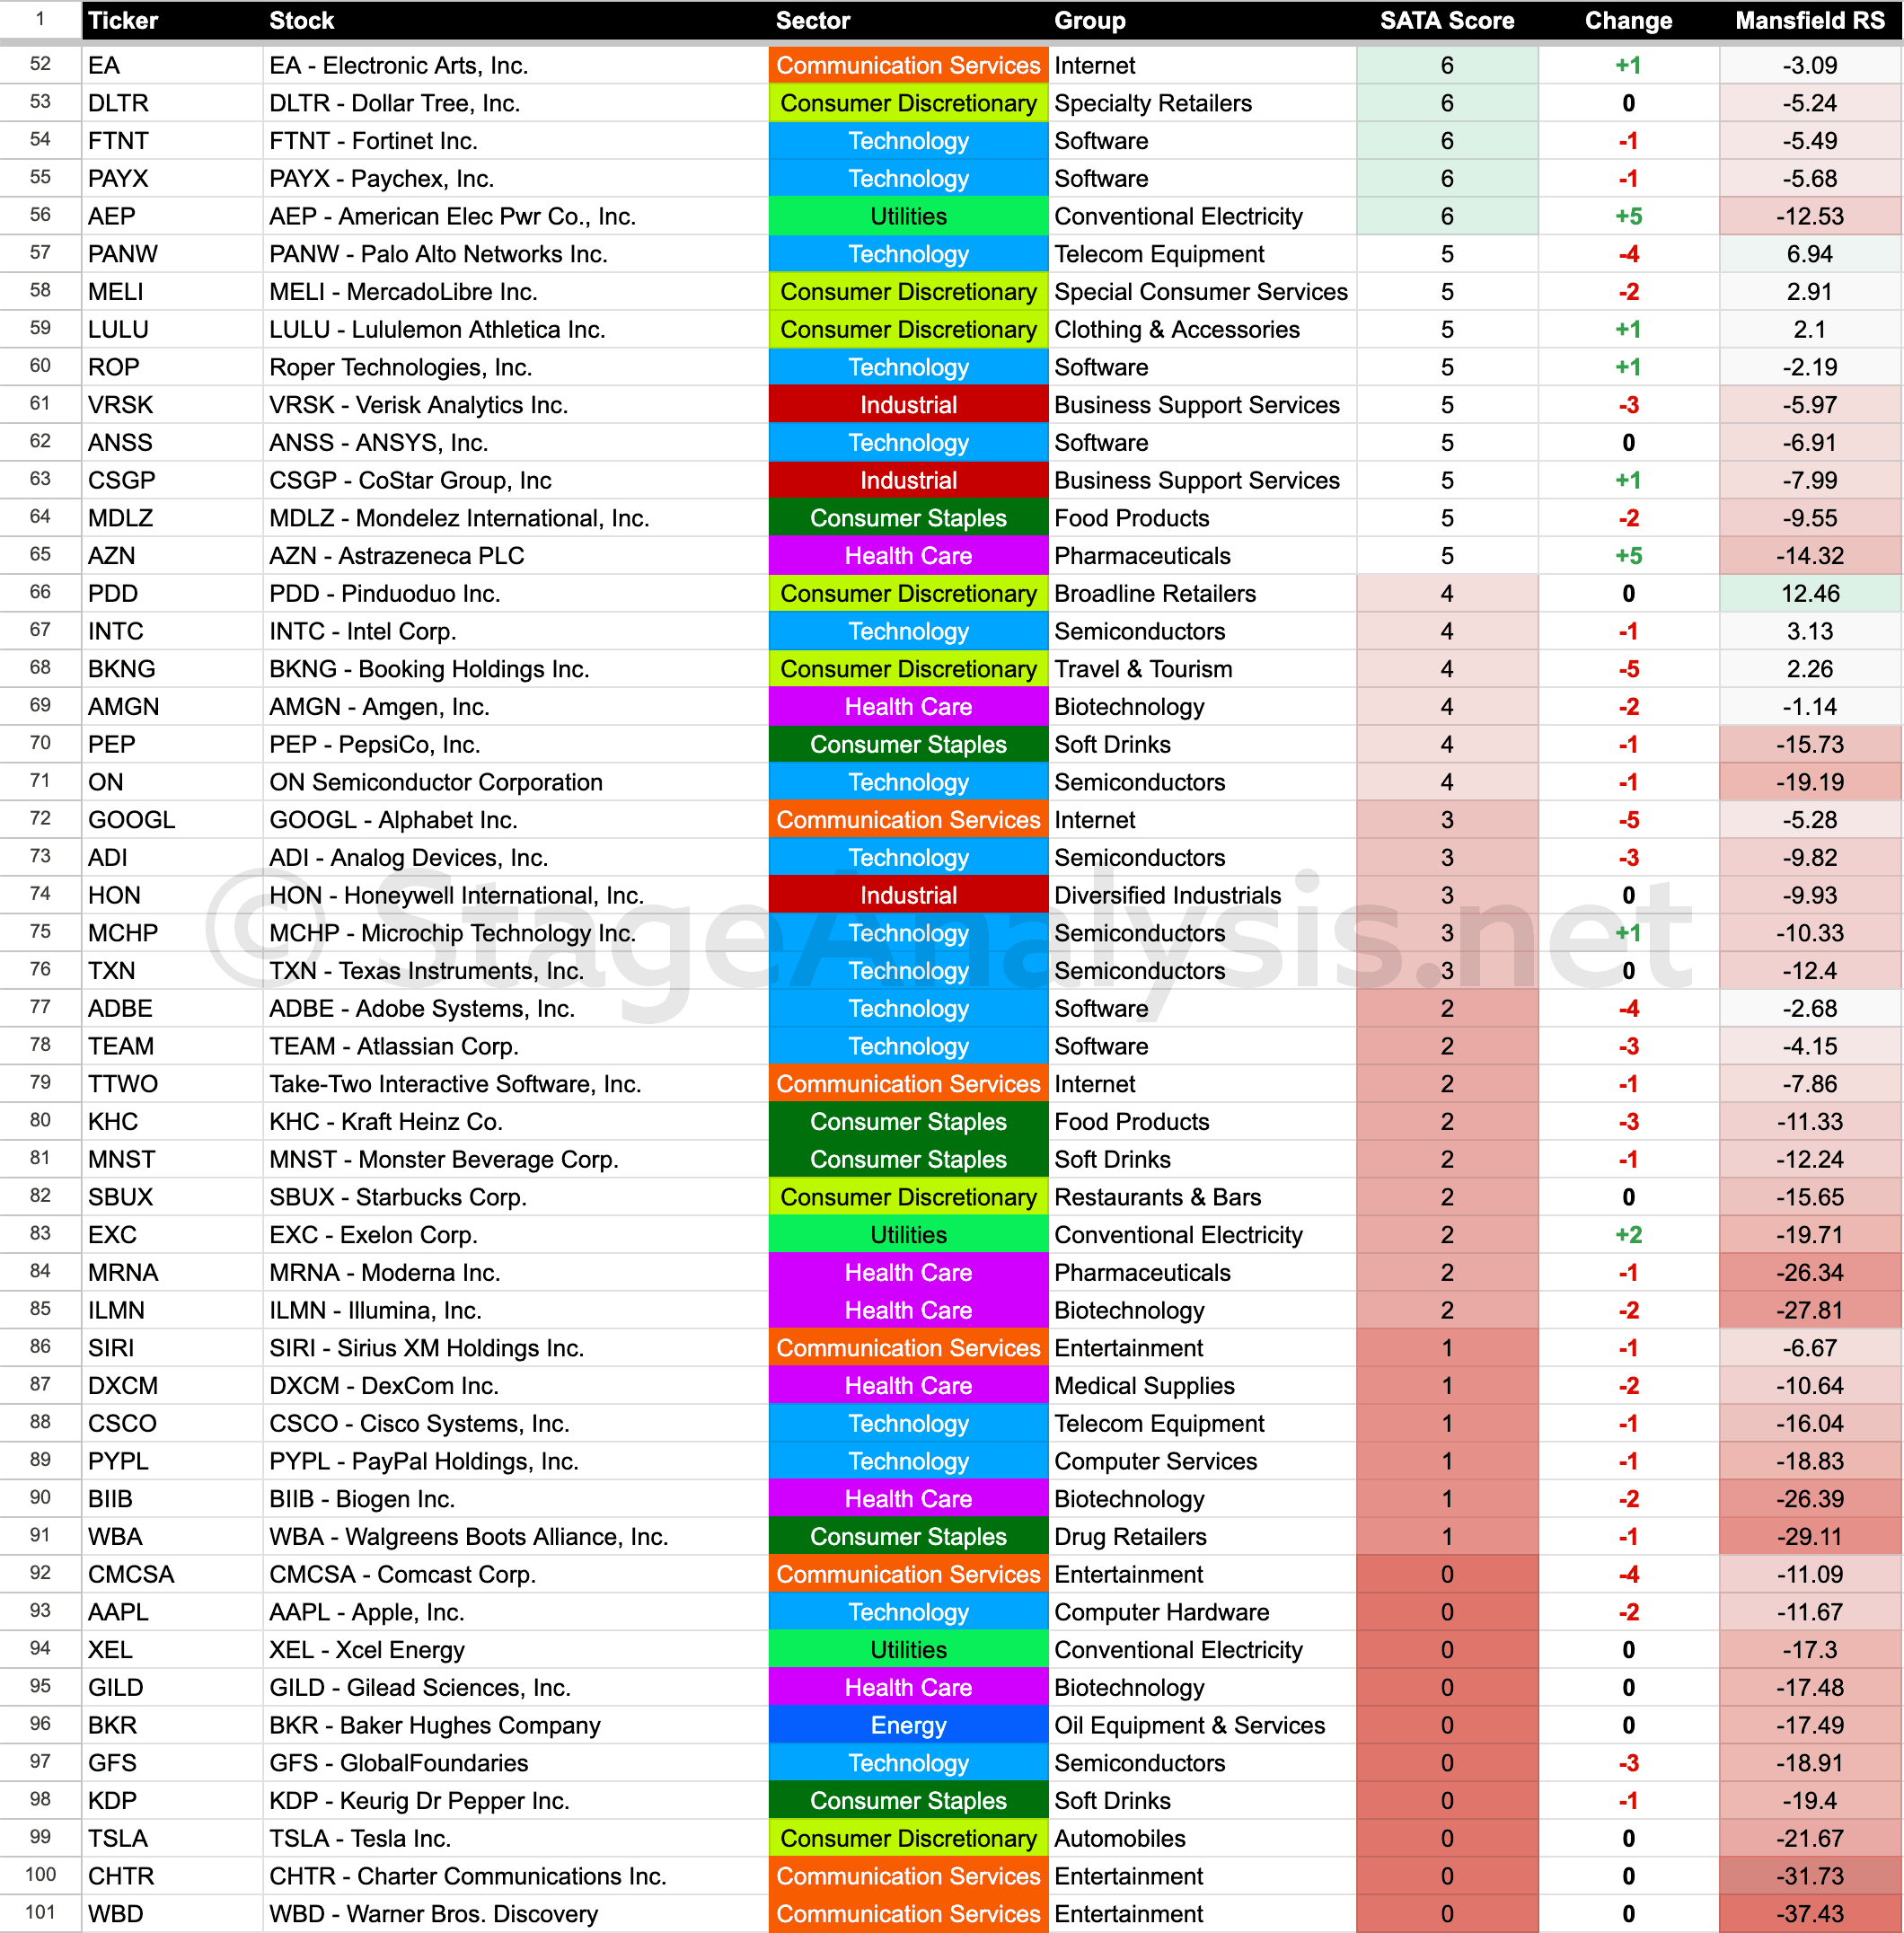
We last covered the weekly SATA scores for the Nasdaq 100 back on 12th February, which gives a rough guide of the Stages of the individual stocks within the Nasdaq 100. i.e. everything above a 7 would be considered in the Stage 2 zone (Strong), 4-6 in the Stage 1 or Stage 3 zone (Neutral), and 3 or below is the Stage 4 zone (Weak).
Currently the Nasdaq 100 consists of:
- 48% Stage 2 zone (Strong)
- 22% Stage 1 or Stage 3 zone (Neutral)
- 30% Stage 4 zone (Weak)
Percentage of stocks with a technically healthy SATA Score (6+): 55%
Nasdaq 100 Stocks – Ordered by Highest SATA Score + Mansfield Relative Strength
Compared to the 12th February post there was a decrease of -7% of stocks in the Strong Stage 2 zone, a increase of +2% in the Neutral Stage 1 or Stage 3 zone, and increase of +5% in the Weak Stage 4 zone.
The overall weighting decreased by -6%, as there are now 55% of the Nasdaq 100 stocks in a technically healthy position (based on their weekly SATA score data), and a strong (Stage 2) to weak (Stage 4) ratio of 1.6 – i.e. there are 60% more strong stocks than weak stocks. So the decline in the overall field position has continued and has dropped back into Neutral+ territory (50% to 59.99% range).
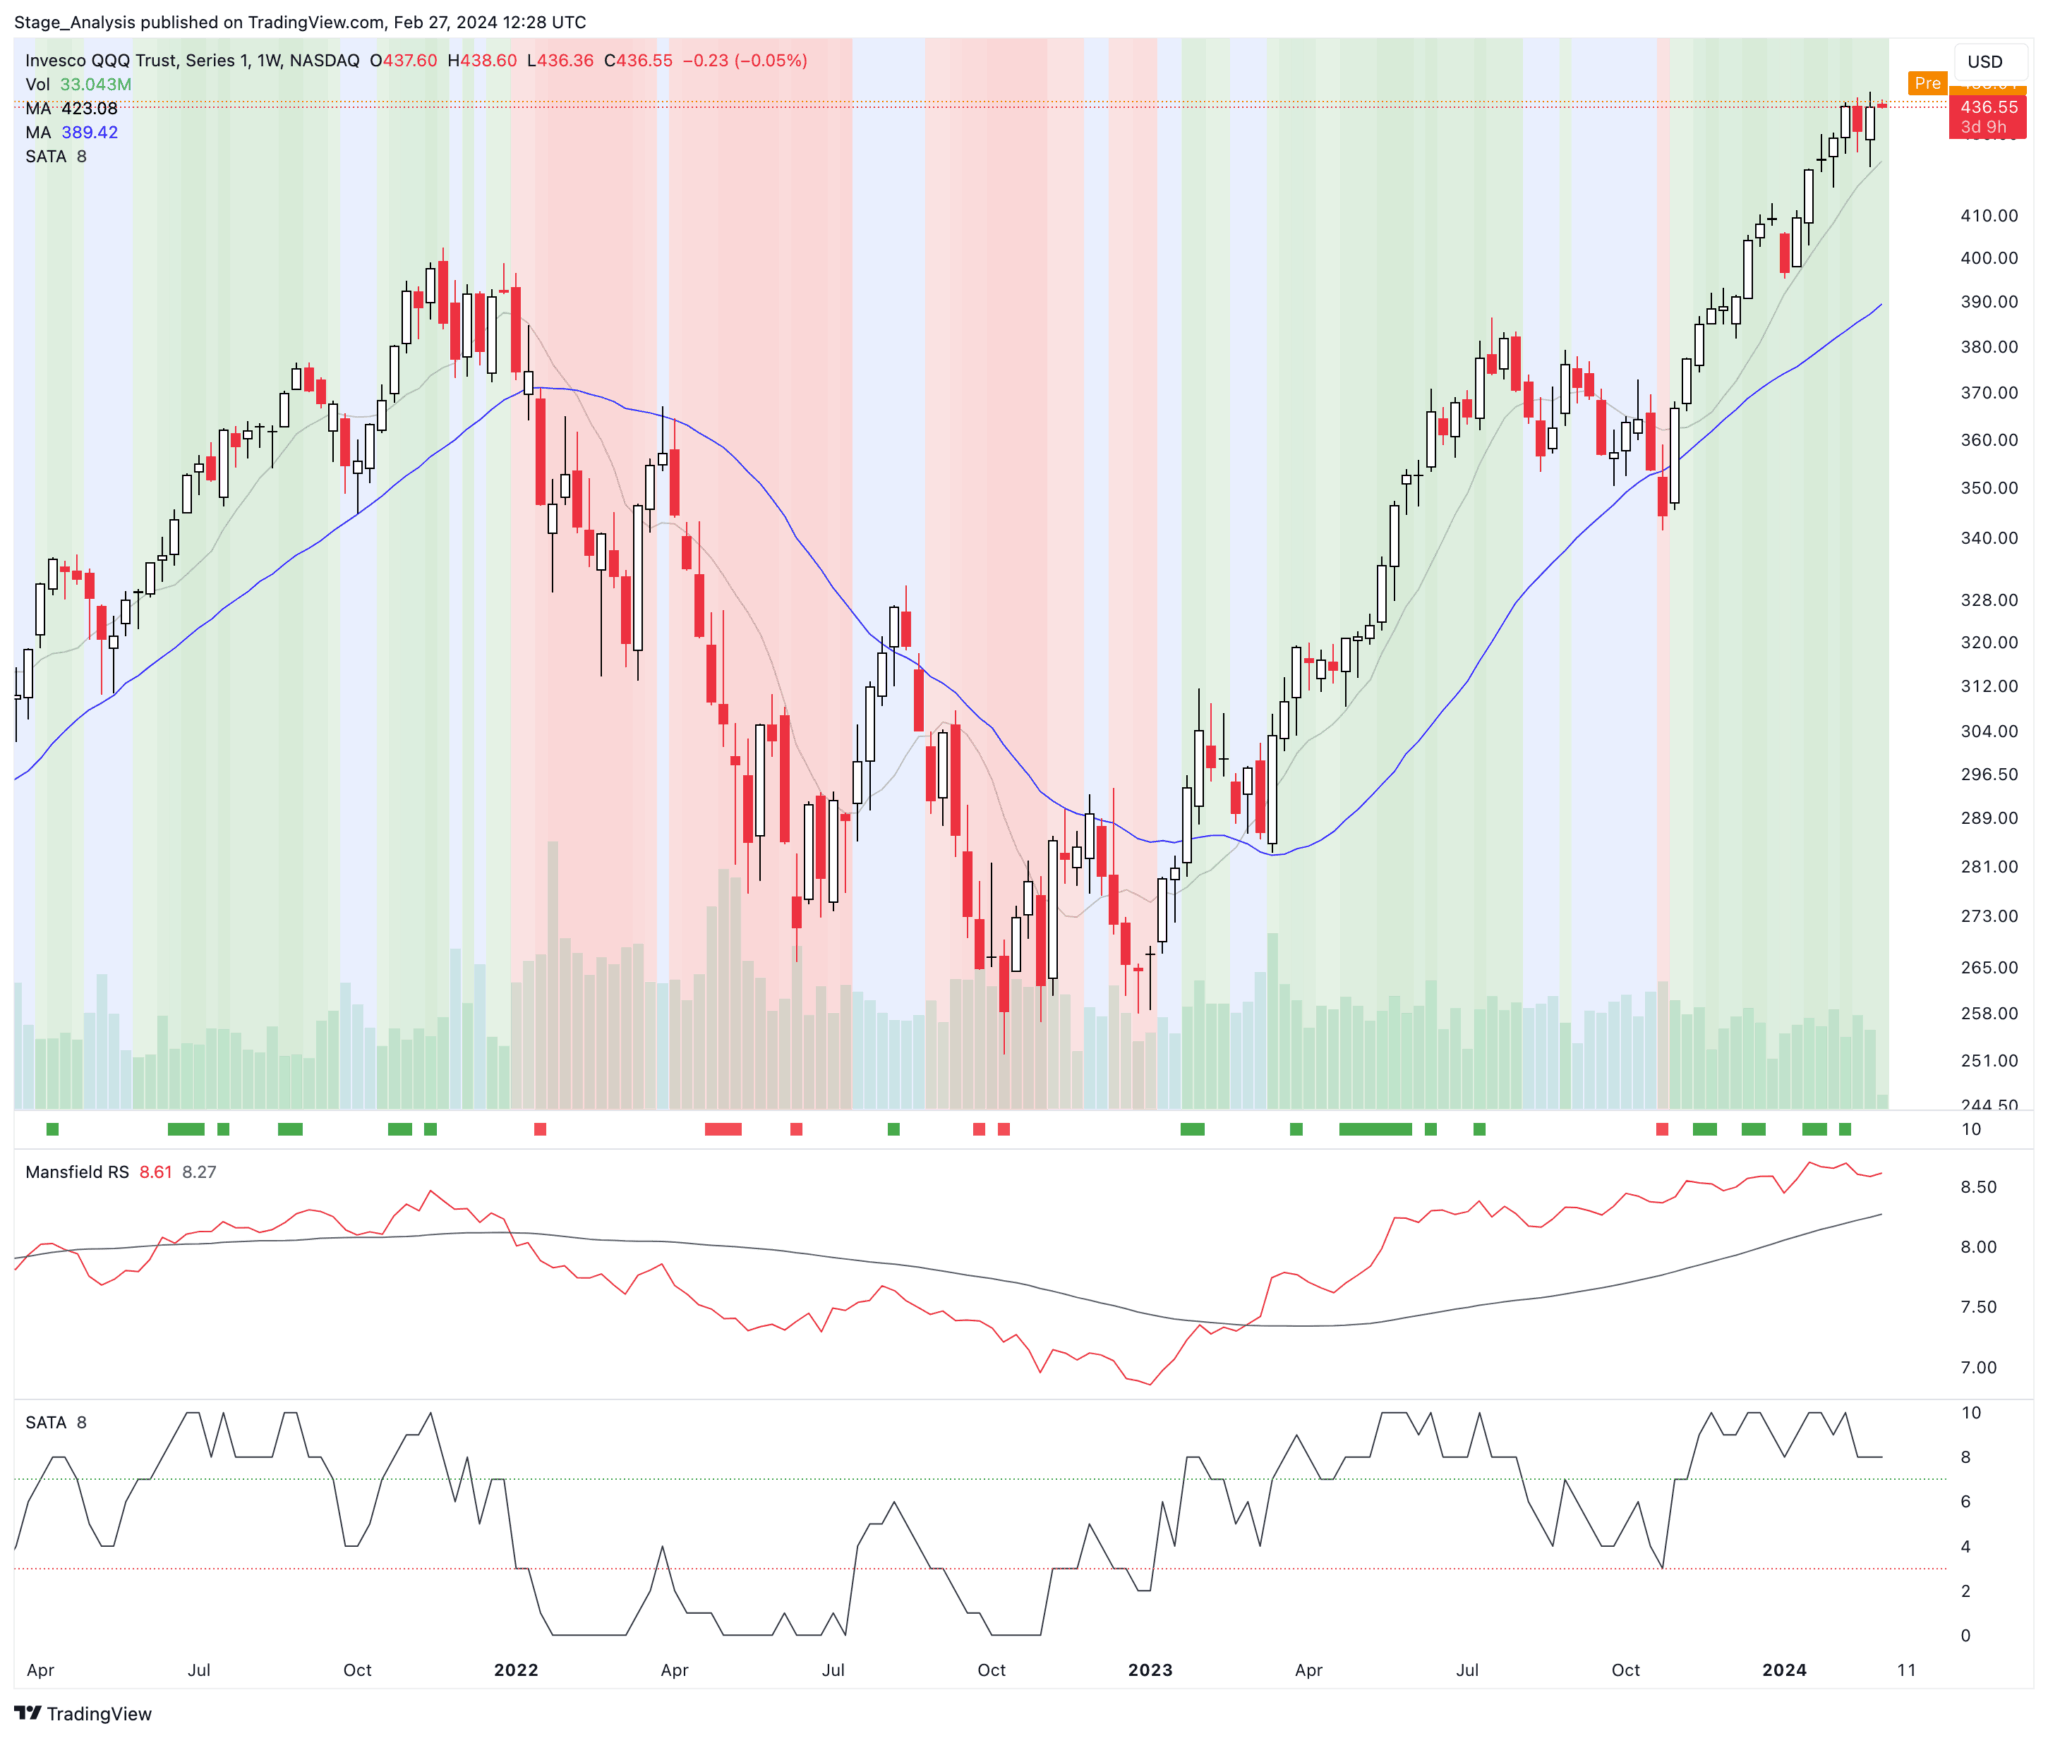
Nasdaq 100 (QQQ) SATA Scores:
Weekly SATA Score: 8 (Strong)
Daily SATA Score: 5 (Neutral)
Combined Score: 65% (Strong)
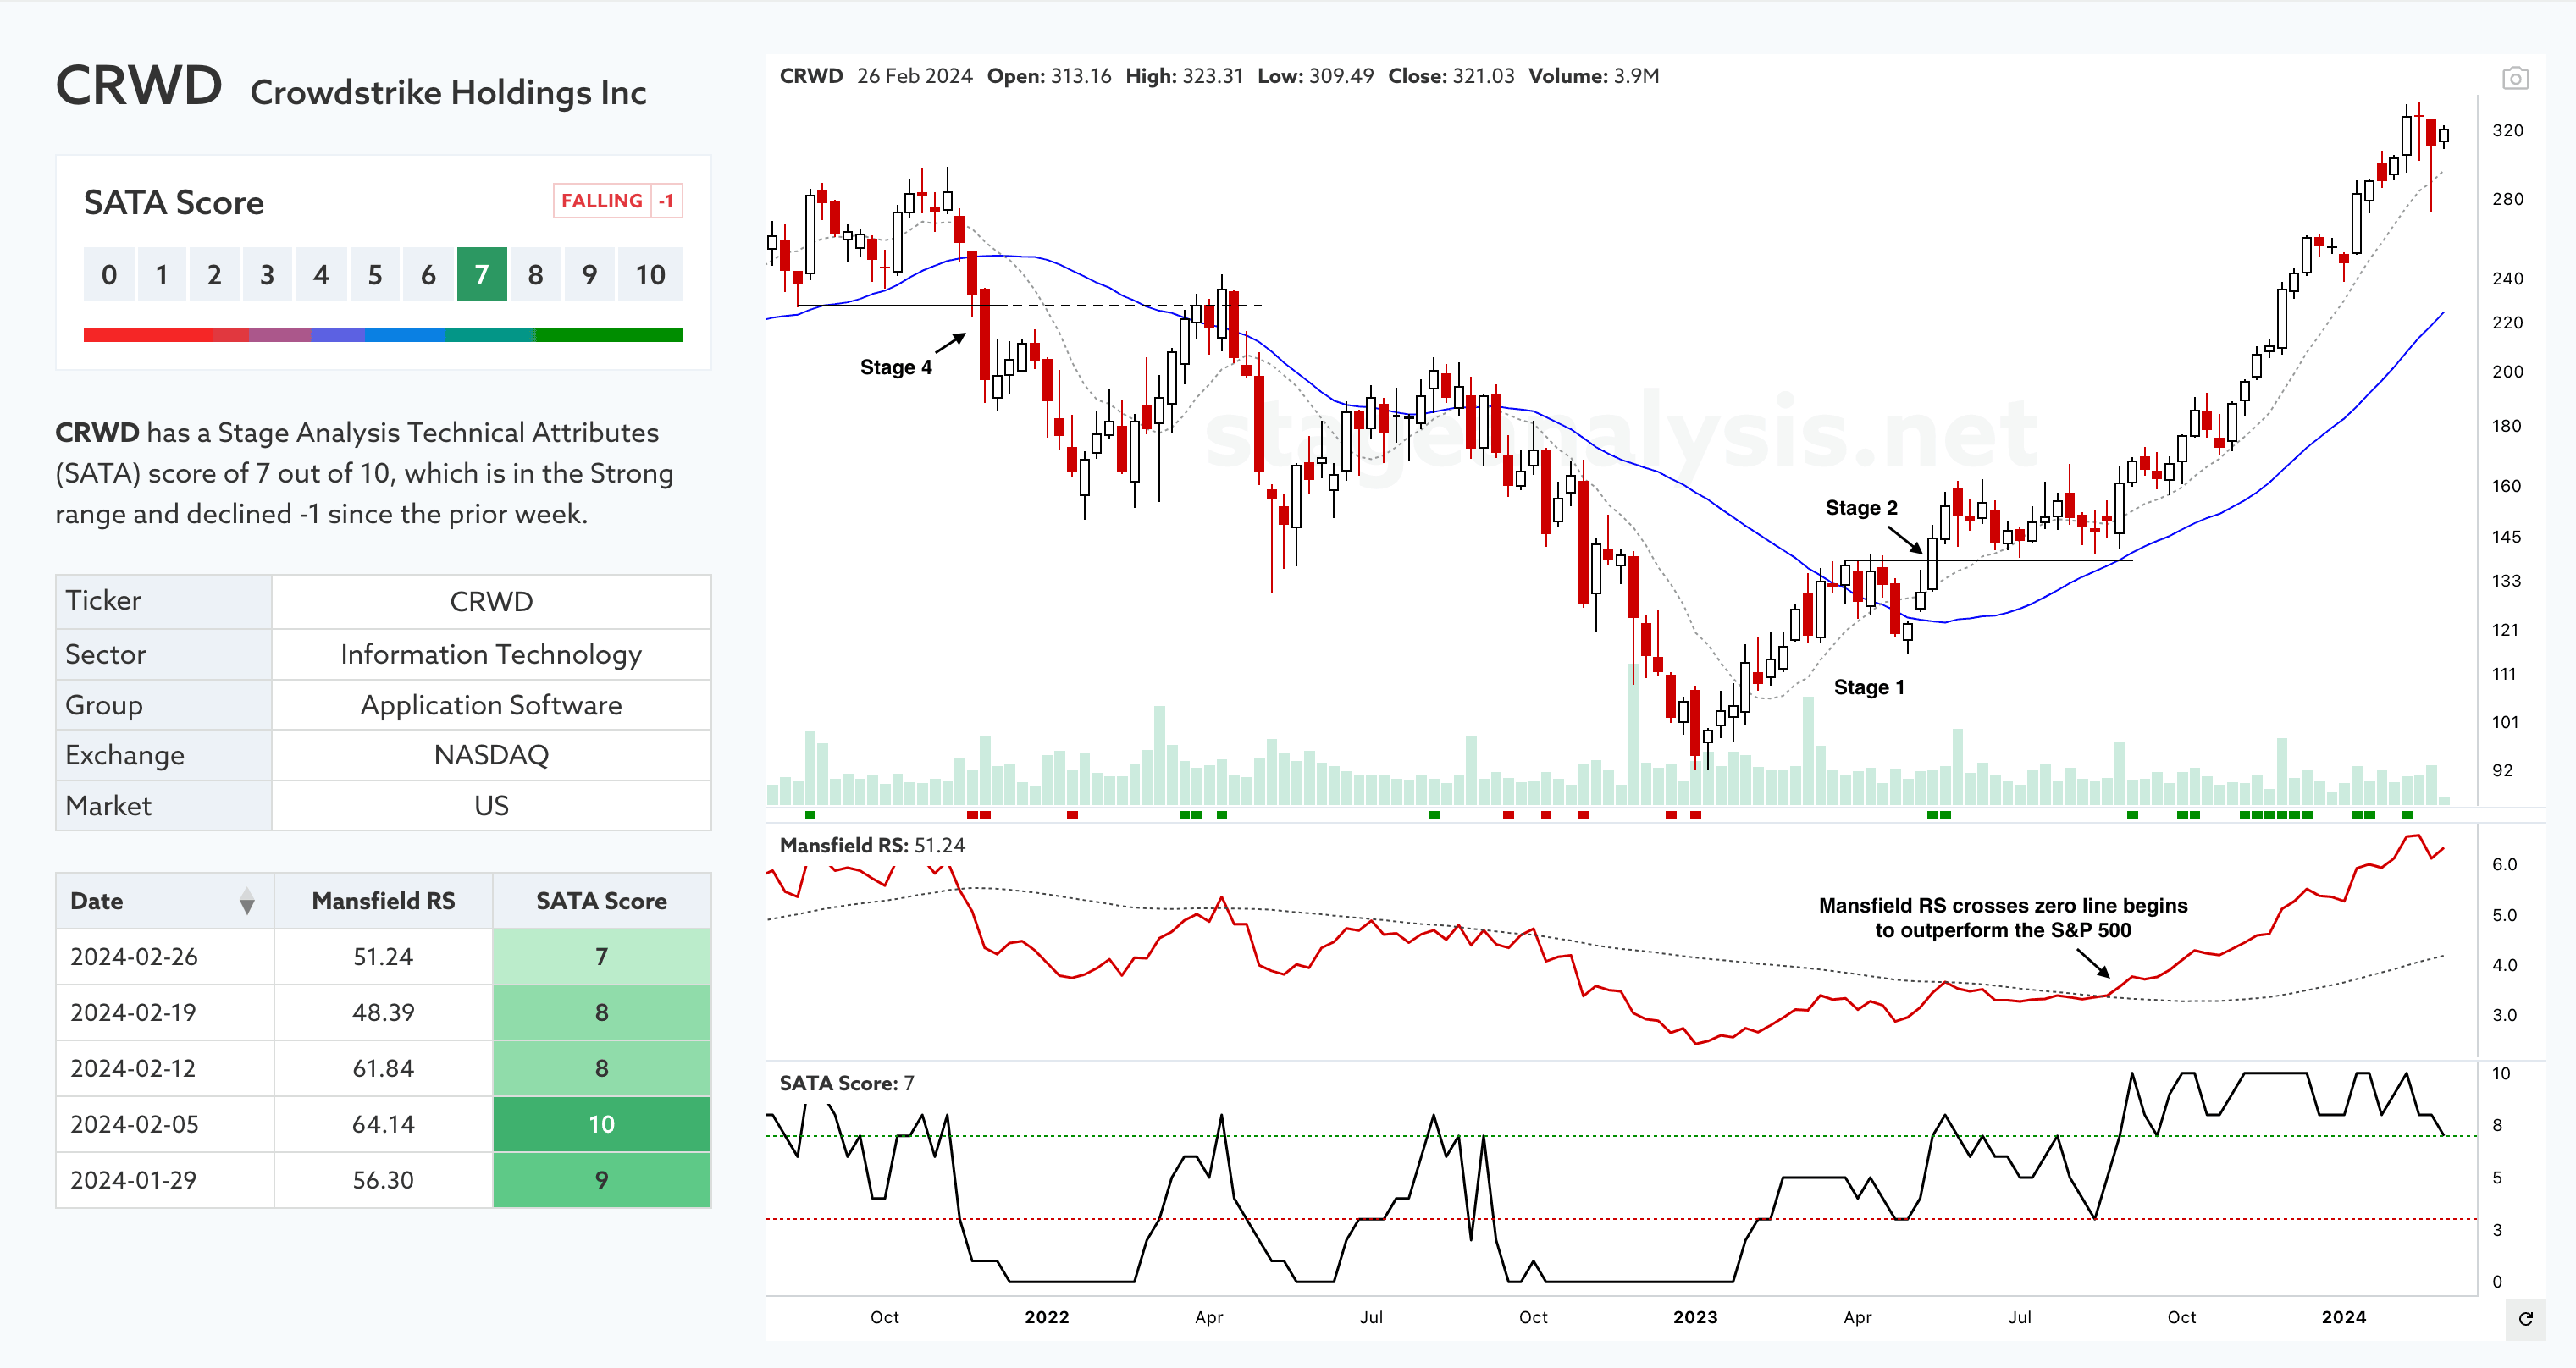
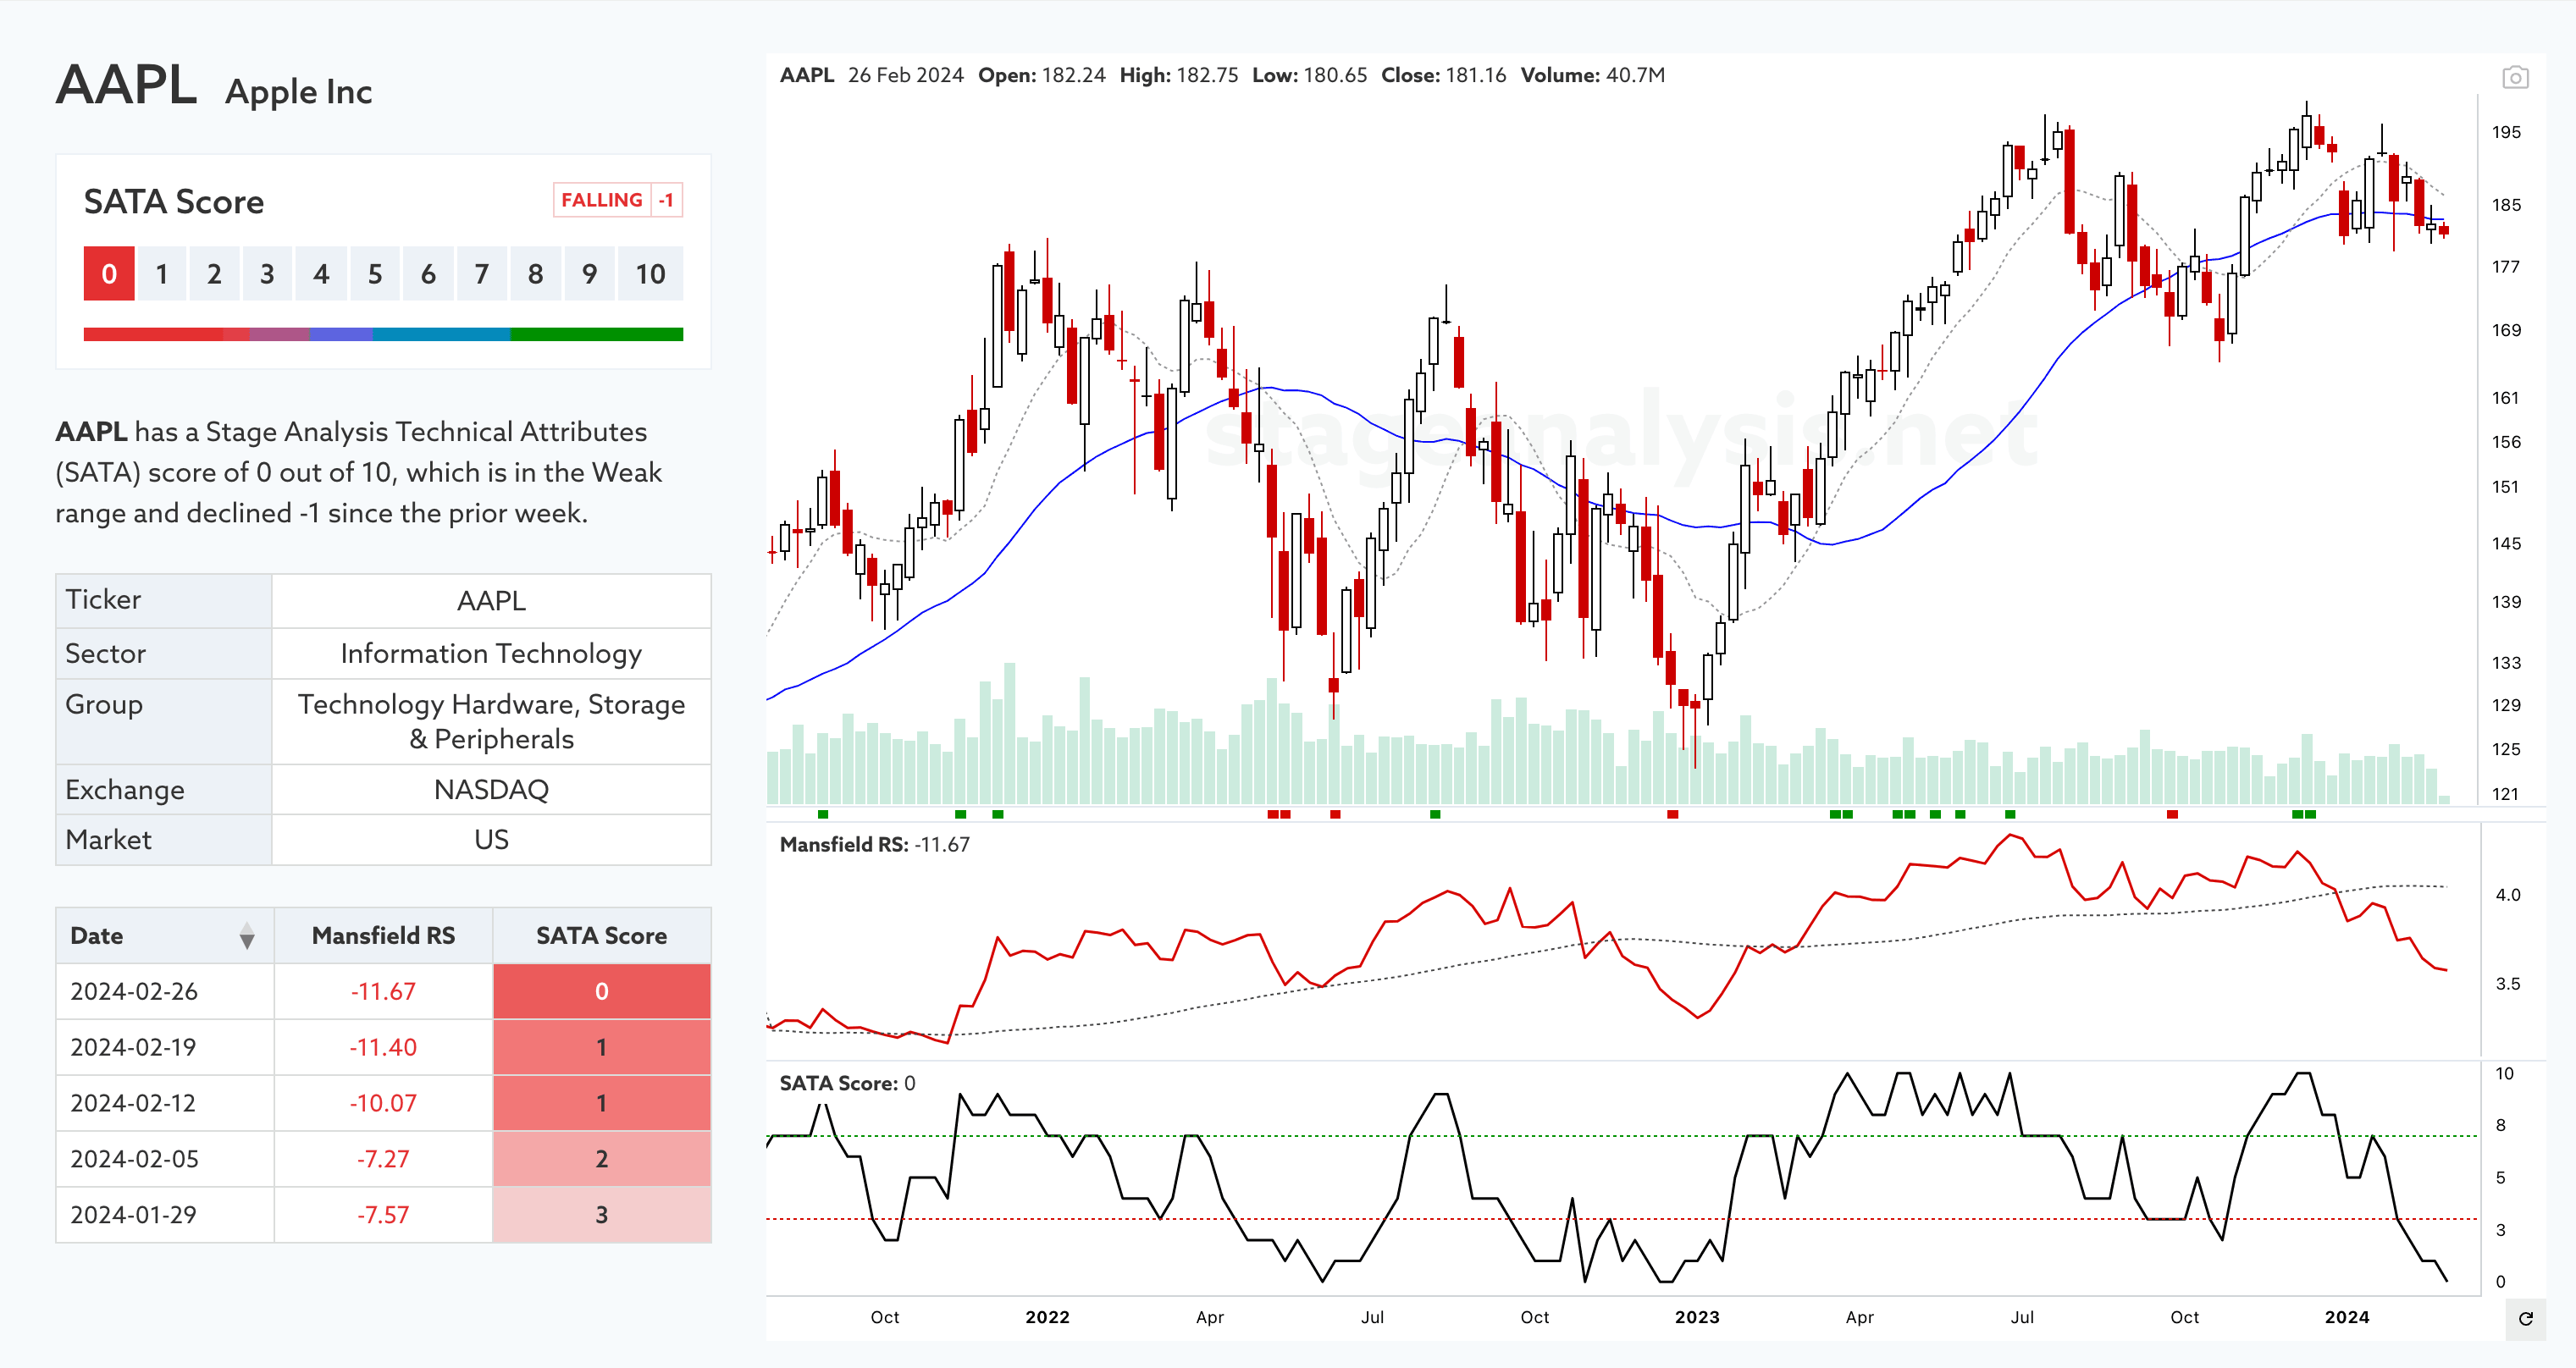
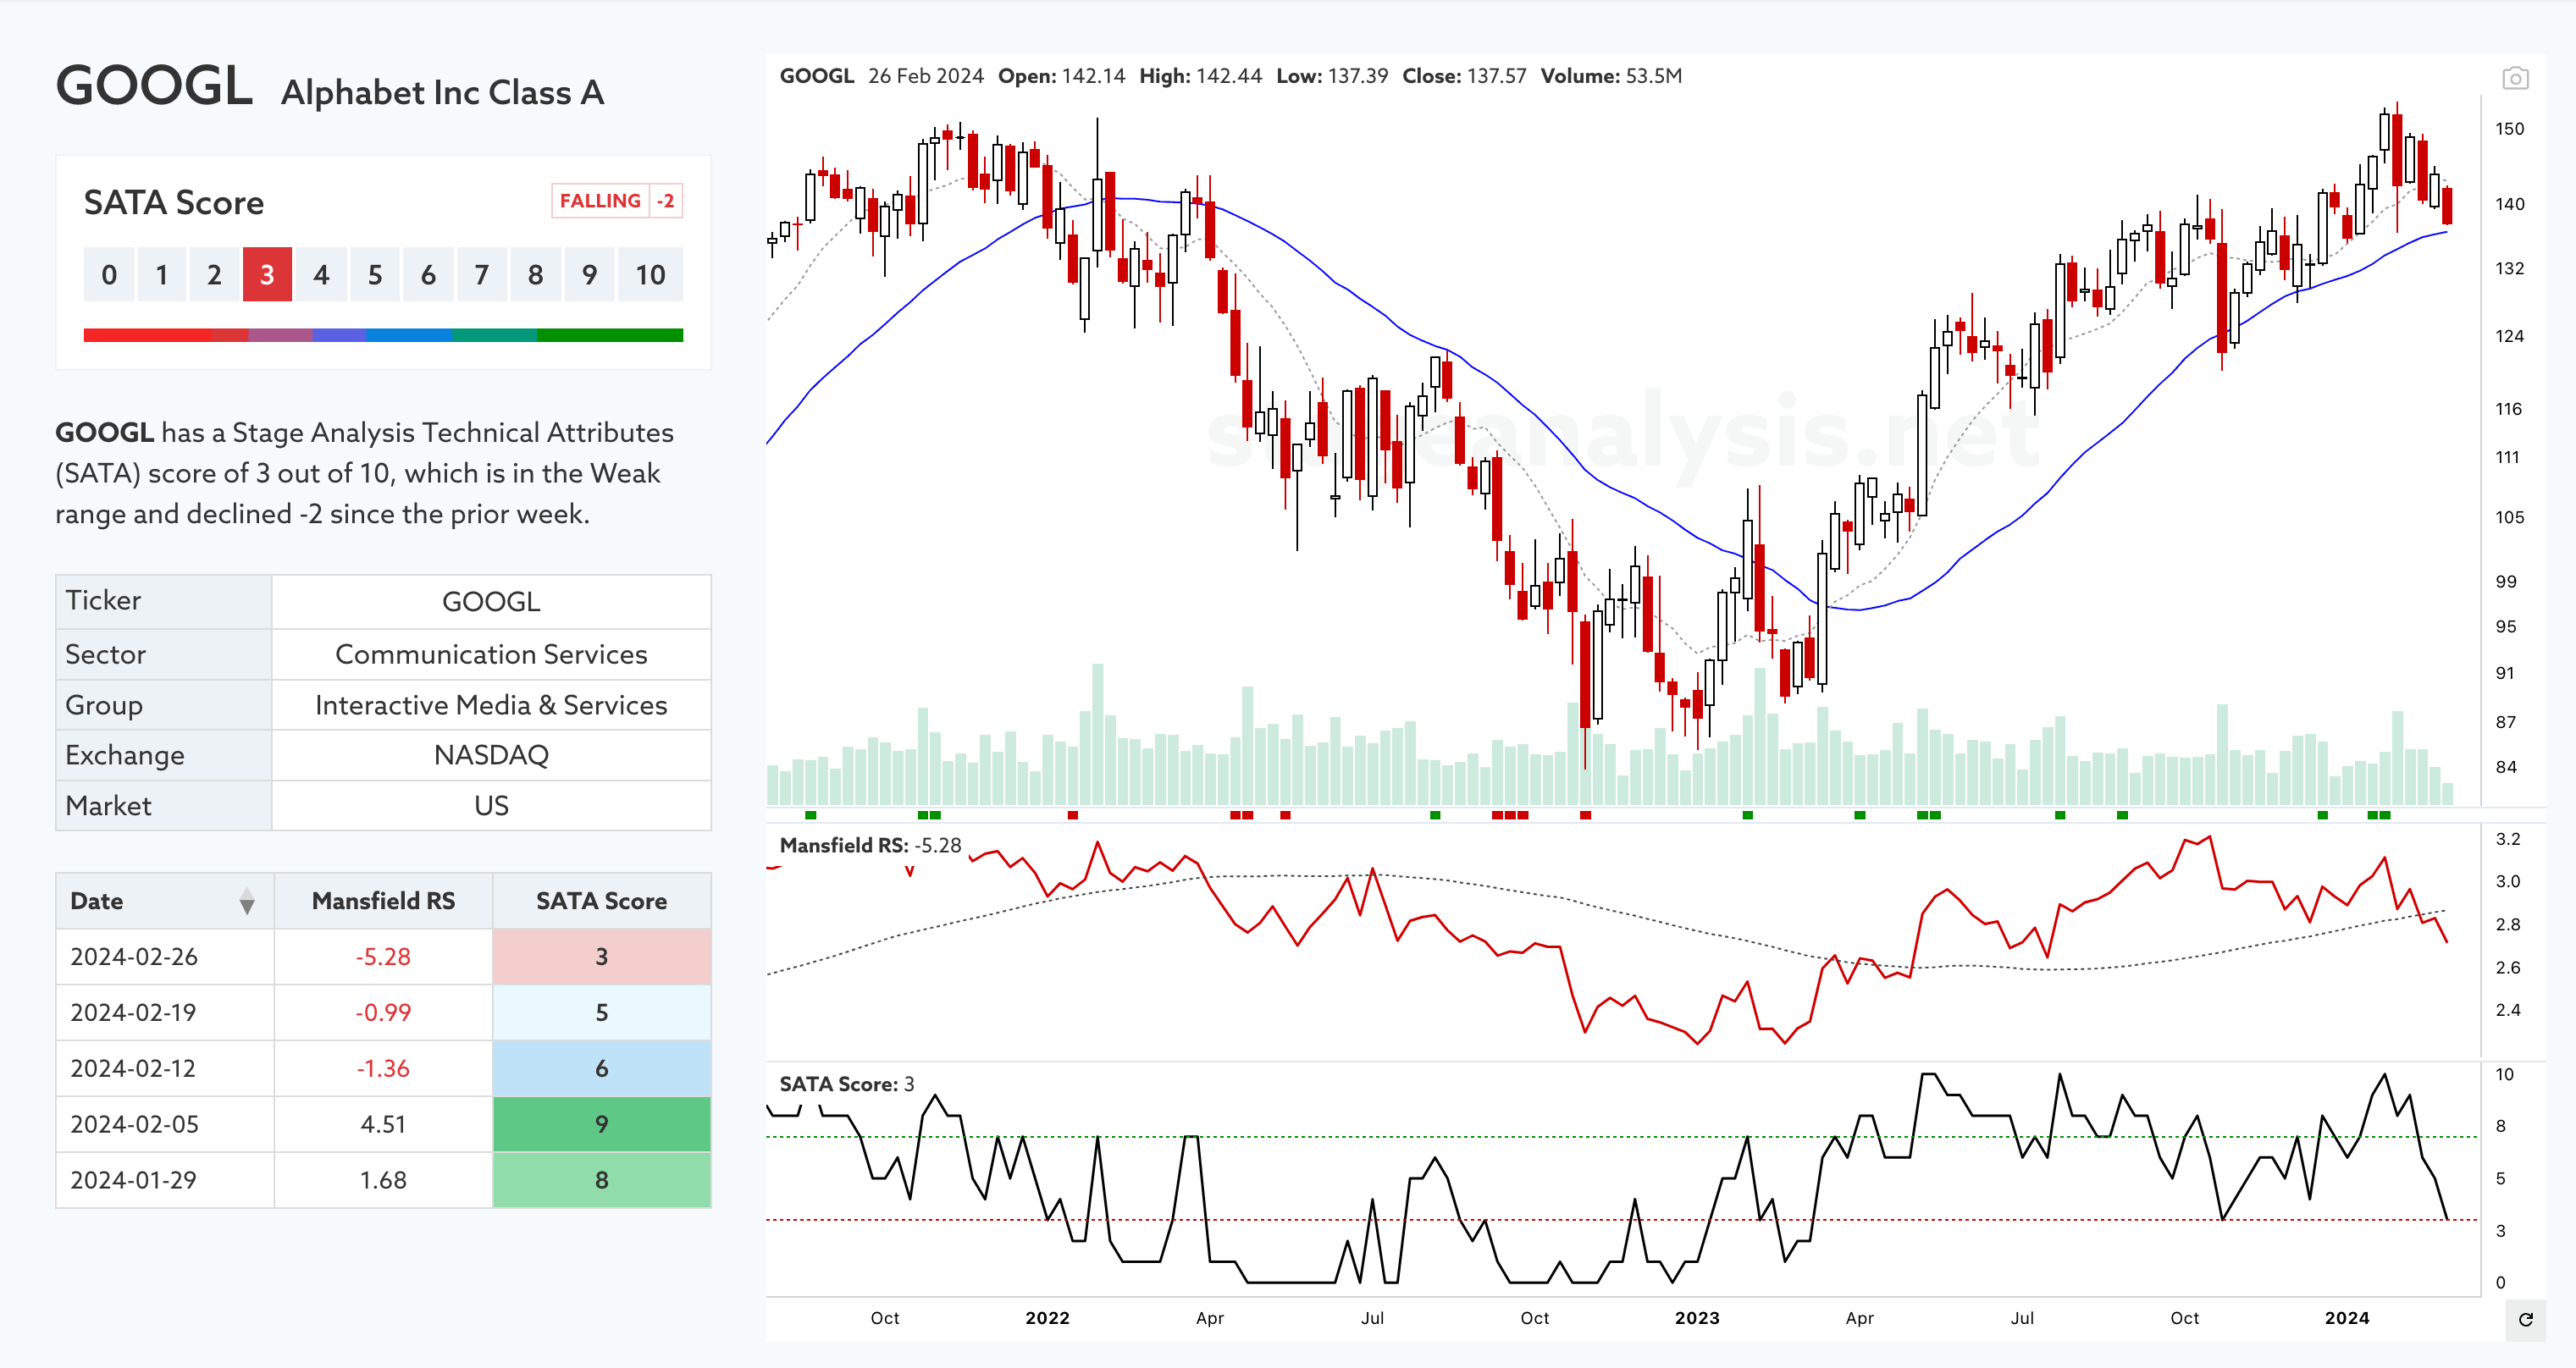
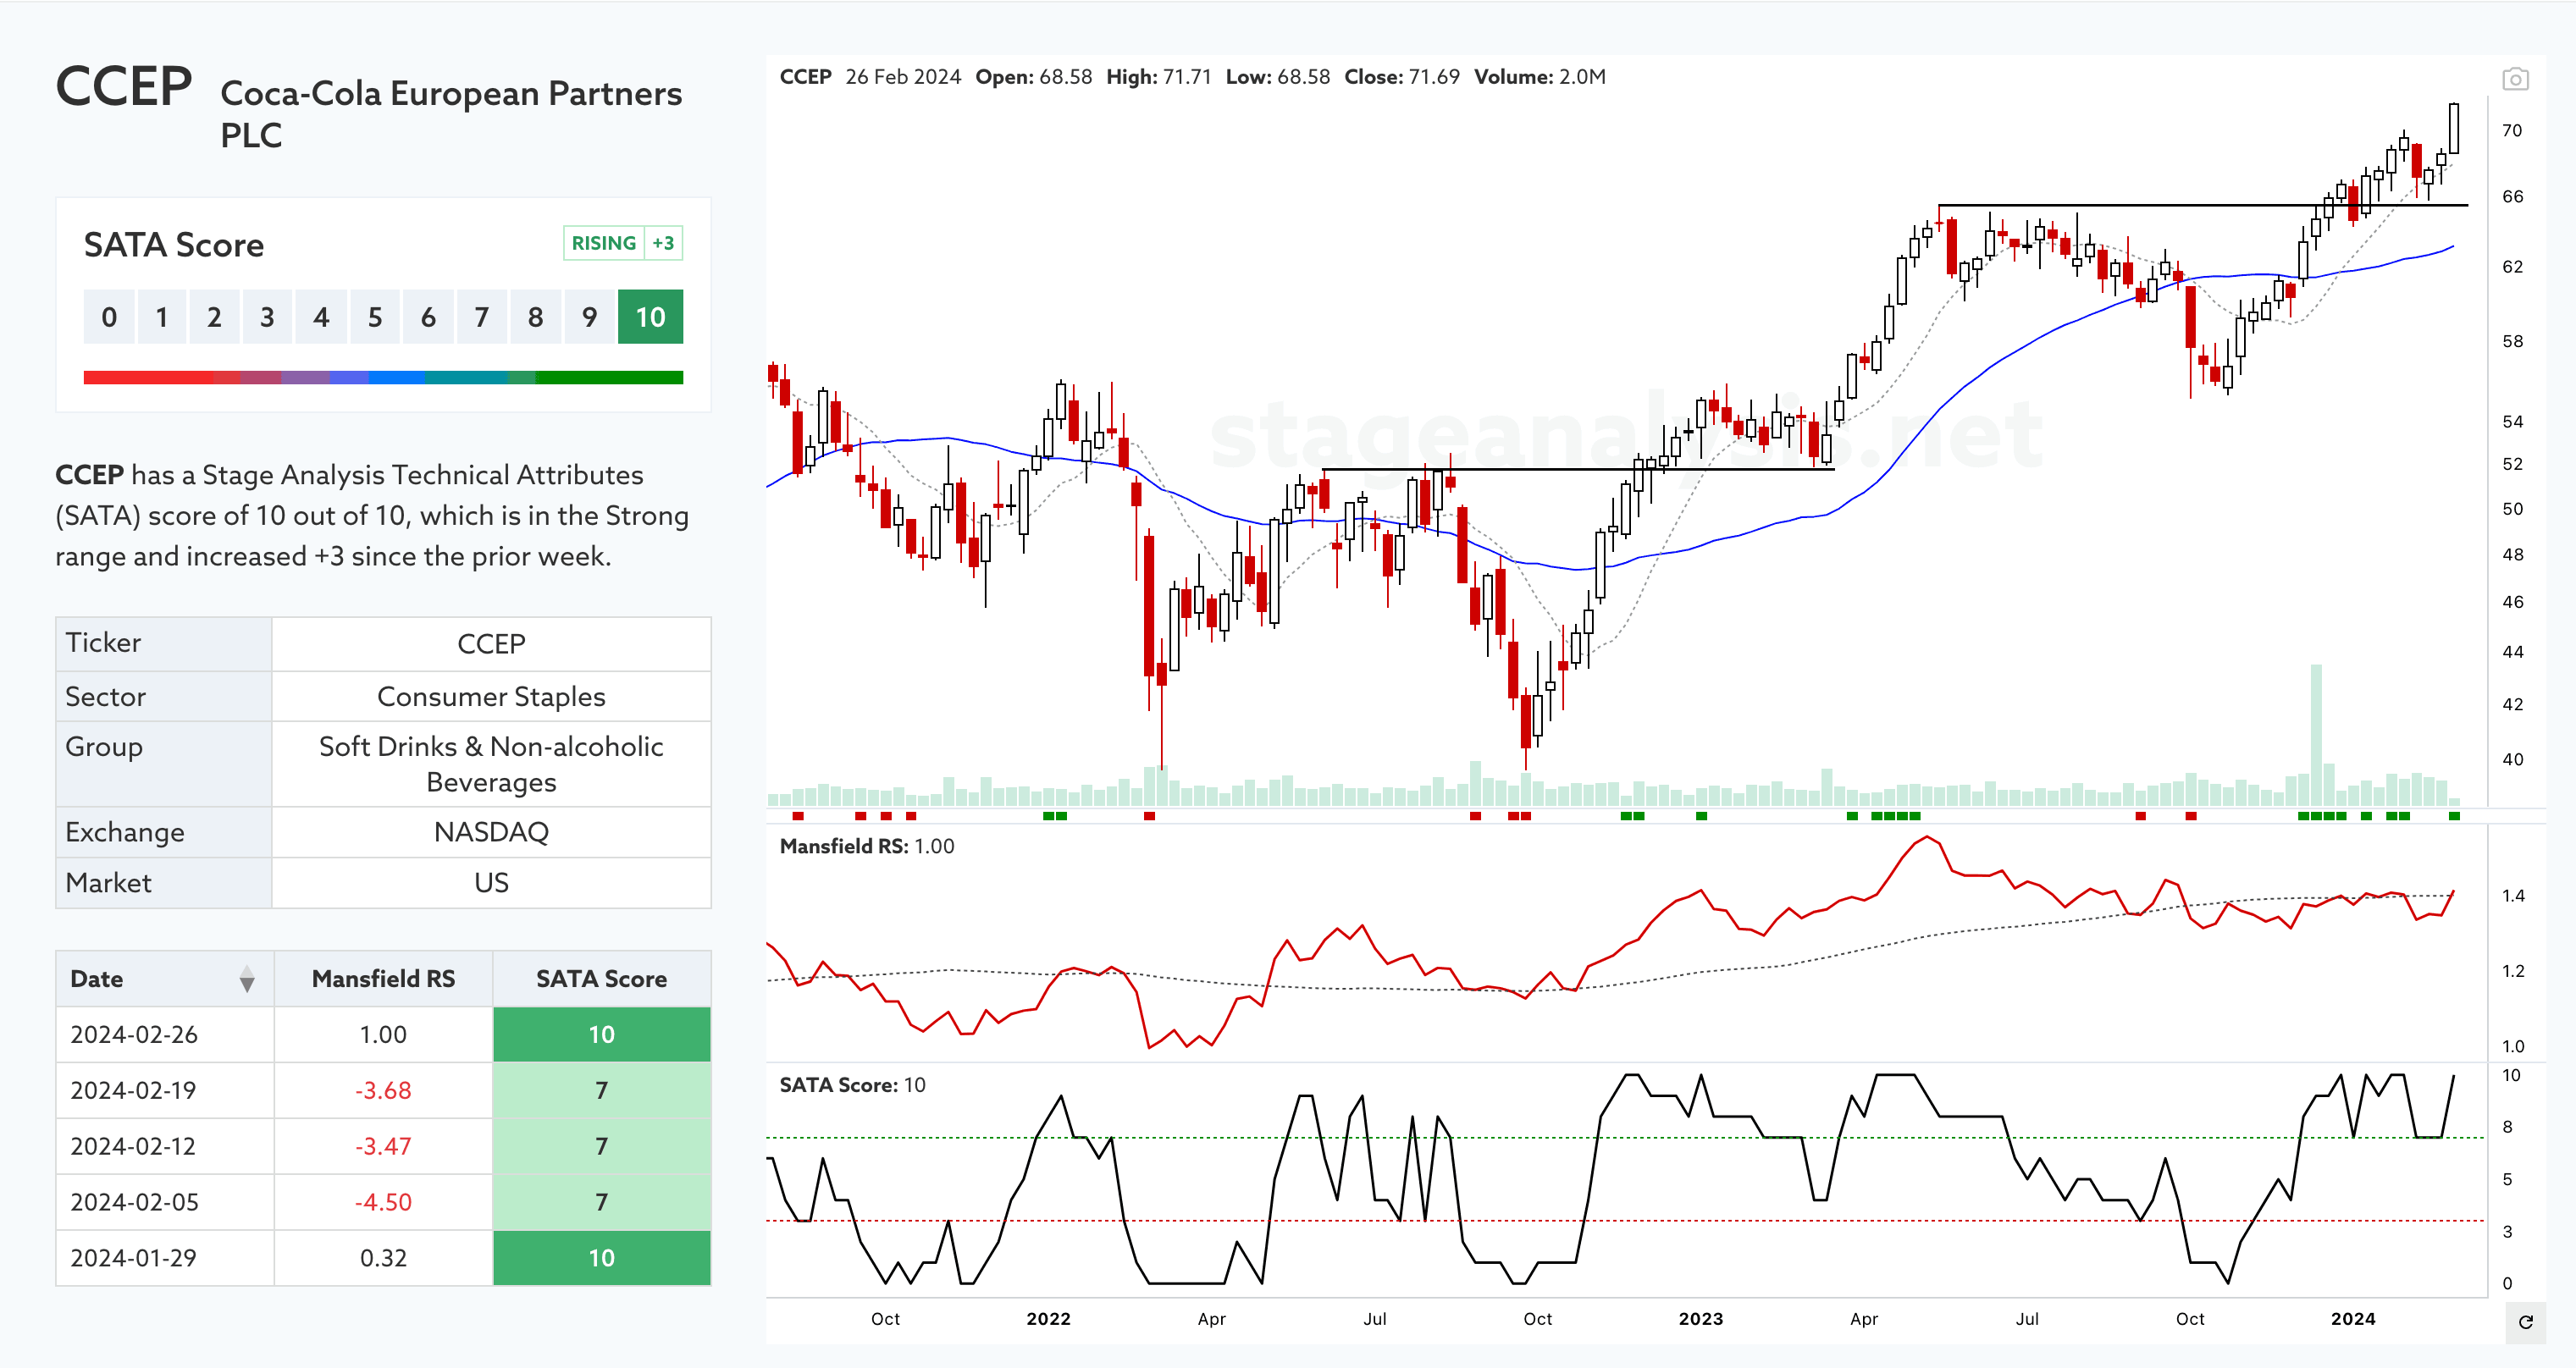
SATA Stock Pages (First Preview)
Below is a preview of the upcoming SATA stock pages on the Stage Analysis website (these are screenshots from the actual built pages).
Every stock in the NYSE & Nasdaq Composites will have a page where you can see the SATA data, Relative Strength and the weekly and Daily SATA charts, and these will be updated each day 1 hour after the close.
Currently its only the Nasdaq 100 stocks, while we do bug testing on the data and charts, but that will be quickly expanded in the coming weeks to cover the whole US market, and then the Screener too.
So we hope you like it, and are excited to finally get the SATA Tool up and running after more than a year of development, as it's been a stressful process.
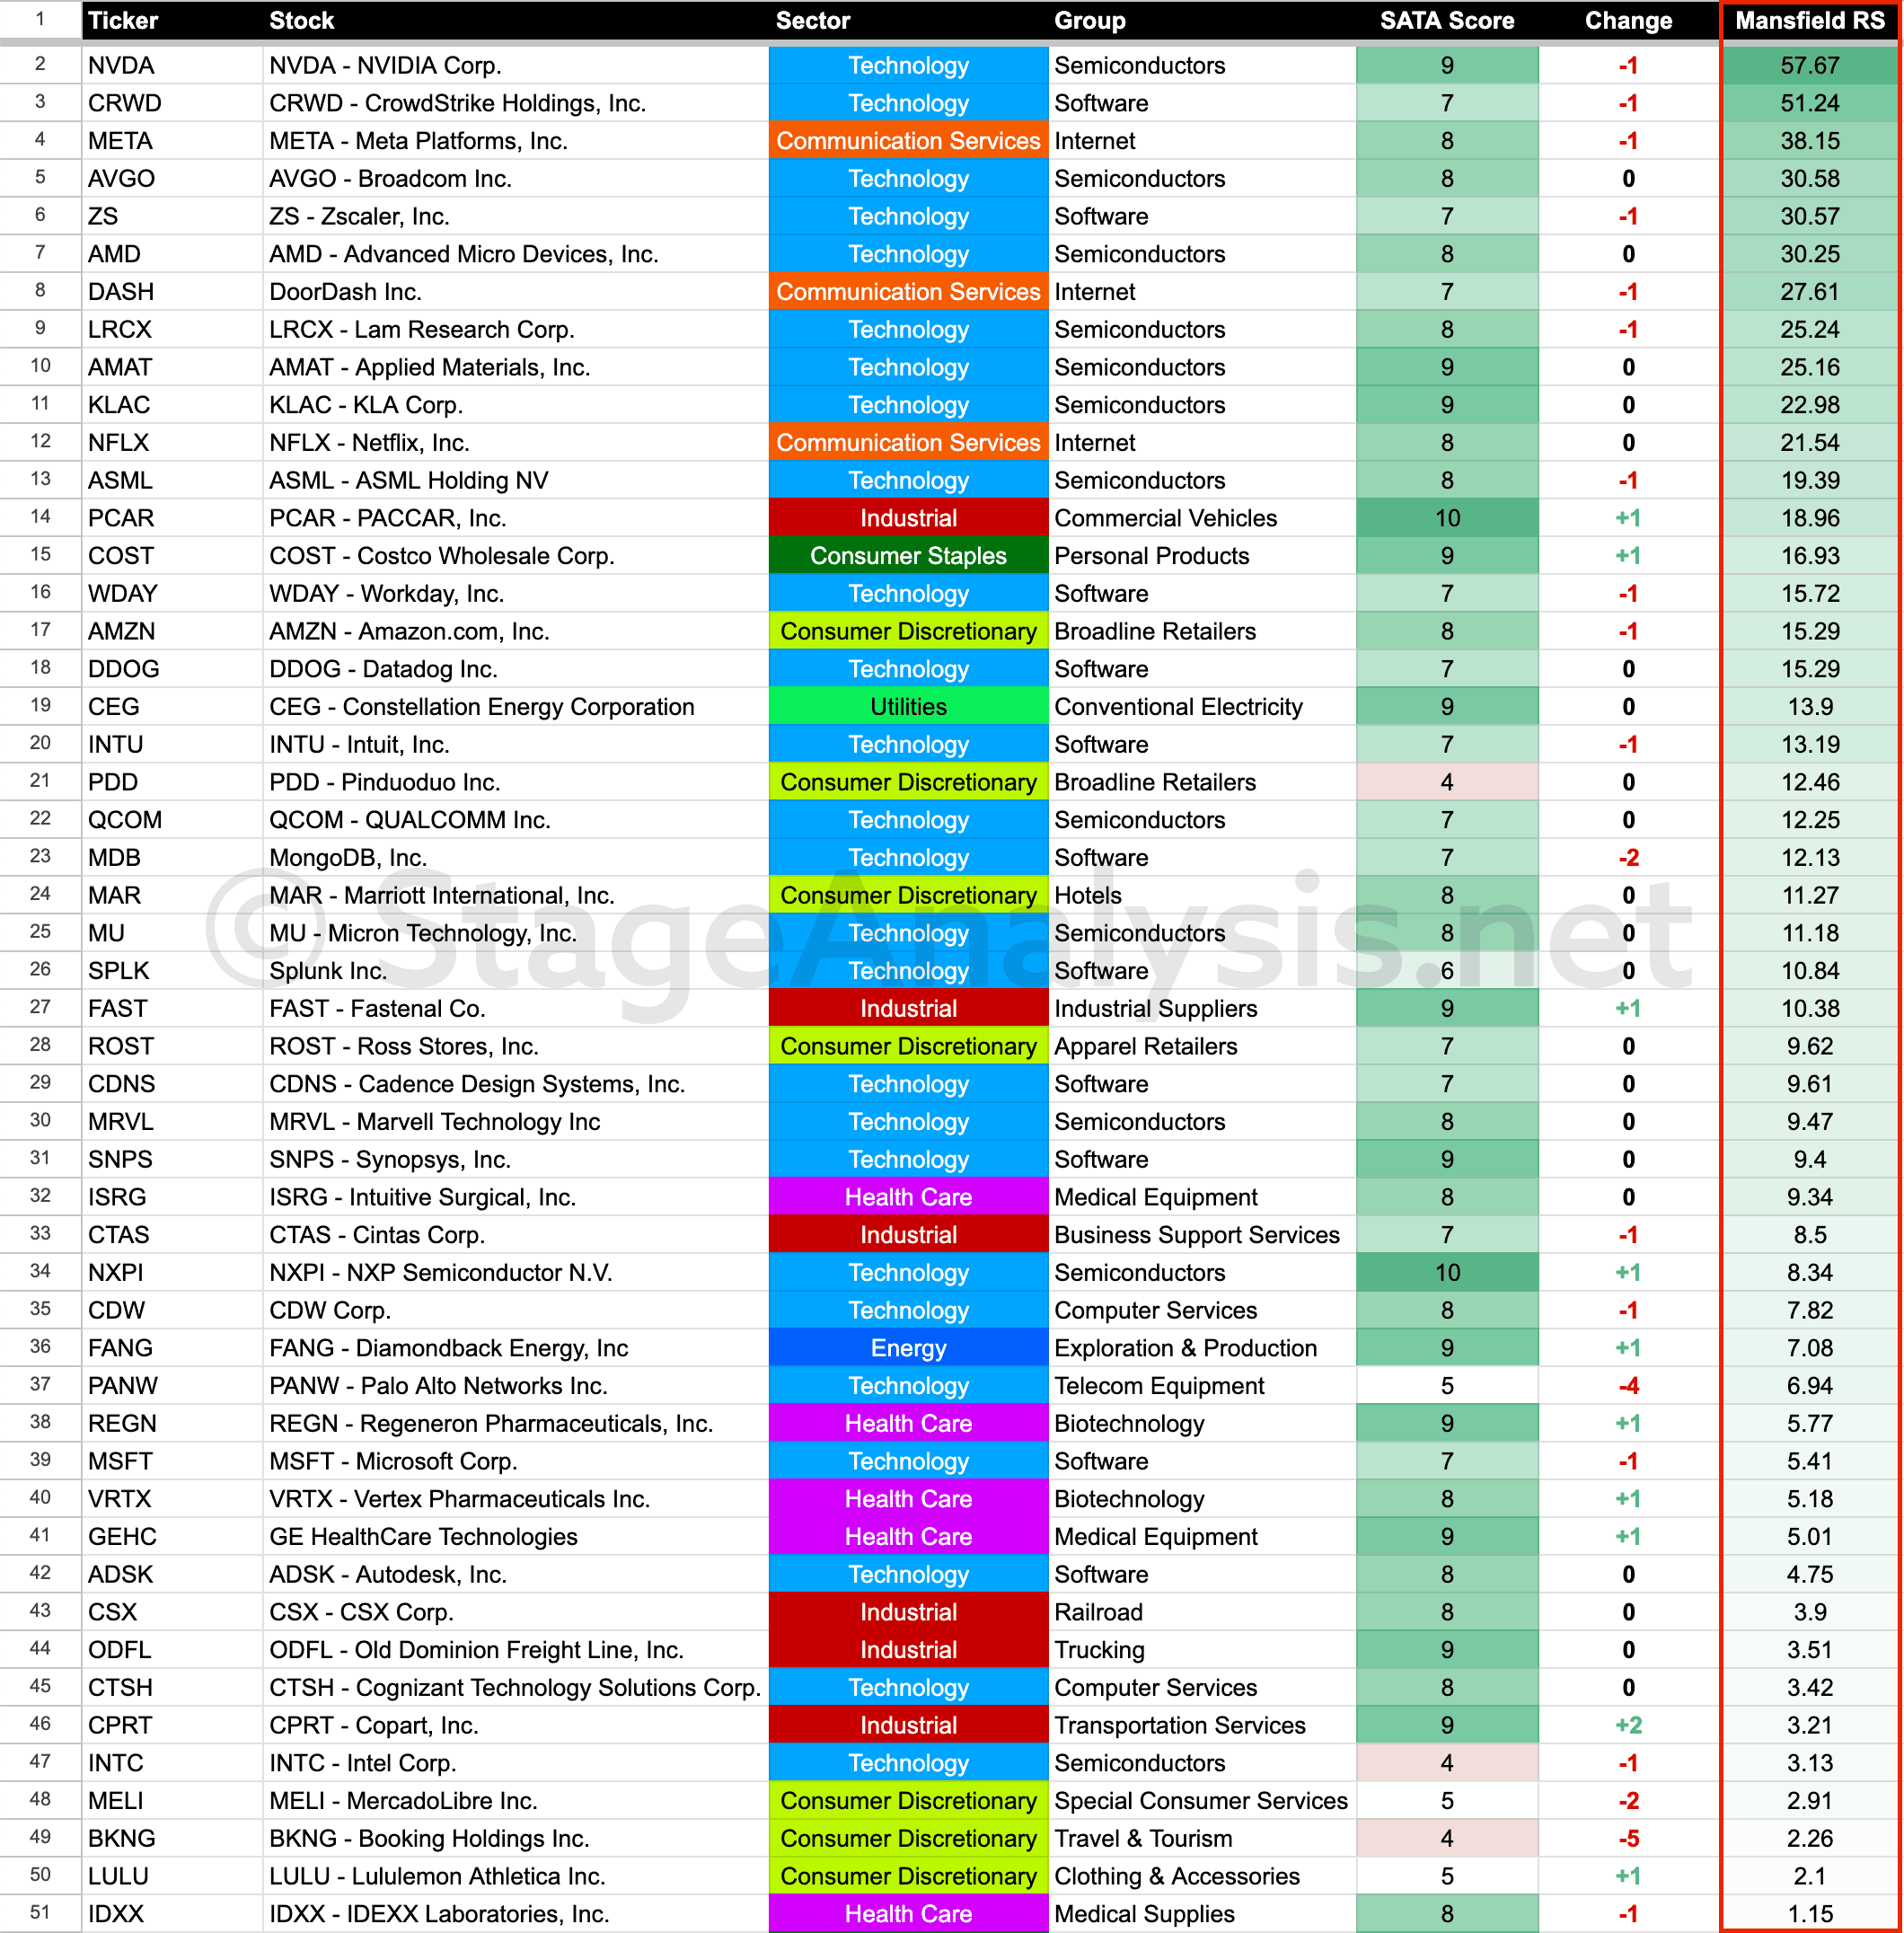
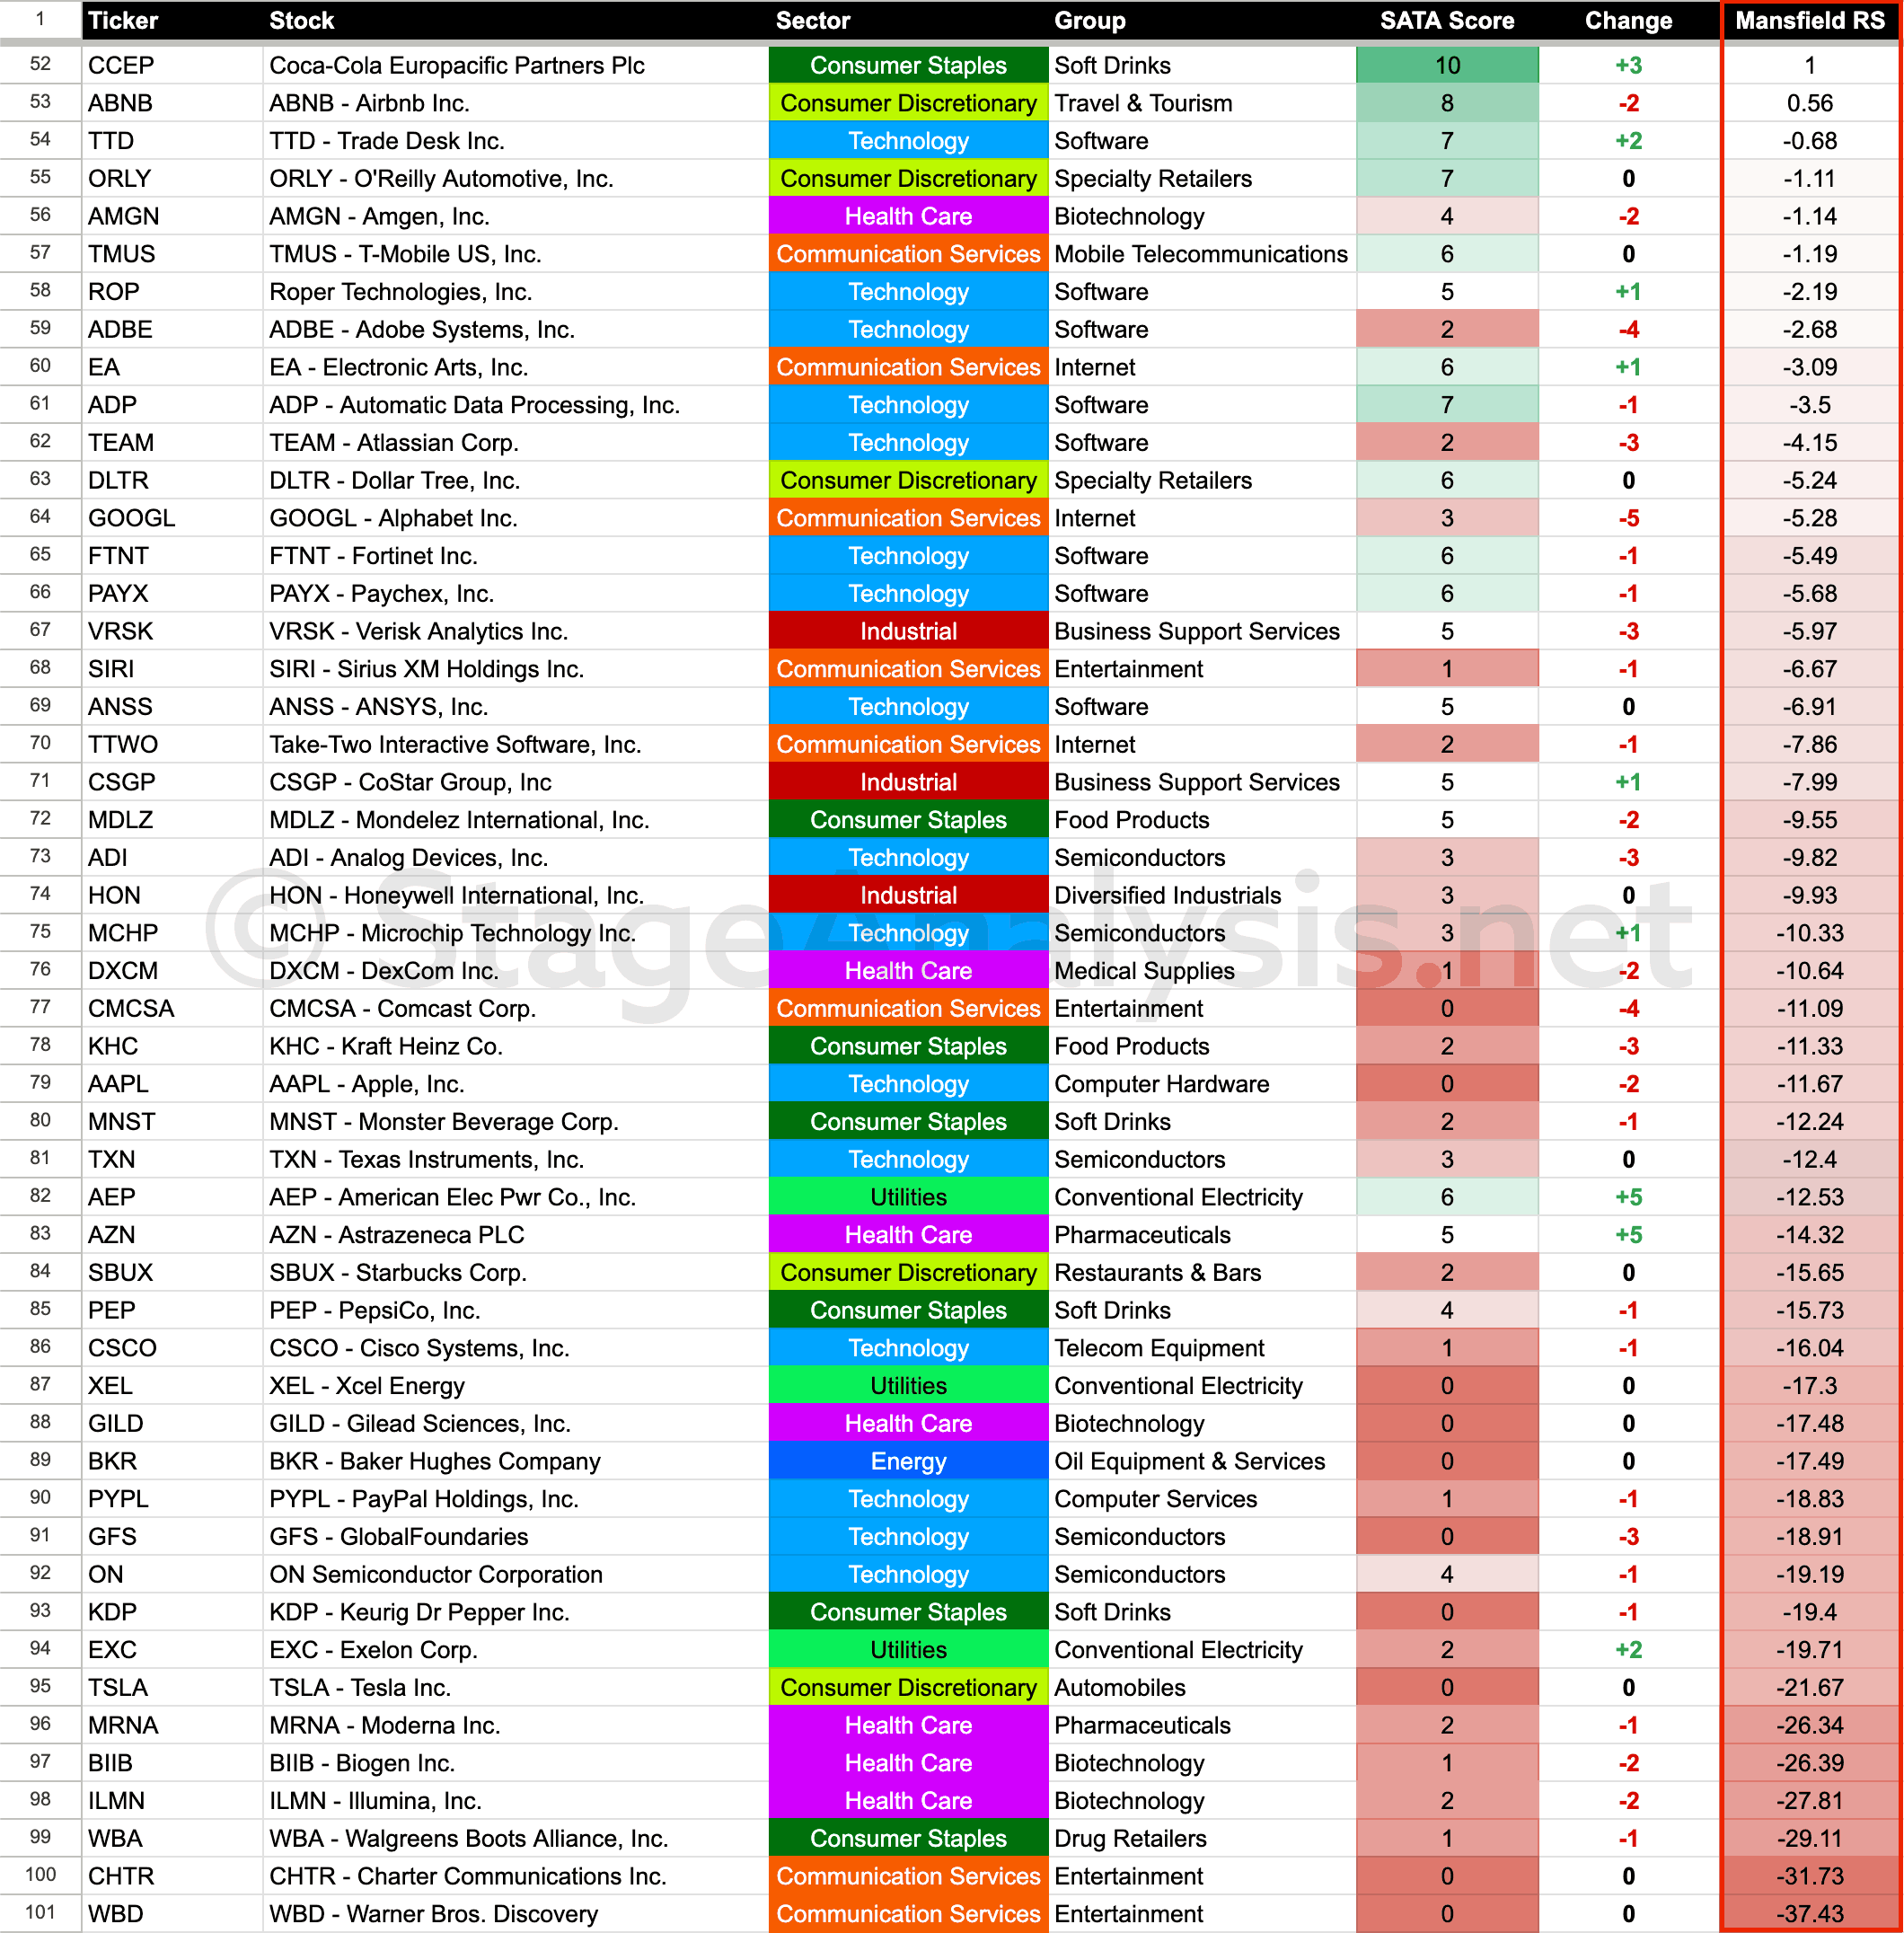
Ordered by Mansfield Relative Strength (RS) Score
The below table shows the Nasdaq 100 stocks ordered by relative strength using the Mansfield Relative Strength score.
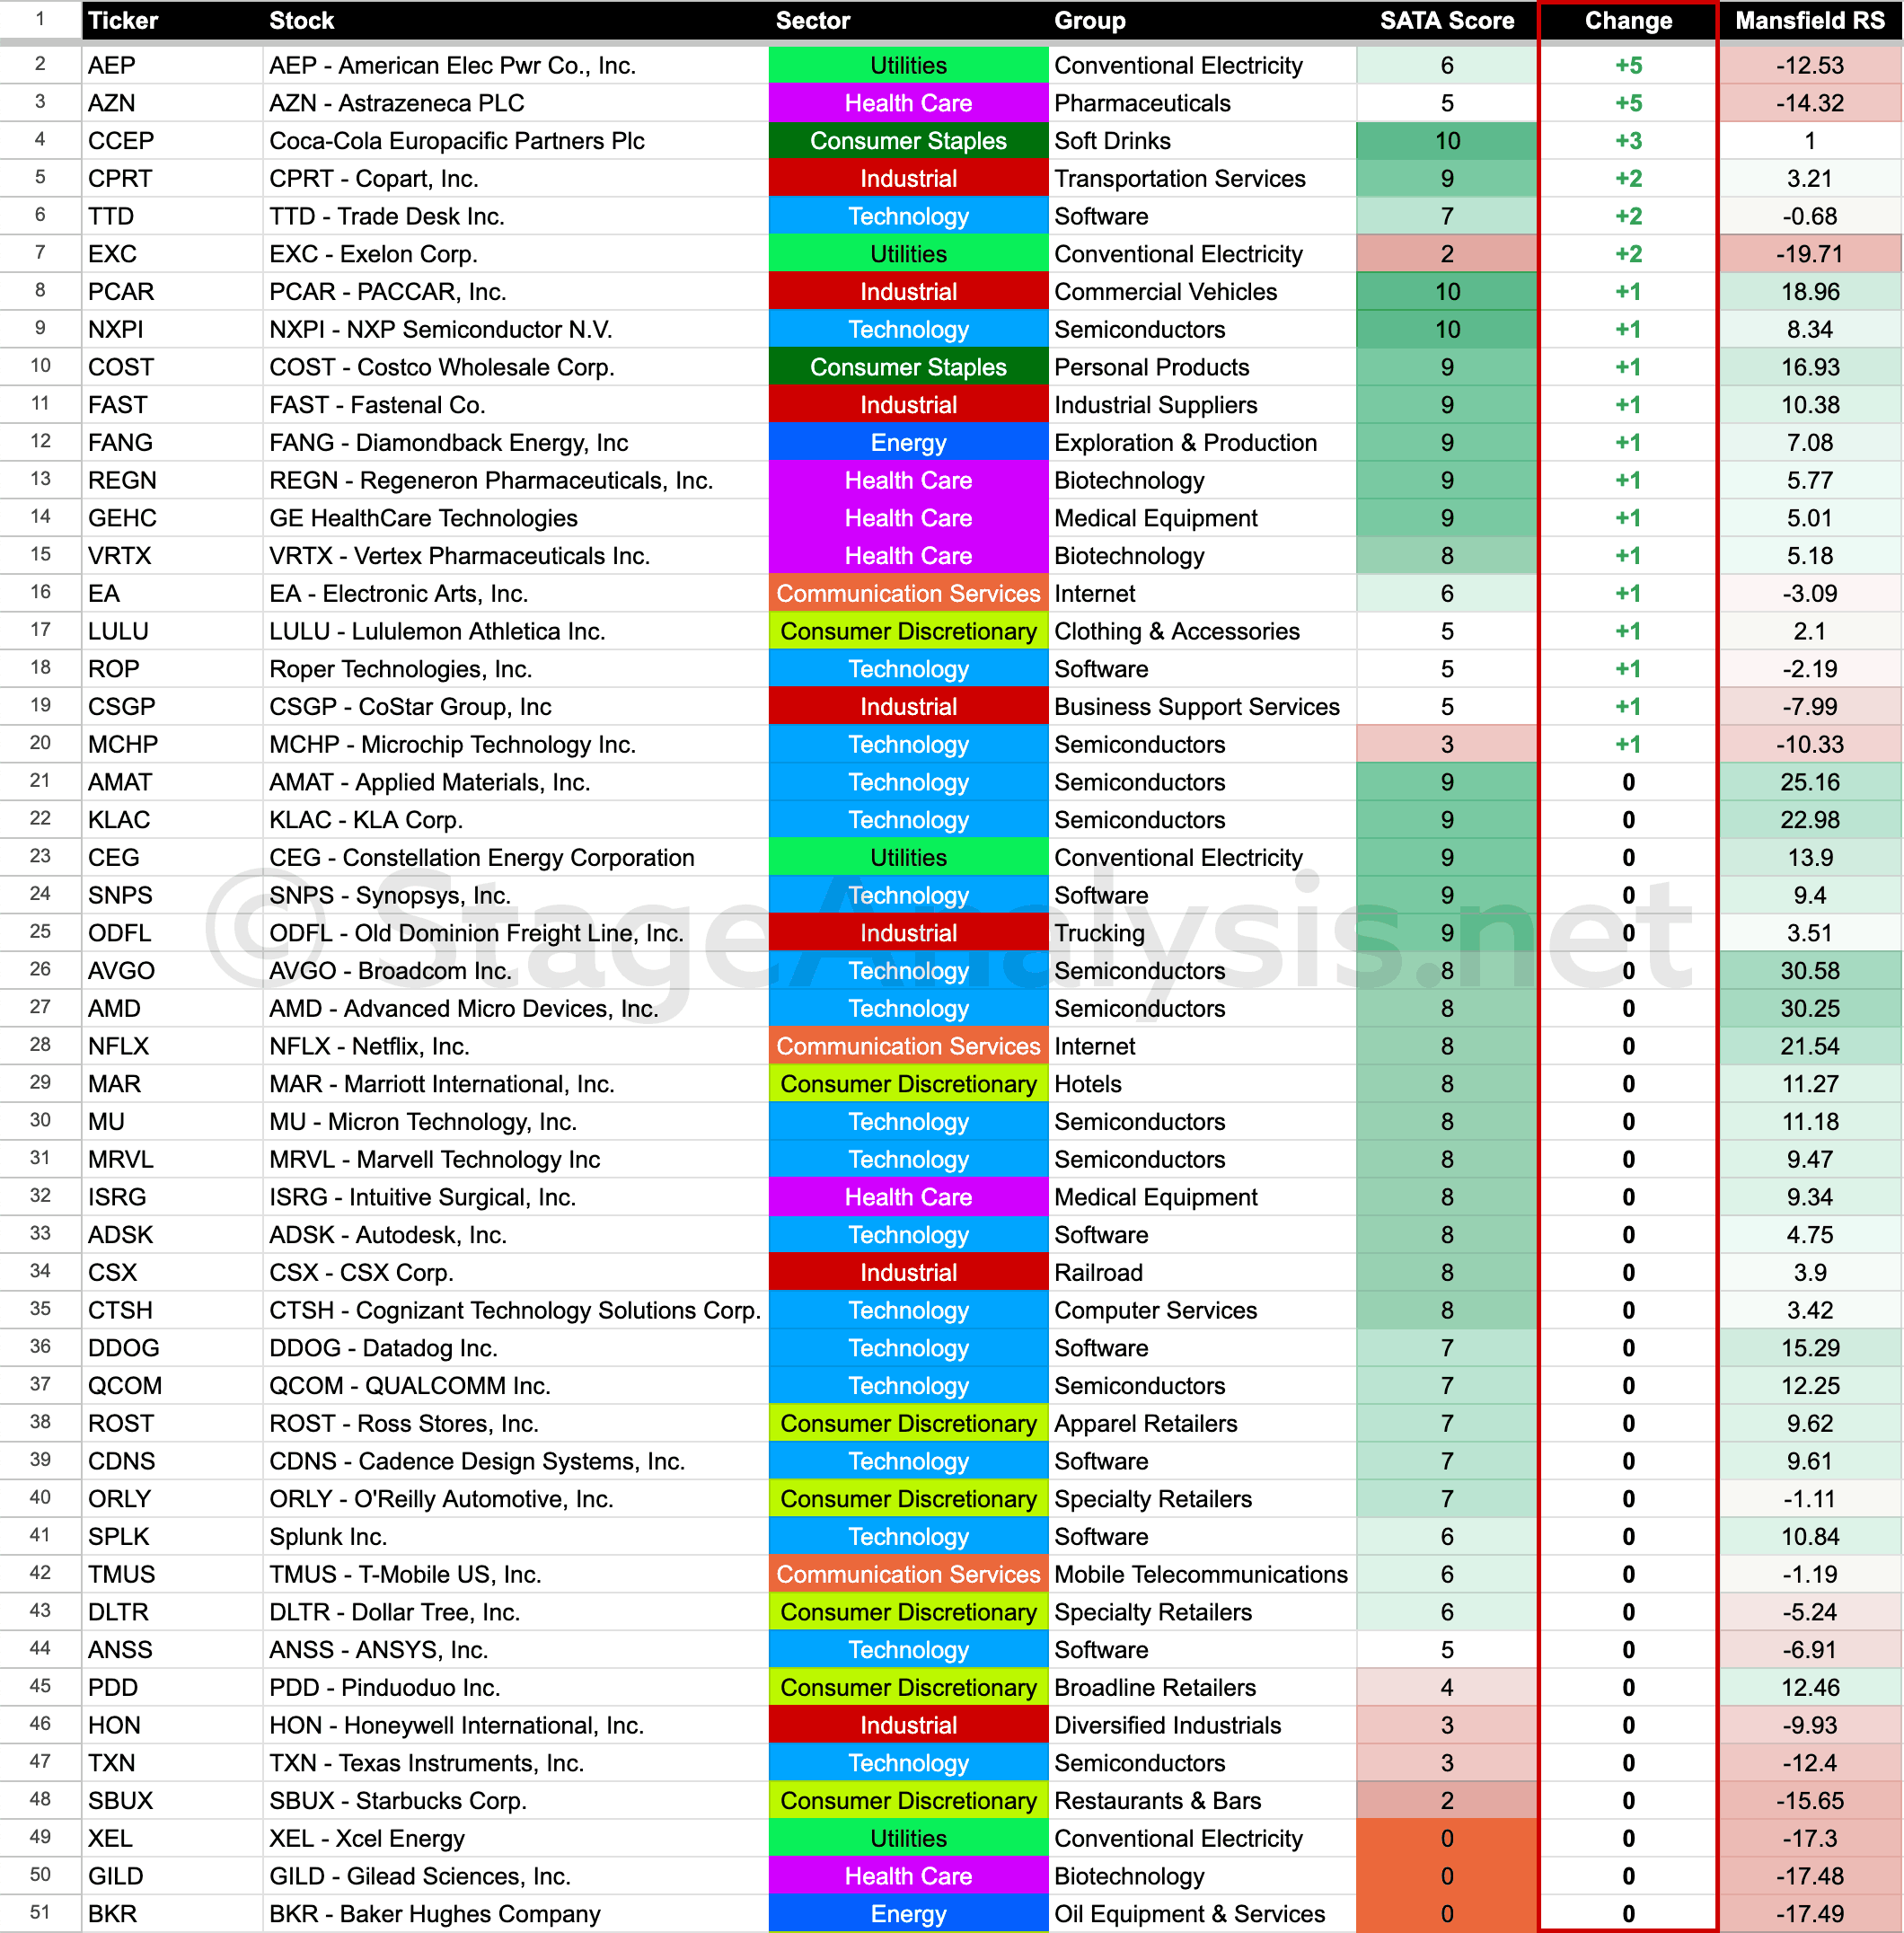
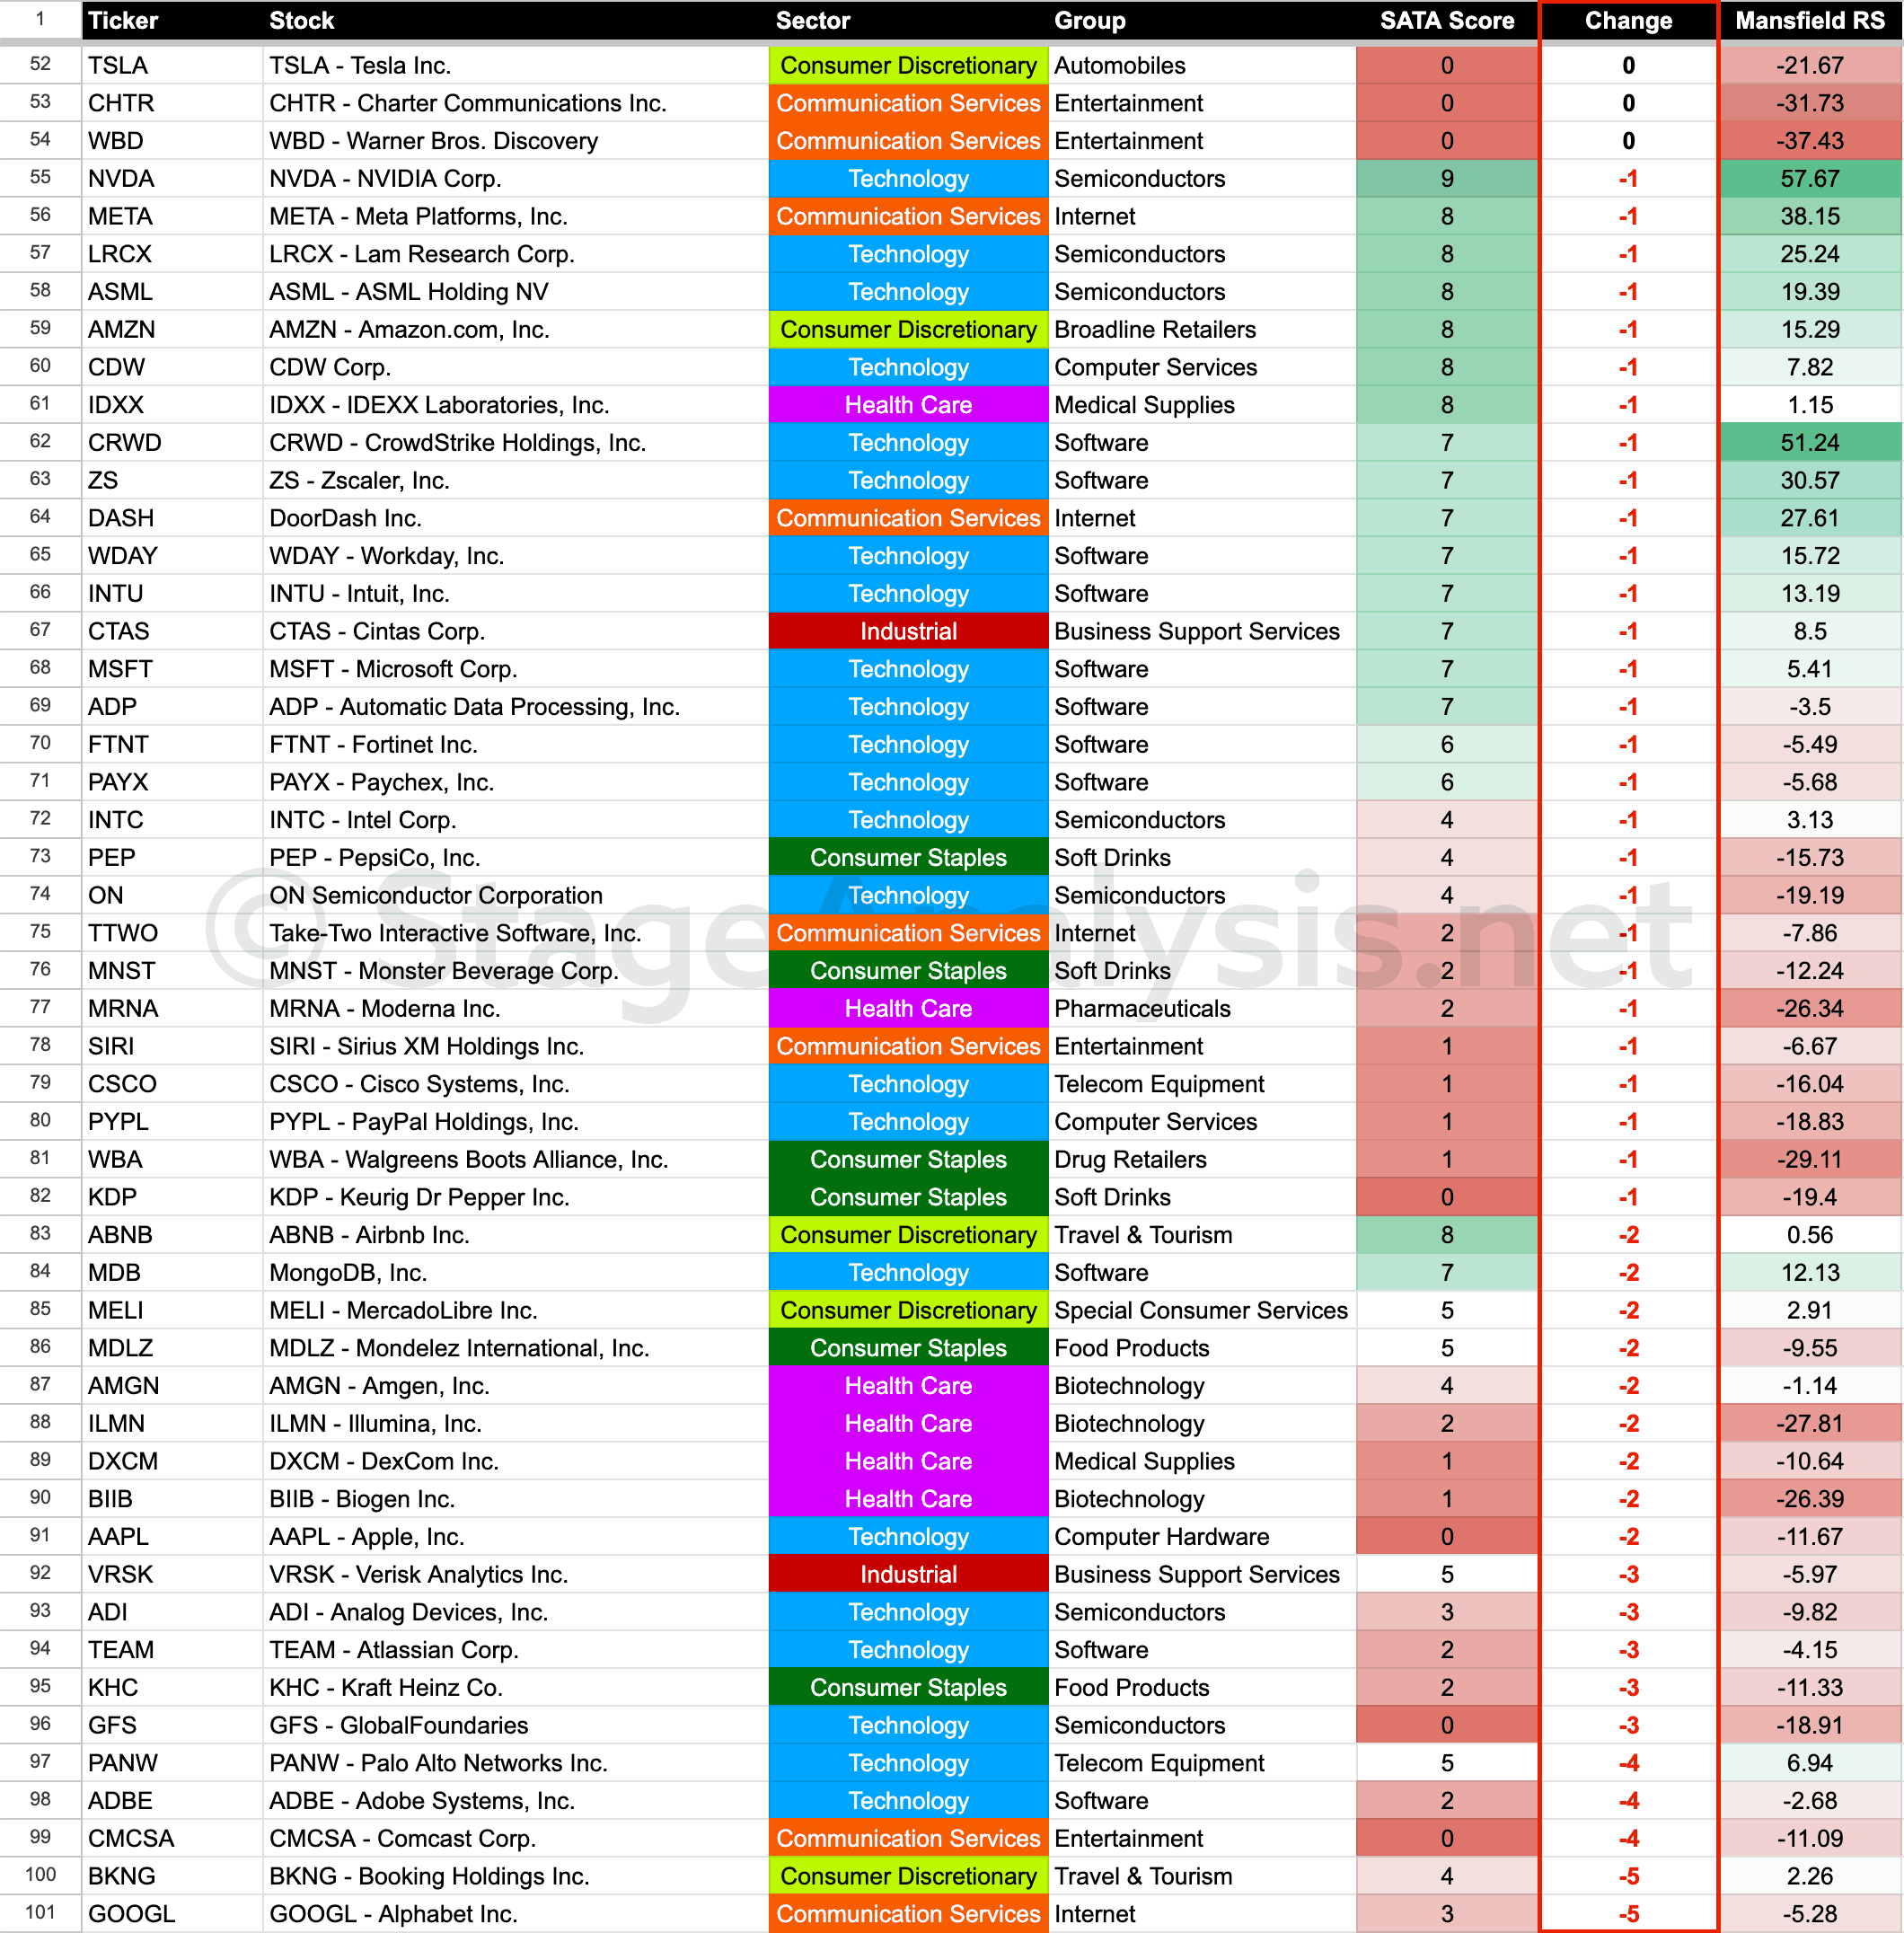
Ordered by SATA Change
The below table shows the Nasdaq 100 stocks ordered by SATA score change since the previous post a few weeks ago.
Become a Stage Analysis Member:
To see more like this – US Stocks watchlist posts, detailed videos each weekend, use our unique Stage Analysis tools, such as the US Stocks & ETFs Screener, Charts, Market Breadth, Group Relative Strength and more...
Join Today
Disclaimer: For educational purpose only. Not investment advice. Seek professional advice from a financial advisor before making any investing decisions.