
Sector Breadth: Percentage of US Stocks Above Their 150 day (30 Week) Moving Averages
The full post is available to view by members only. For immediate access:
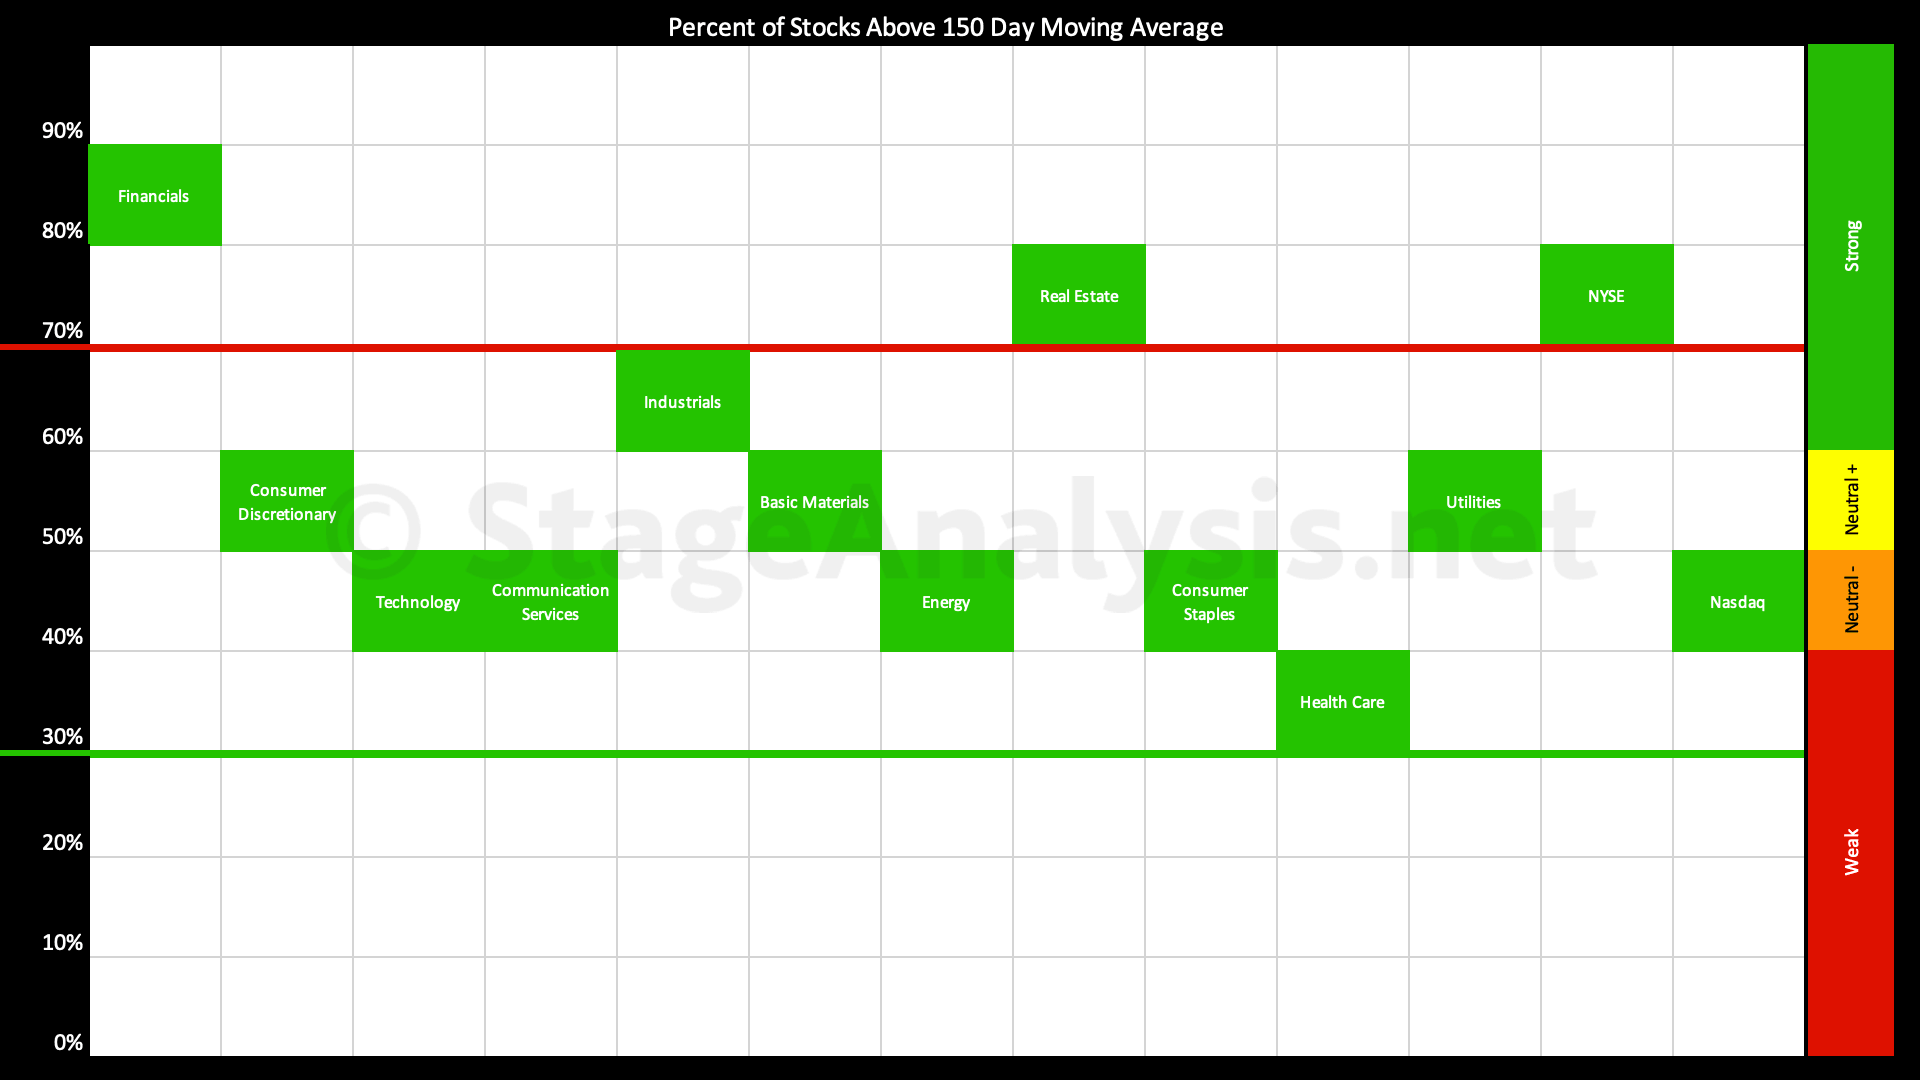
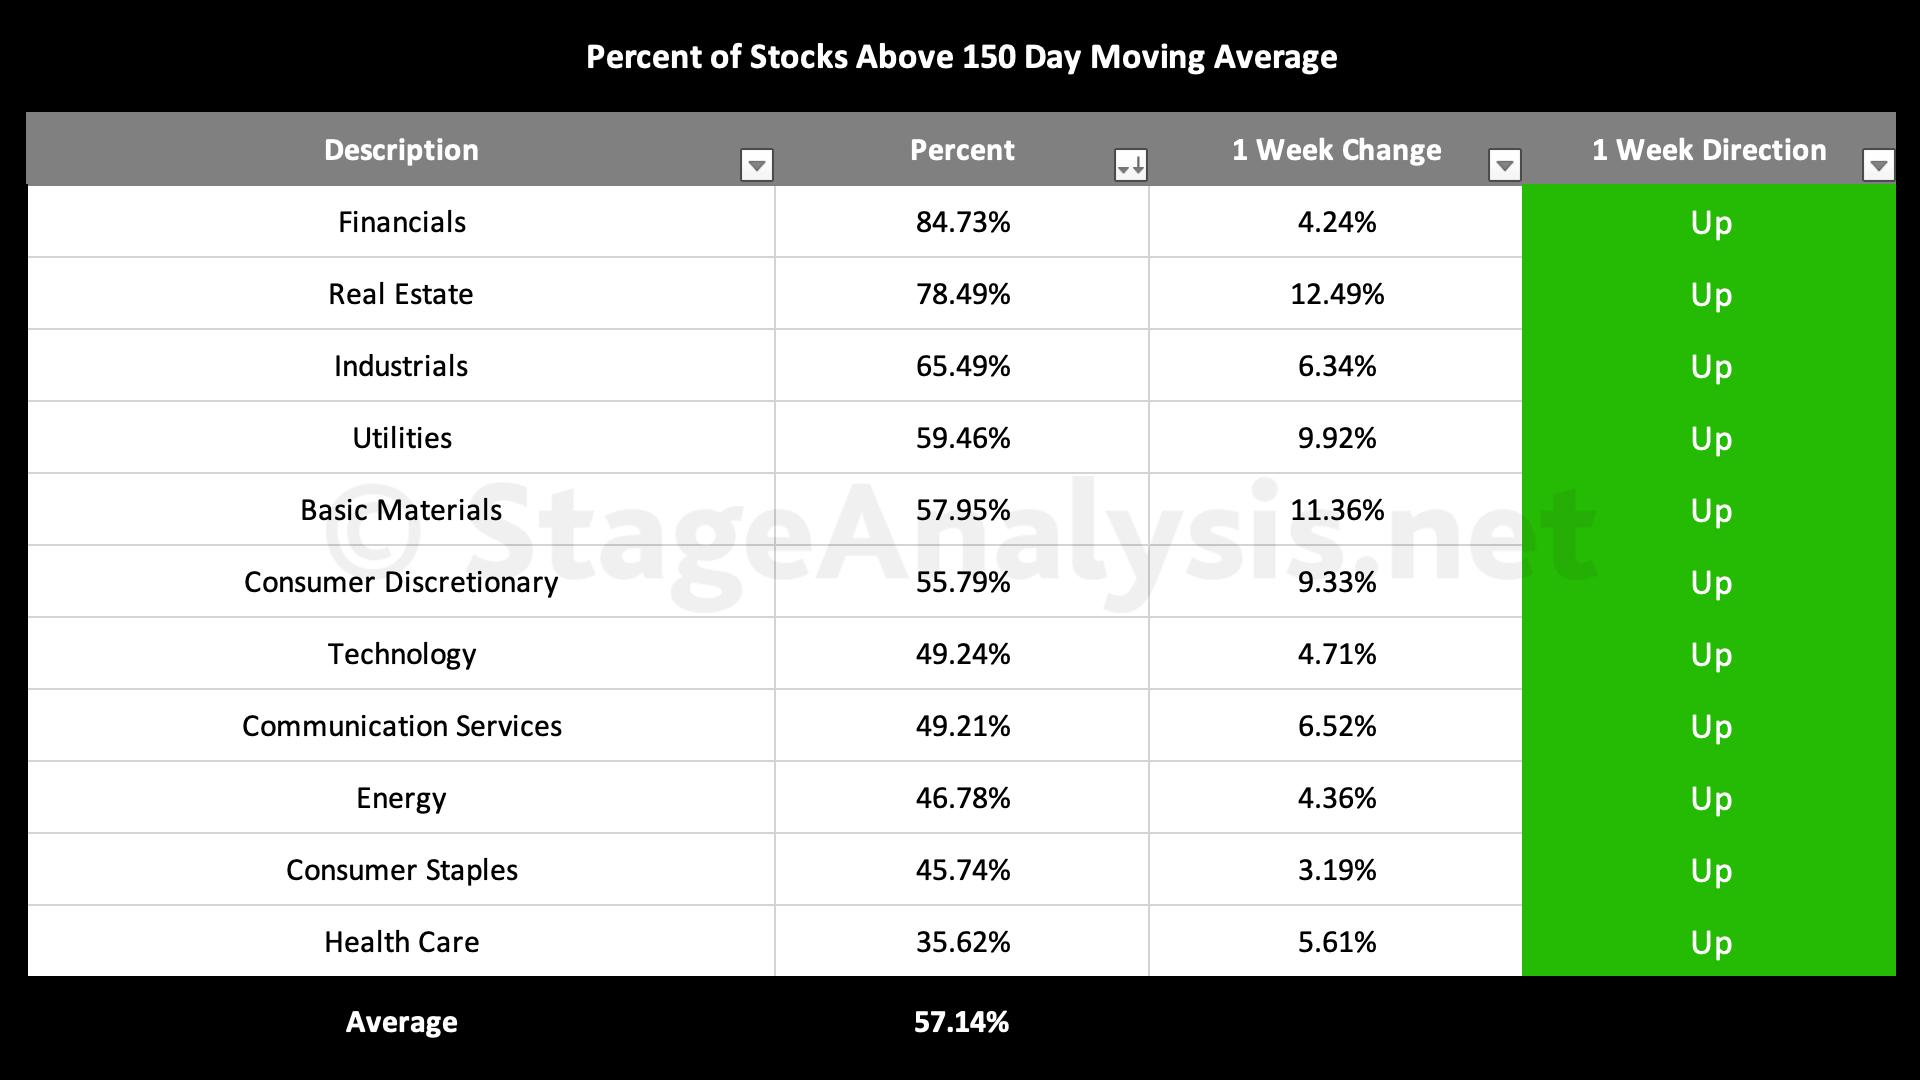
Average: 57.14% (+5.49% 2wk)
- 3 sectors in (Strong) Stage 2 zone (Financials, Real Estate, Industrials)
- 7 sectors in (Neutral) Stage 1 / 3 zone (Utilities, Basic Materials, Consumer Discretionary, Technology, Communication Services, Energy, Consumer Staples)
- 1 sector in (Weak) Stage 4 zone (Health Care)
Sample Size: 5102 stocks
The percentage of US stocks above their 150 day moving averages in the 11 major sectors increased by +5.49% since the previous post on the 4th December 2023, moving the overall average into the upper-middle of the chart at 57.14%, which is a very neutral+ position.
Sector changes: The sectors in the Stage 2 zone (Strong – above 60%) increased from 2 to 3. The sectors in the Stage 1 / 3 zone (Neutral – 40% to 60% range) decreased from 8 to 7, and the number of sectors in the Stage 4 zone (Weak – below 40%) was unchanged at 1.
Sector Breadth Table – Ordered by Relative Strength
The table below shows the short-term changes in the Percentage of US Stocks Above Their 150 day Moving Averages
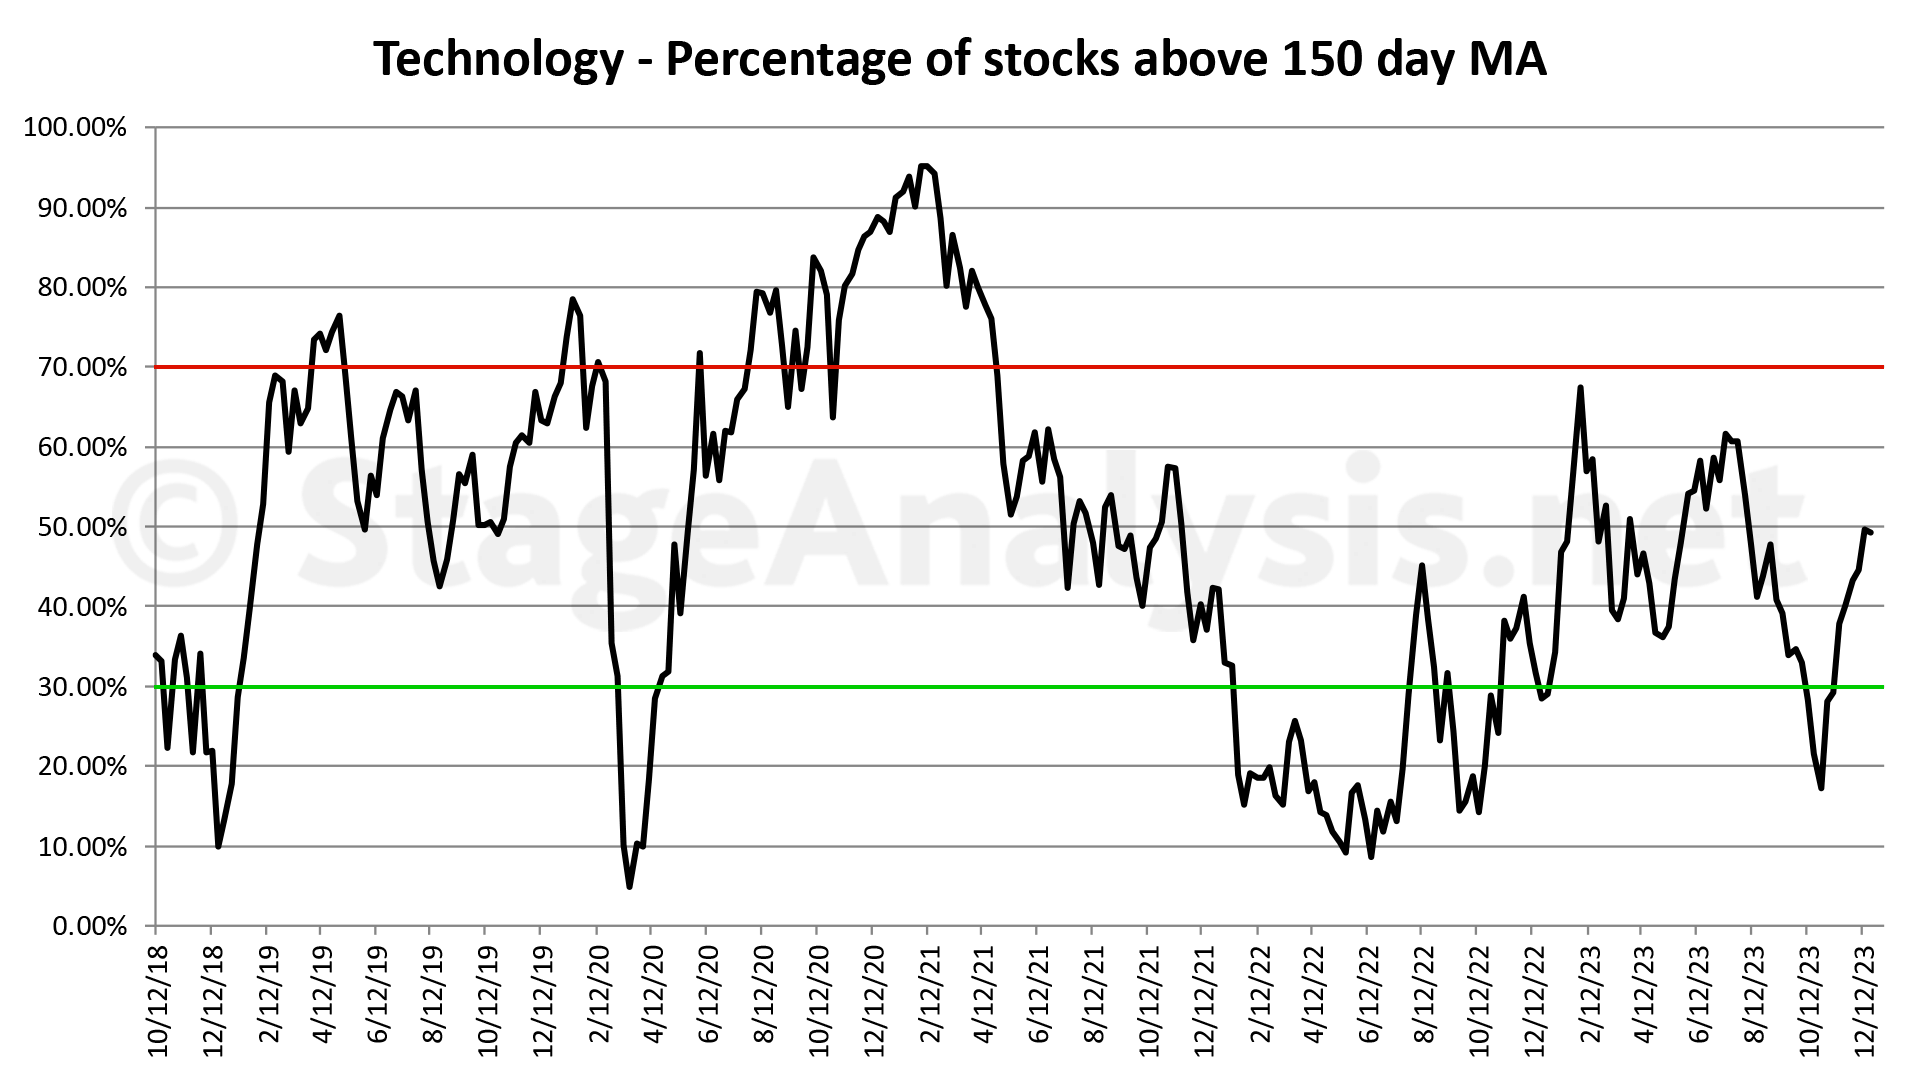
Sector Breadth Charts (Members Only)
Below is the charts for the 11 sectors showing back to late 2018. Which gives a very clear picture of the overall health of each sector and the market as a whole.
(Technology chart shown as an example for non-members – Sample size: 794 stocks from the Technology sector, which is the second largest group)
Become a Stage Analysis Member:
To see more like this – US Stocks watchlist posts, detailed videos each weekend, use our unique Stage Analysis tools, such as the US Stocks & ETFs Screener, Charts, Market Breadth, Group Relative Strength and more...
Join Today
Disclaimer: For educational purpose only. Not investment advice. Seek professional advice from a financial advisor before making any investing decisions.