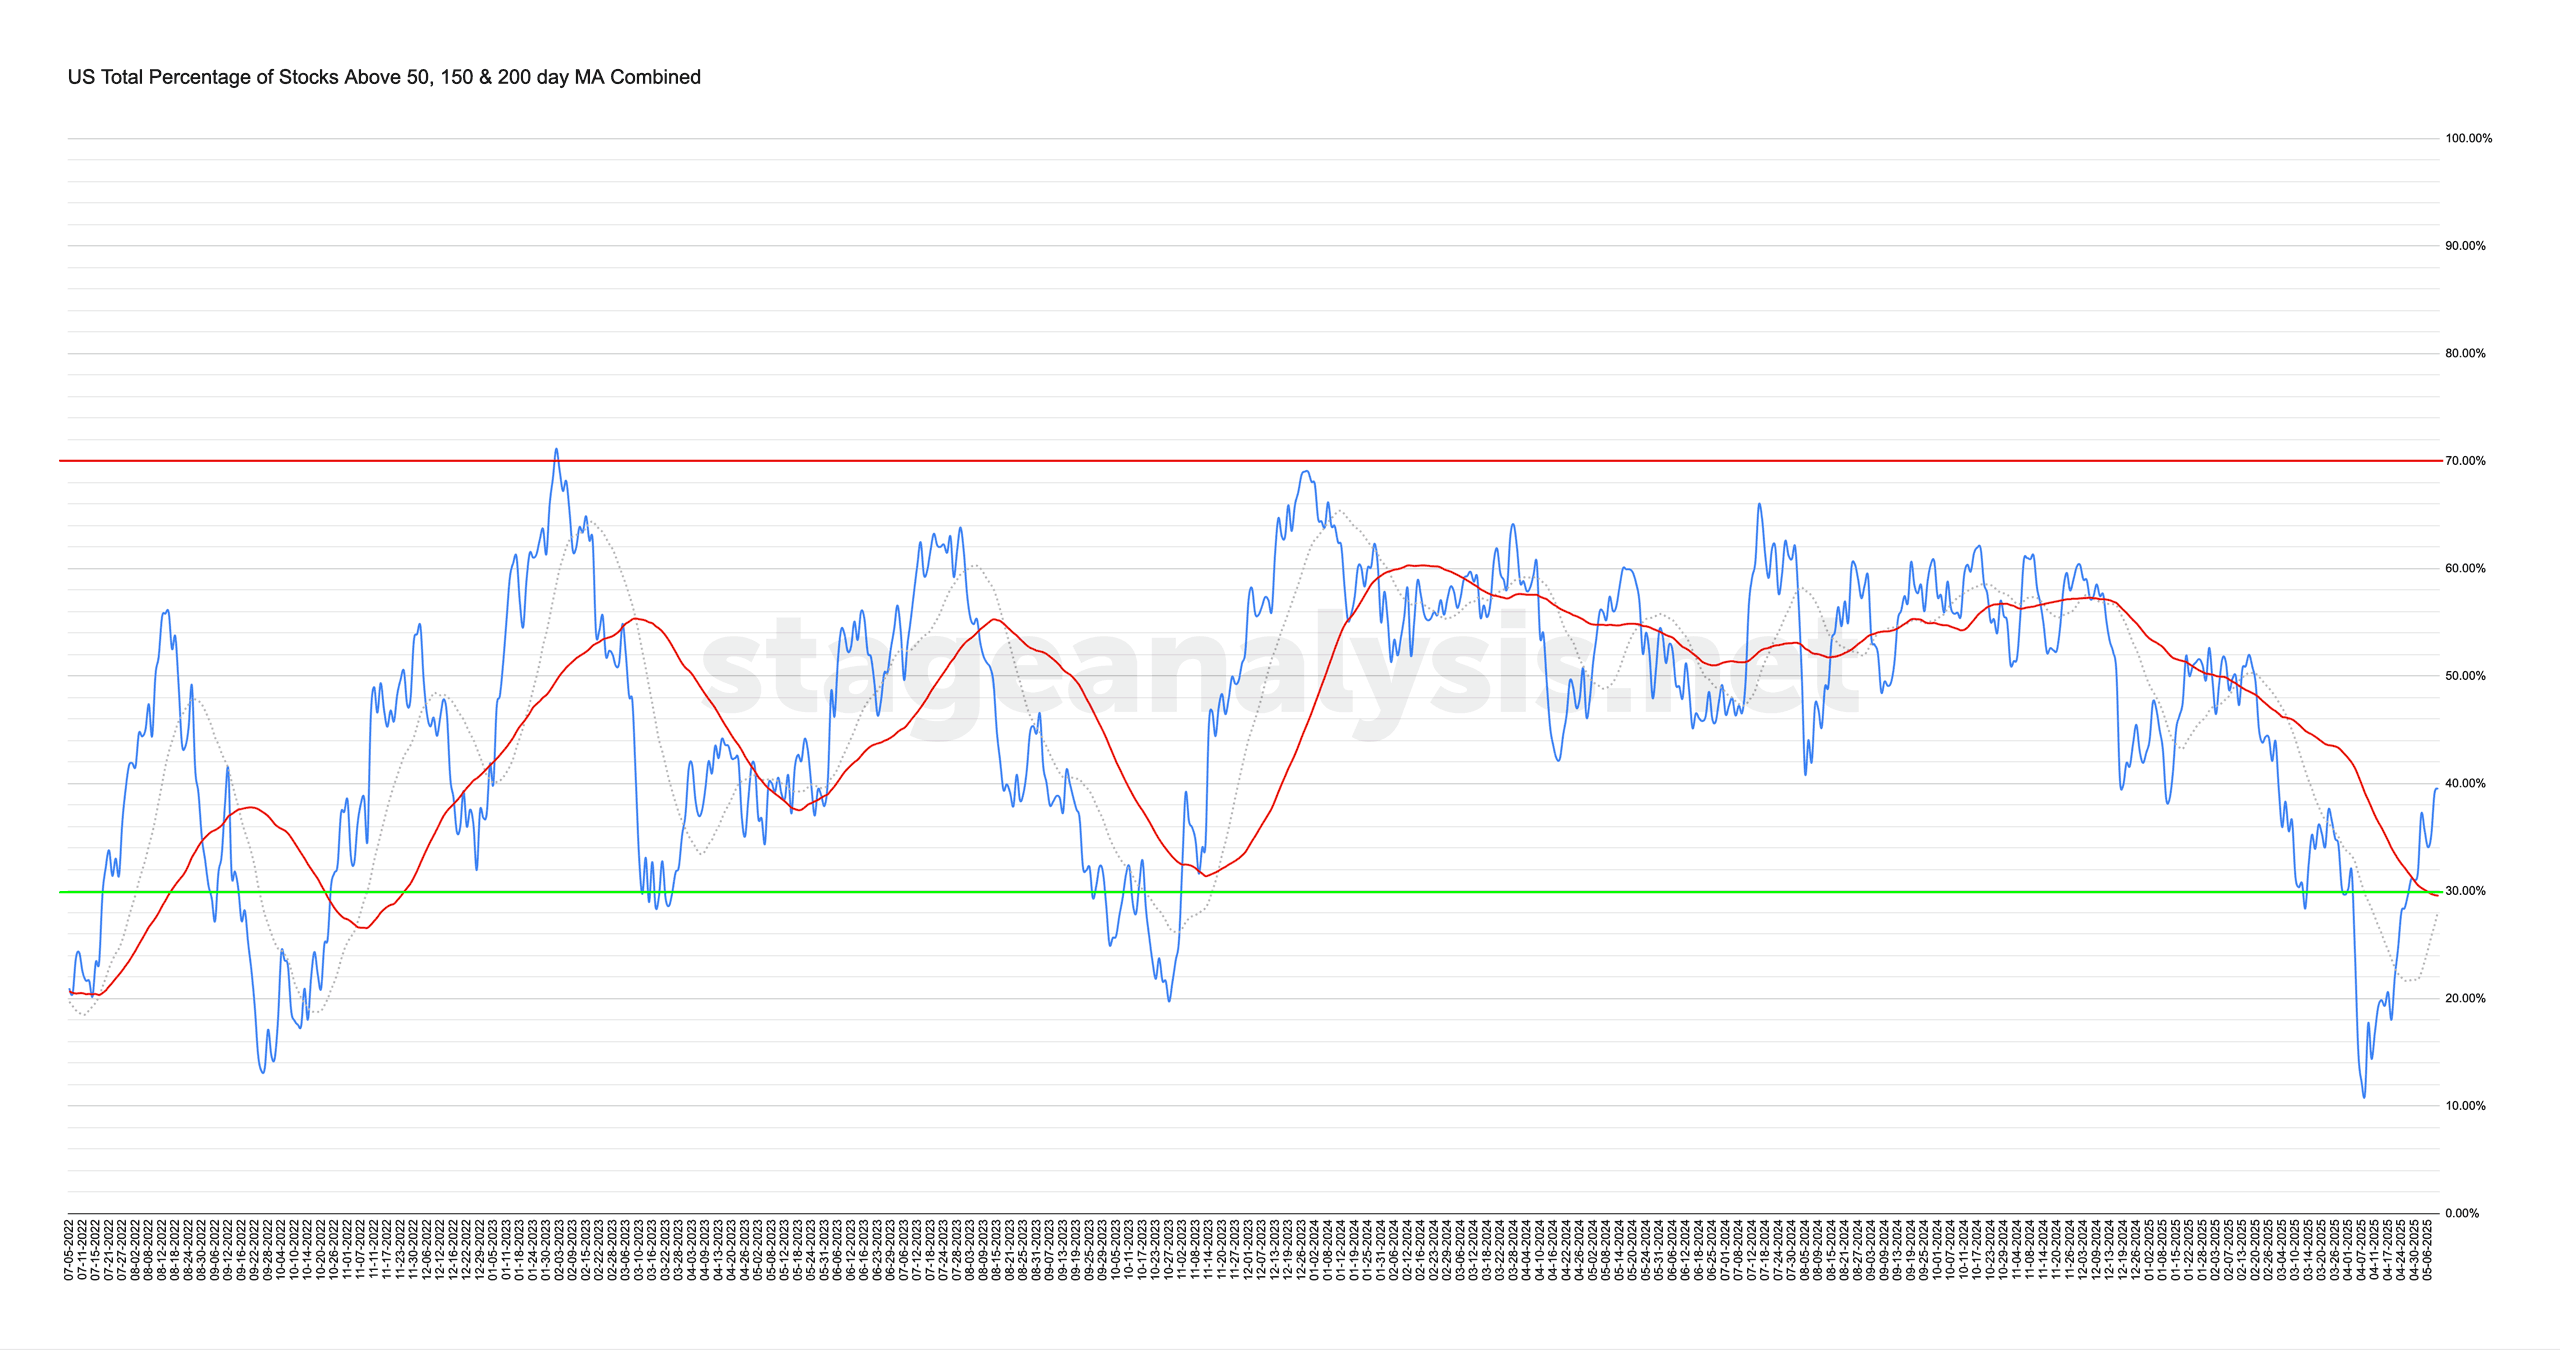
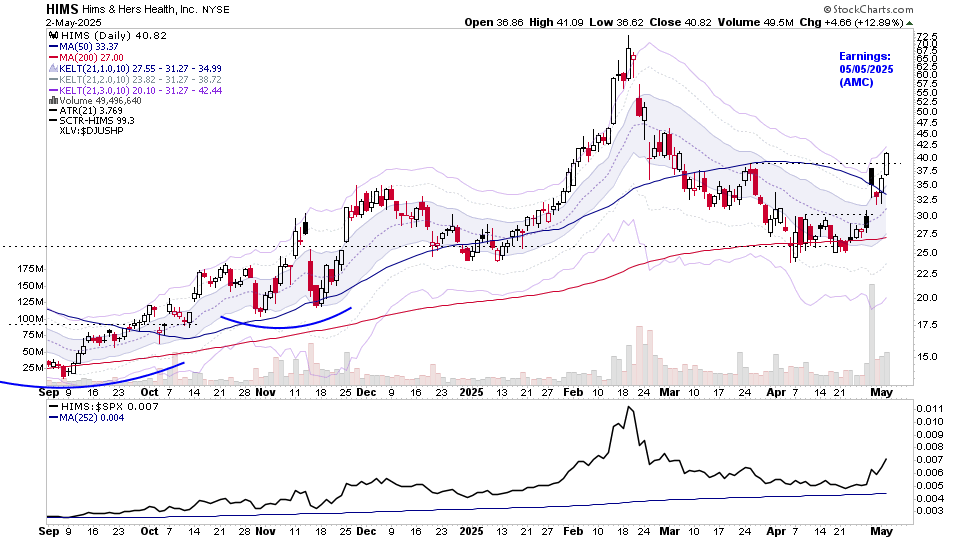
Stage Analysis Video Training Course

Blog – All Posts

The blog shows all articles in date order – including the US Stocks Watchlist, Videos, Indexes, Market Breadth and featured articles on Industry Groups, Sectors or individual Stocks. But if you want see the watchlist posts only, then use the Watchlist tab in the menu, or the category link in the sidebar area.

Stage Analysis Members Video – 15 October 2023 (1hr 11mins)

This weekends video begins with analysis of the TSLA and NFLX ahead of their earnings results this week, followed by the Major Indexes Update, Futures SATA Charts, Industry Groups RS Rankings, IBD Industry Group Bell Curve – Bullish Percent, Market Breadth Update to determine the Weight of Evidence, Stage 2 breakouts, and finishing with analysis of the recent watchlist stocks in detail on multiple timeframes.
Read More

IBD Industry Groups Bell Curve – Bullish Percent

The IBD Industry Groups Bell Curve – Bullish Percent shows the few hundred industry groups plotted as a histogram chart and represents the percentage of stocks in each group that are on a point & figure (P&F) buy signal...
Read More

Stage Analysis Members Video – 11 October 2023 (46mins)

The Stage Analysis midweek video with a discussion of the major US stock market indexes, and short-term market breadth measures. Followed by a detailed look at the Sector Breadth charts and finishing with the recent watchlist stocks on multiple timeframes.
Read More

Stage Analysis Members Video – 8 October 2023 (1hr 15mins)

Stage Analysis members video discussing the Major Indexes Update, Futures SATA Charts, Industry Groups RS Rankings, IBD Industry Group Bell Curve – Bullish Percent, Market Breadth Update to determine the Weight of Evidence, Strong Volume Stage 2 stocks and closing with analysis of the recent watchlist stocks in detail on multiple timeframes.
Read More