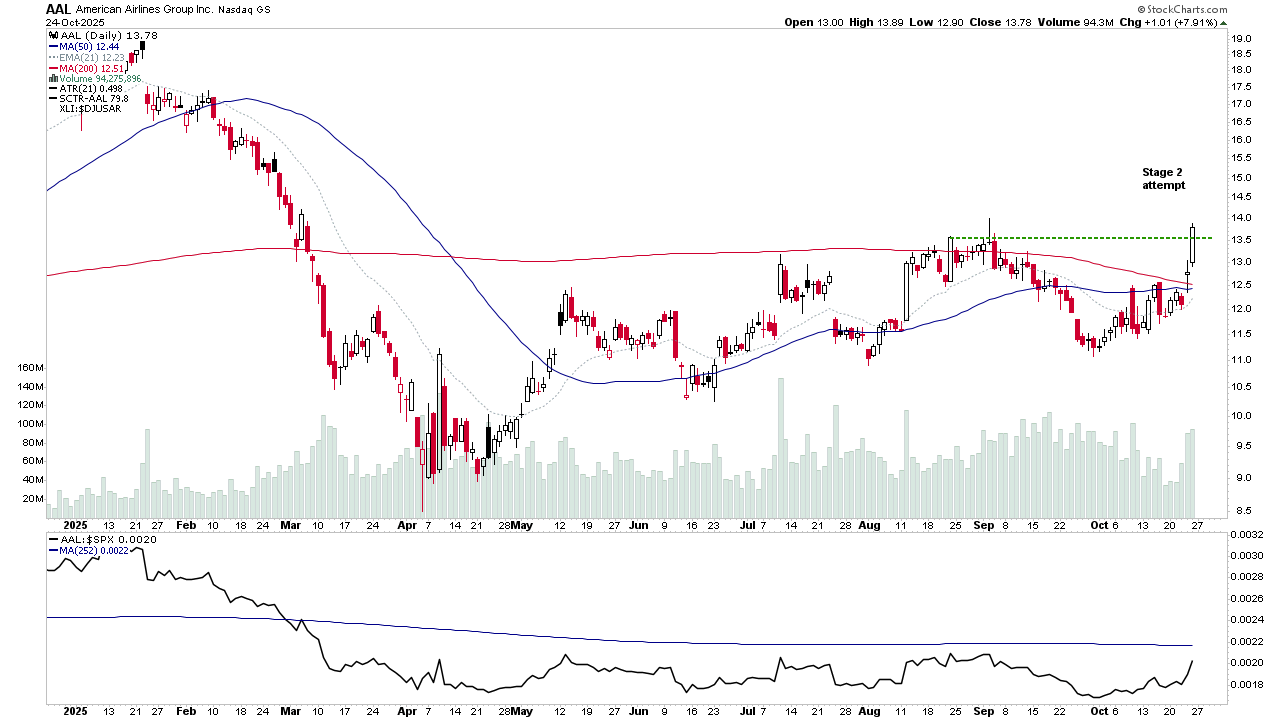
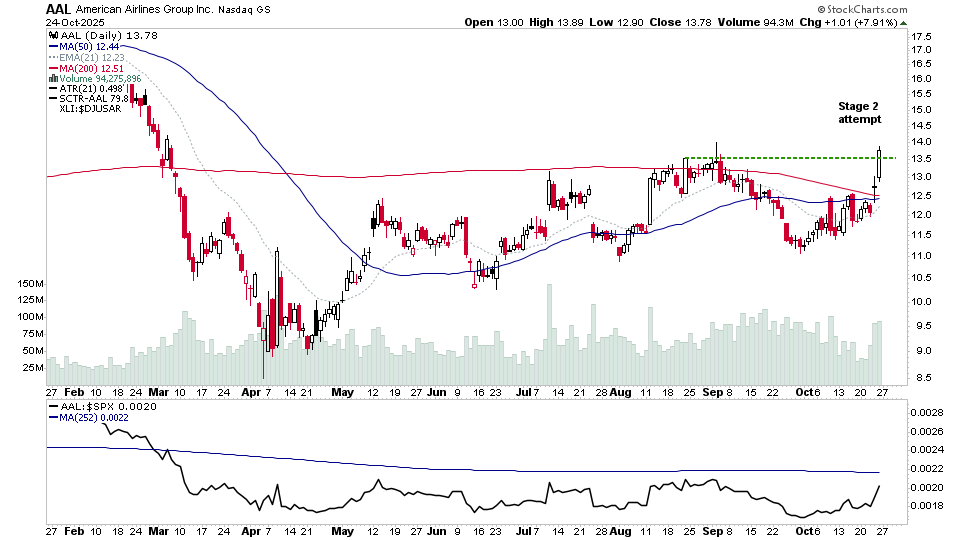
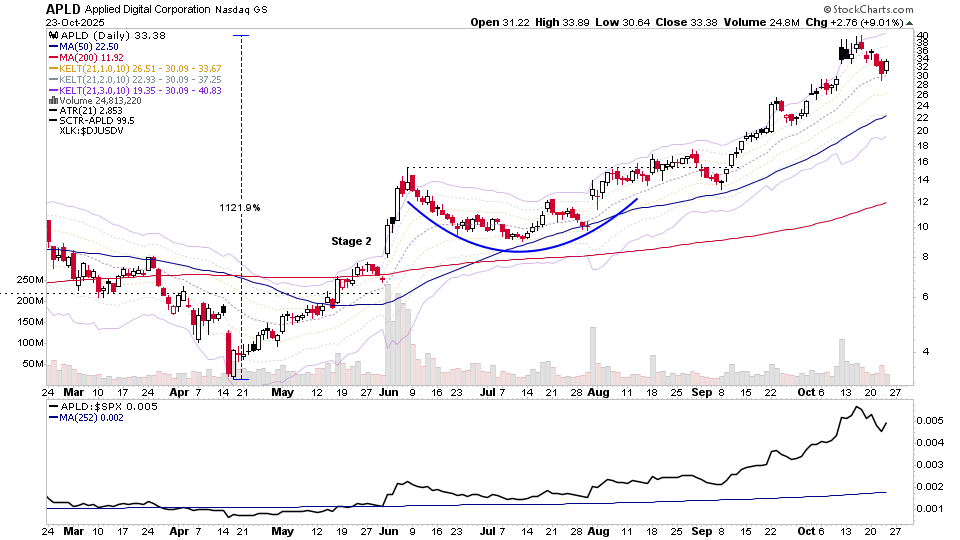
Stage Analysis Video Training Course

Blog – All Posts

The blog shows all articles in date order – including the US Stocks Watchlist, Videos, Indexes, Market Breadth and featured articles on Industry Groups, Sectors or individual Stocks. But if you want see the watchlist posts only, then use the Watchlist tab in the menu, or the category link in the sidebar area.

IBD Industry Groups Bell Curve – Bullish Percent

The IBD Industry Groups Bell Curve increased by +1.97% this week to finish at 54.35% overall. The amount of groups in Stage 4 (Weak) decreased by 7 (-3.5%), and the amount of groups in Stage 2 (Strong) increased by 10 (+5%), while the amount groups in Stage 1 or Stage 3 (Neutral) decreased by 3 (-1.5%).
Read More

Stage Analysis Members Video – 17 December 2023 (1hr 24mins)

Stage Analysis members weekend video discussing the Major US Stock Market Indexes, Futures charts, Industry Groups Relative Strength (RS) Rankings, IBD Industry Group Bell Curve – Bullish Percent, the key Market Breadth Charts to determine the Weight of Evidence, Group Focus on the Gold and Silver Miners, Significant Weekly Bars, and the US watchlist stocks in detail on multiple timeframes.
Read More

IBD Industry Groups Bell Curve – Bullish Percent

The IBD Industry Groups Bell Curve increased by +6.26% this week to finish at 52.38% overall. The amount of groups in Stage 4 (Weak) decreased by 26 (-13%), and the amount of groups in Stage 2 (Strong) increased by 17 (+8.5%), while the amount groups in Stage 1 or Stage 3 (Neutral) increased by 9 (+4.5%).
Read More