The Stage Analysis members video begins with a discussion of the current US Watchlist Stocks on multiple timeframes, Stages Summary, the new GICS Screener, Heatmap & Performance pages, the Sector breadth and Sub-industries Bell Curves, the key Market Breadth Charts to determine the Weight of Evidence, Bitcoin & Ethereum, the Major US Stock Market Indexes and the ETF Summary.
Read More

Blog

27 September, 2026
Stage Analysis Members Video – 27 September 2026 (59mins)
27 September, 2026
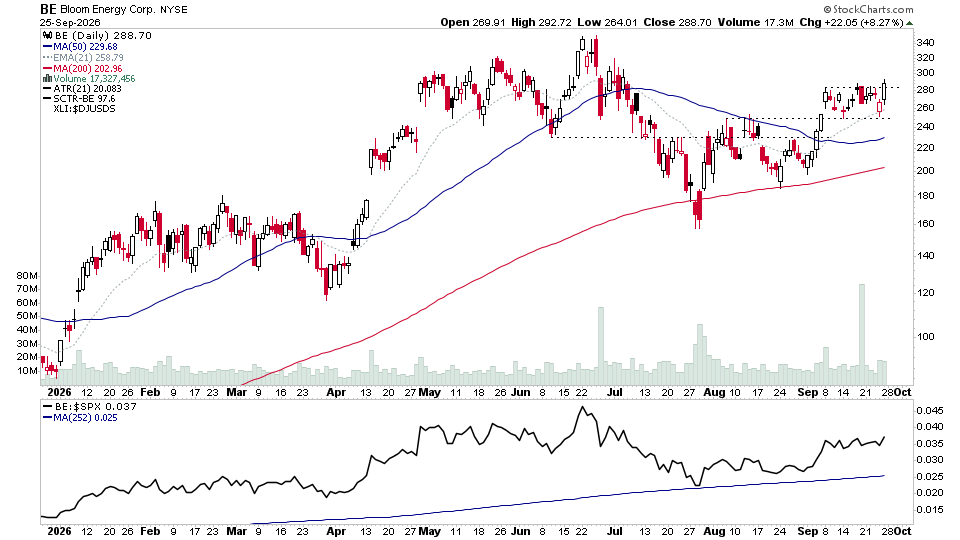
US Stocks Watchlist – 28 September 2026
There are 20 stocks highlighted from the weekends US stocks watchlist scans...
Read More
25 September, 2026
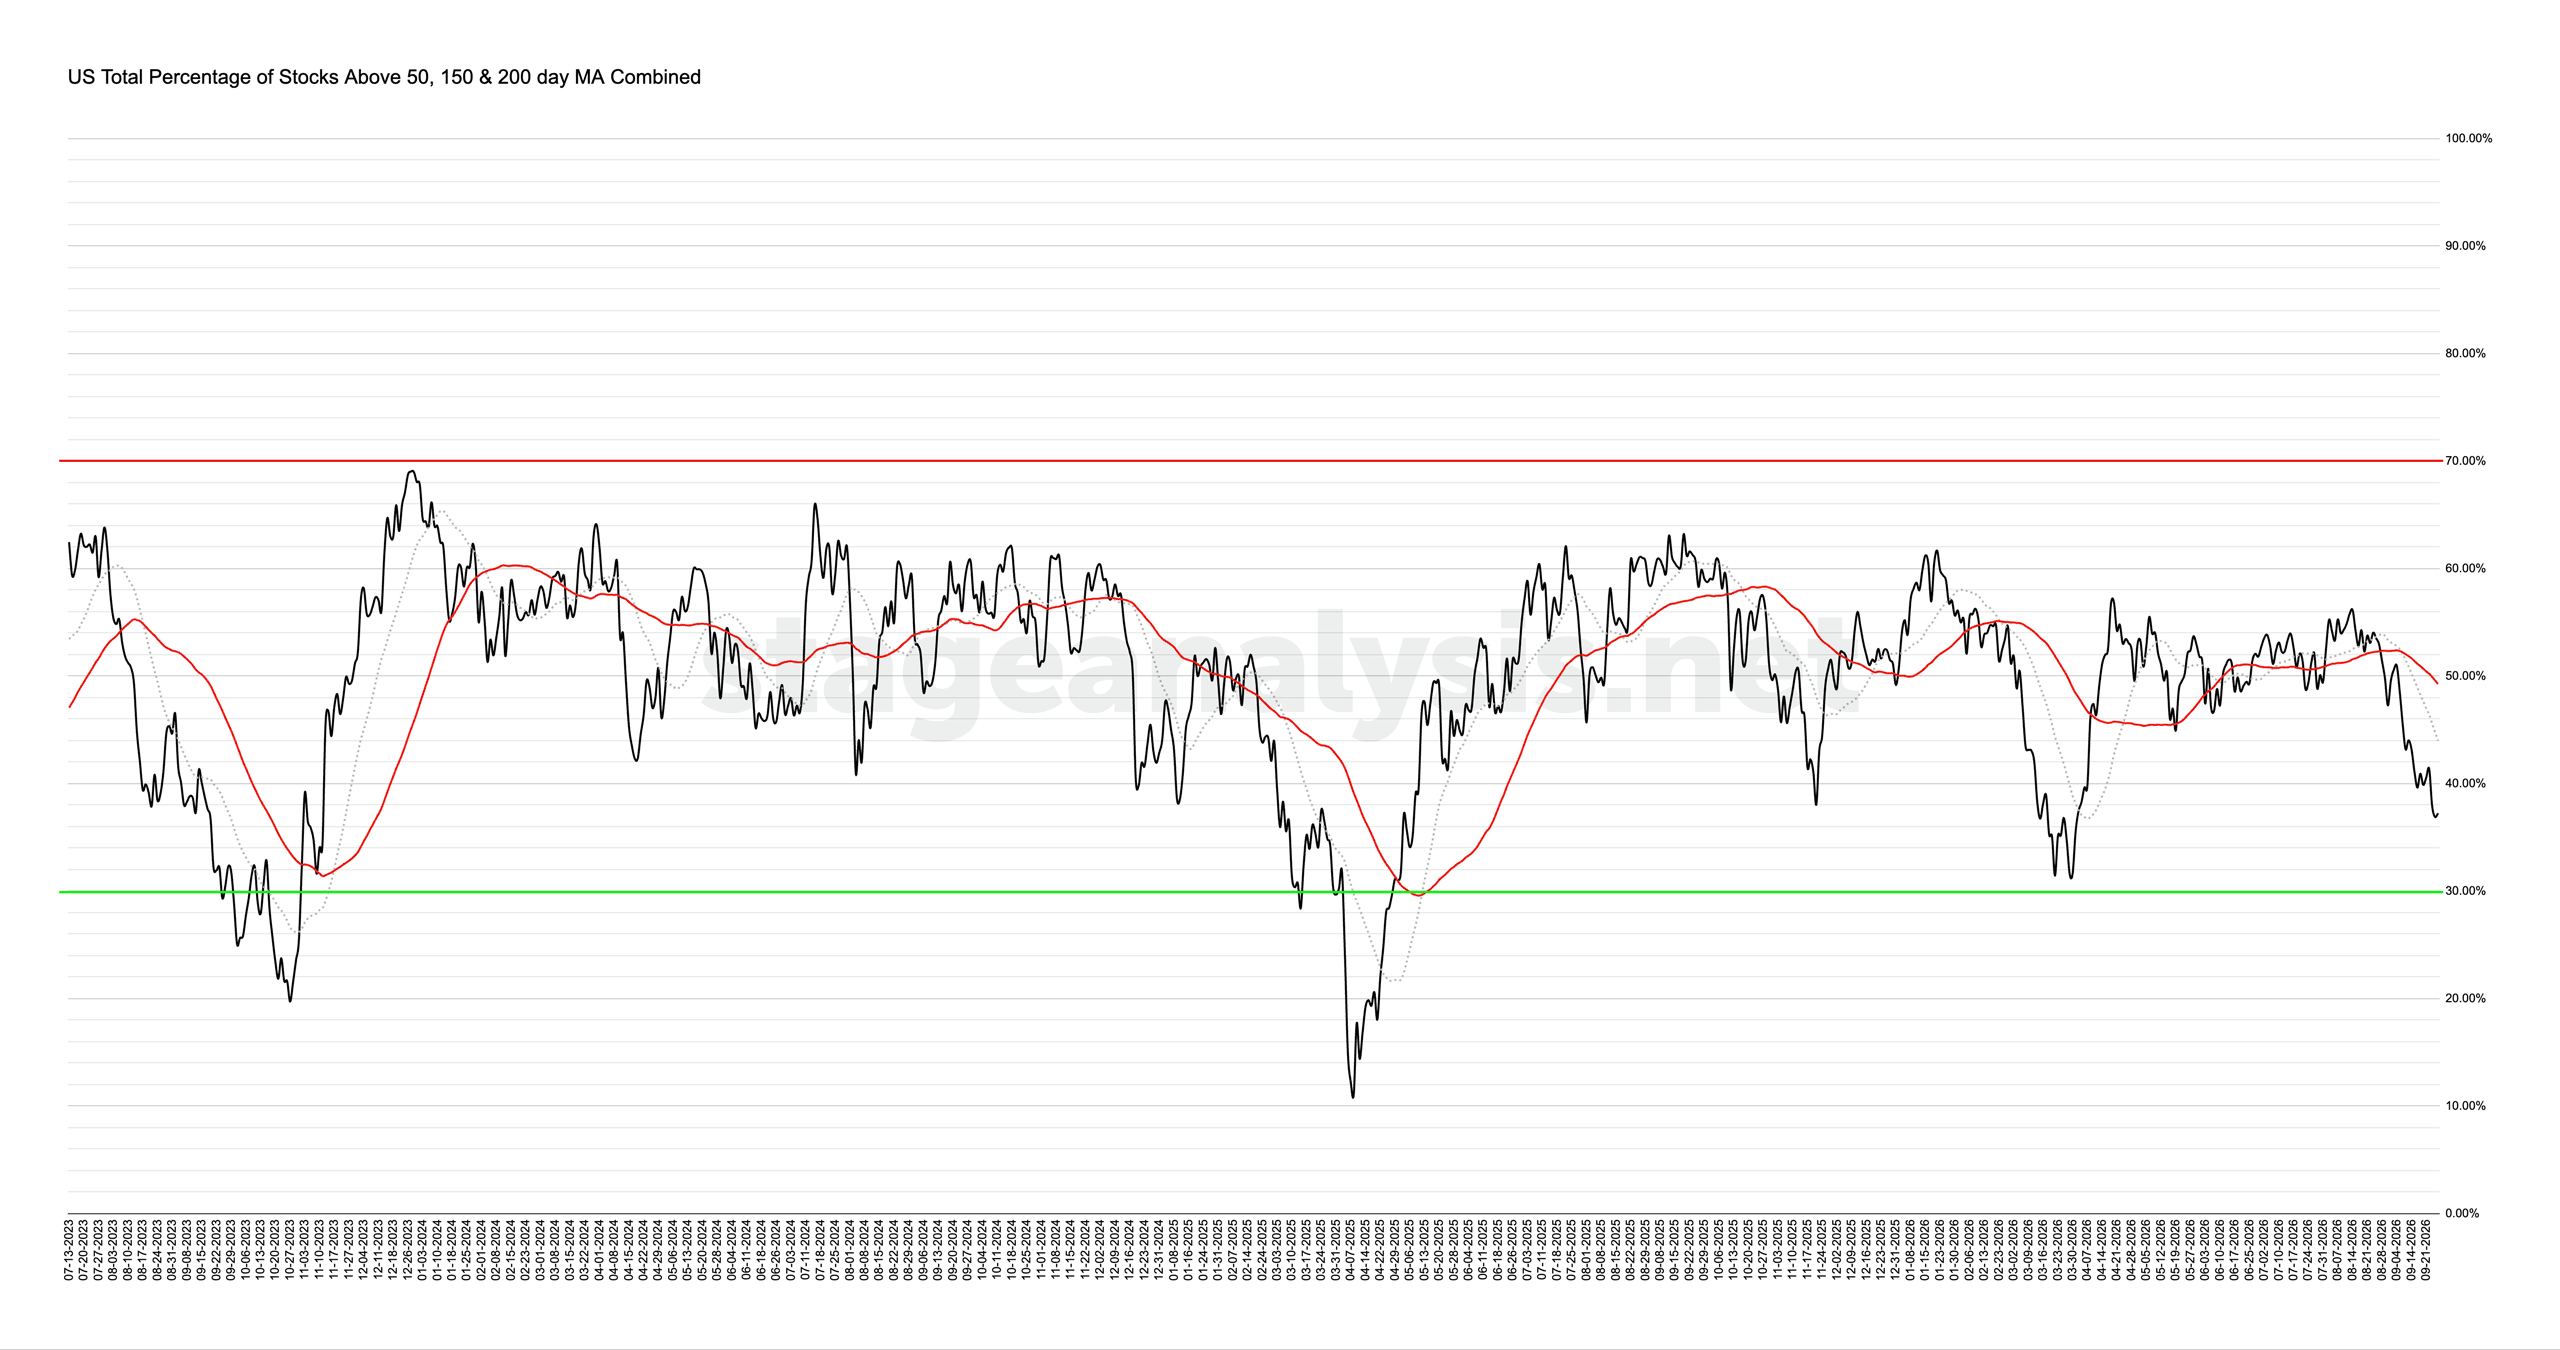
Market Breadth: Percentage of Stocks Above their 50 Day, 150 Day & 200 Day Moving Averages Combined
The US Total Percentage of Stocks above their 50 Day, 150 Day & 200 Day Moving Averages (shown above) decreased by -2.62% this week. Therefore, the overall combined average is at 37.24% in the US market (NYSE and Nasdaq markets combined) above their short, medium and long term moving averages.
Read More
23 September, 2026
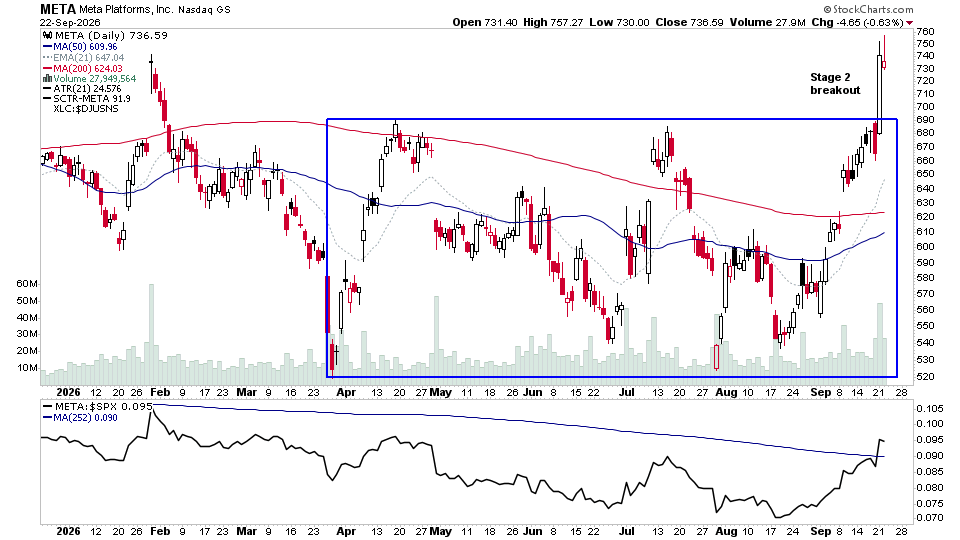
US Stocks Watchlist – 23 September 2026
There were 20 stocks highlighted from the US stocks watchlist scans today...
Read More
19 September, 2026
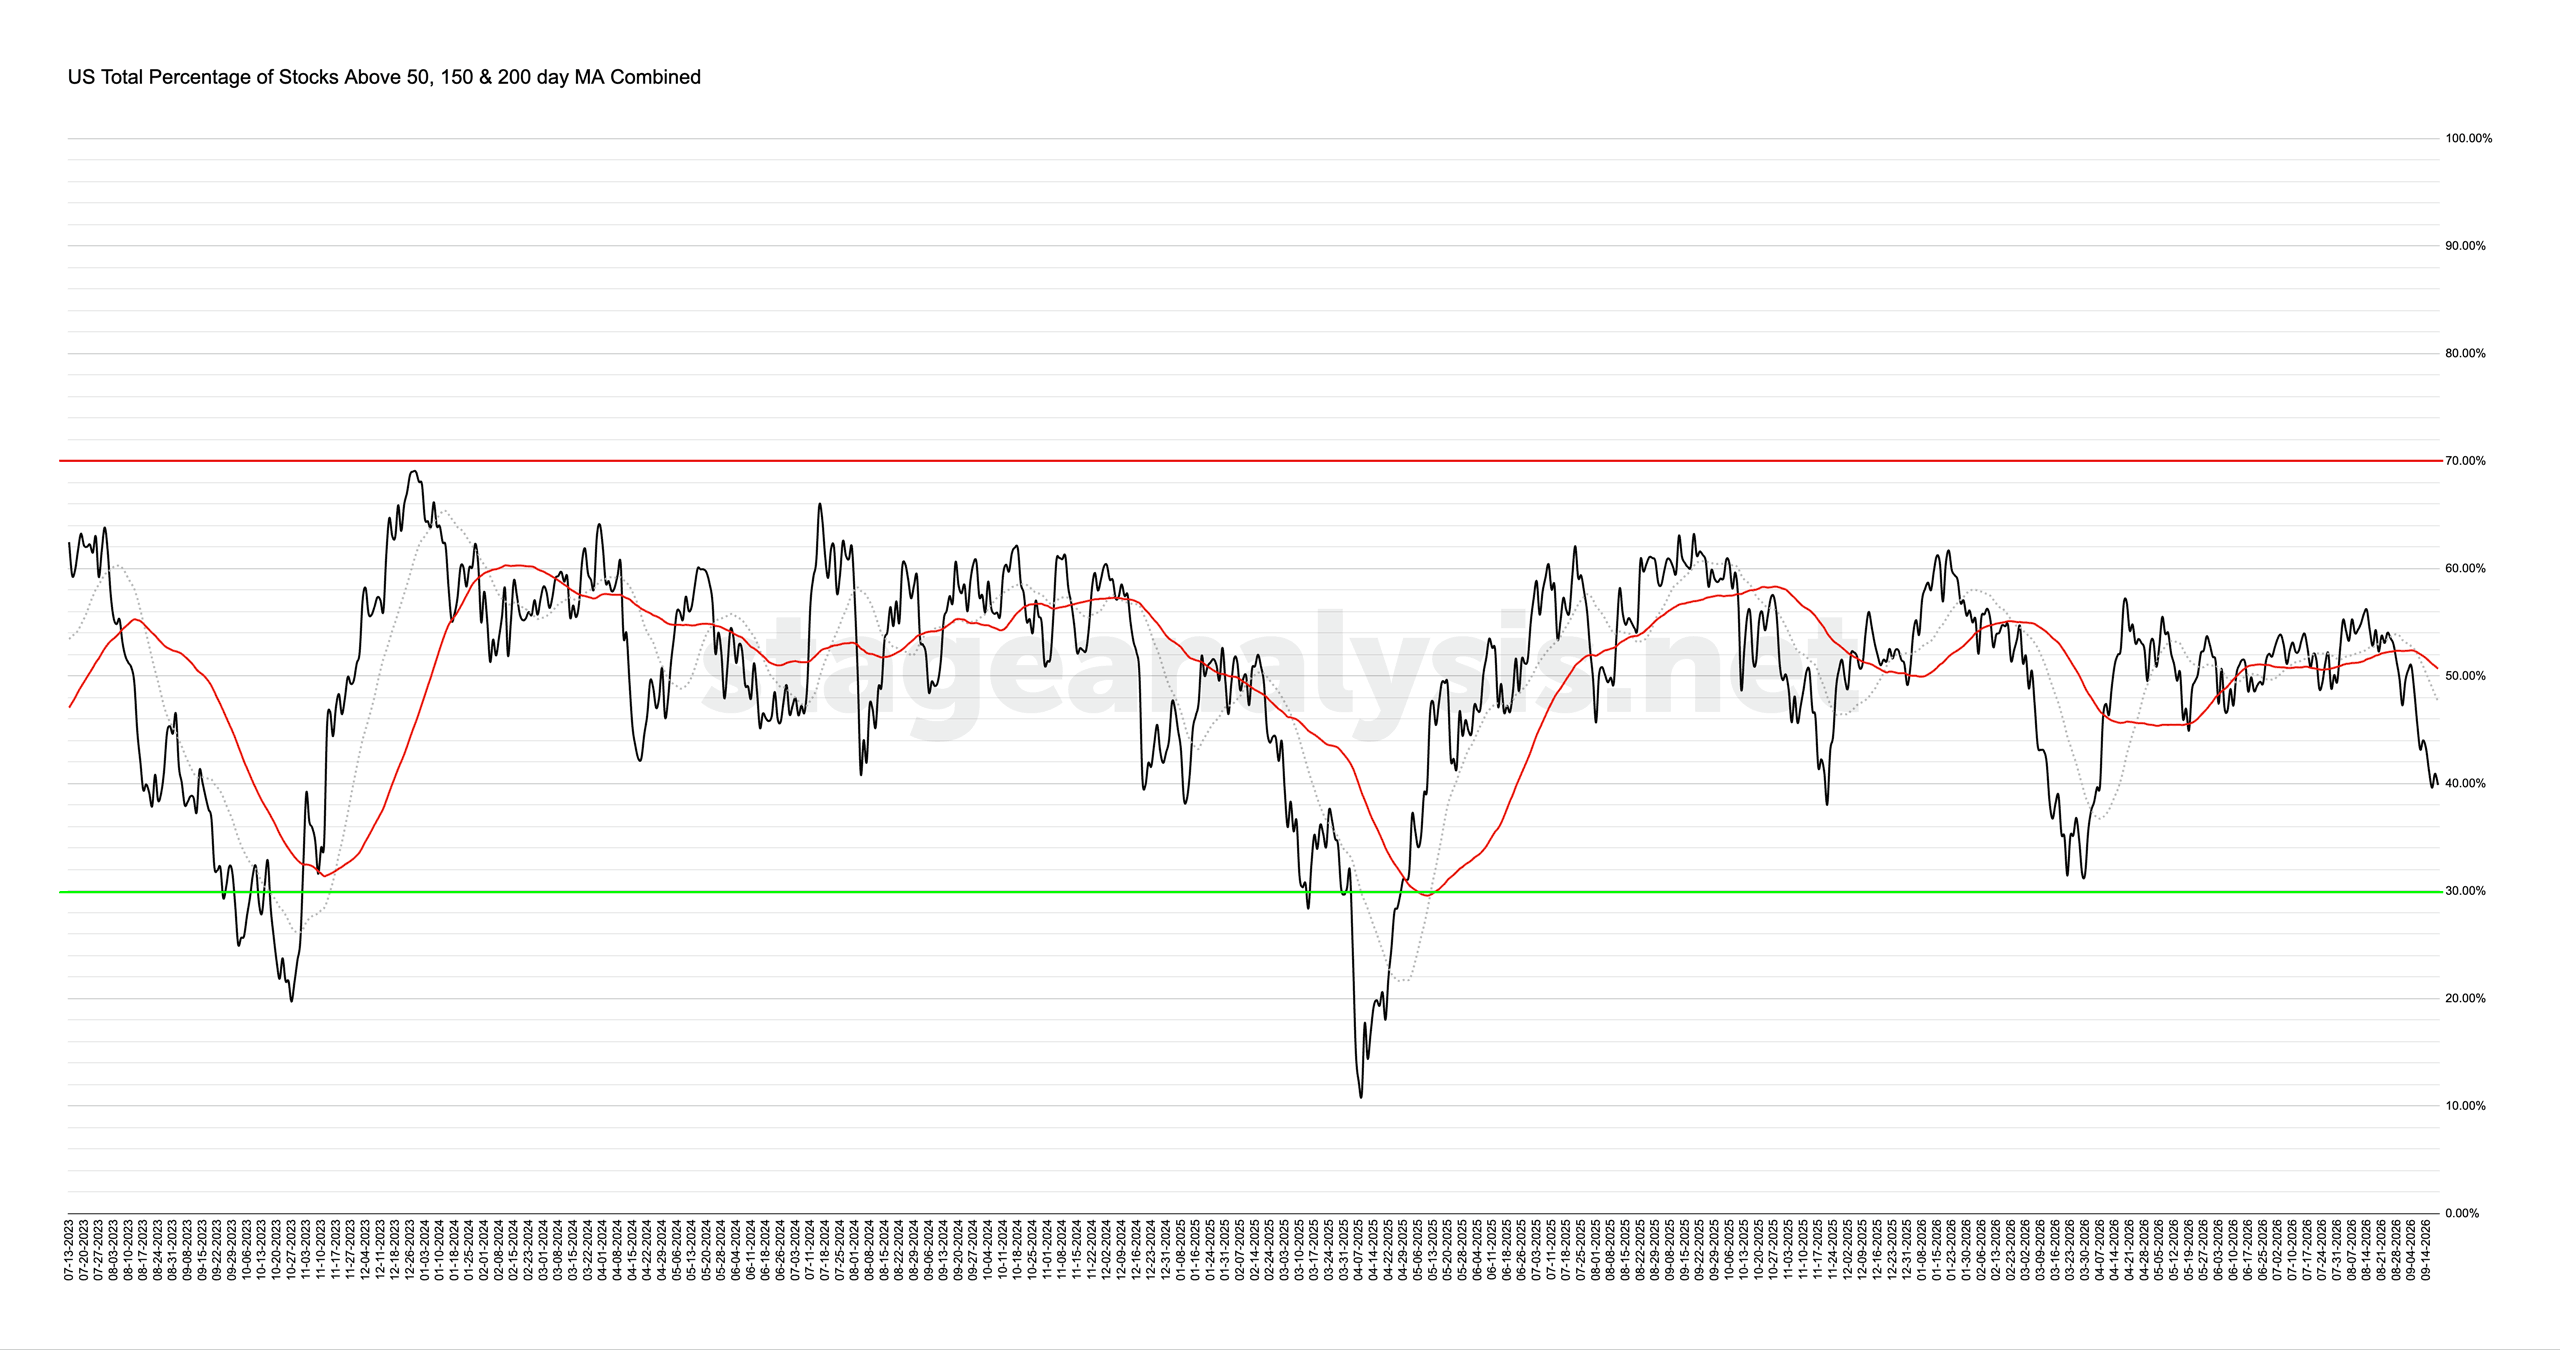
Market Breadth: Percentage of Stocks Above their 50 Day, 150 Day & 200 Day Moving Averages Combined
The US Total Percentage of Stocks above their 50 Day, 150 Day & 200 Day Moving Averages (shown above) decreased by -4.16% this week. Therefore, the overall combined average is at 39.86% in the US market (NYSE and Nasdaq markets combined) above their short, medium and long term moving averages.
Read More
18 September, 2026
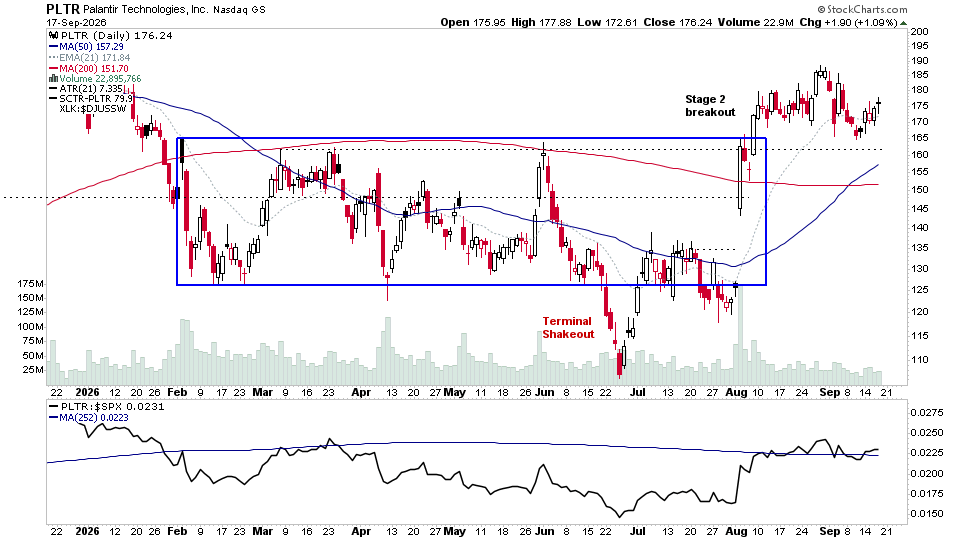
US Stocks Watchlist – 18 September 2026
There were 20 stocks highlighted from the US stocks watchlist scans today...
Read More
16 September, 2026
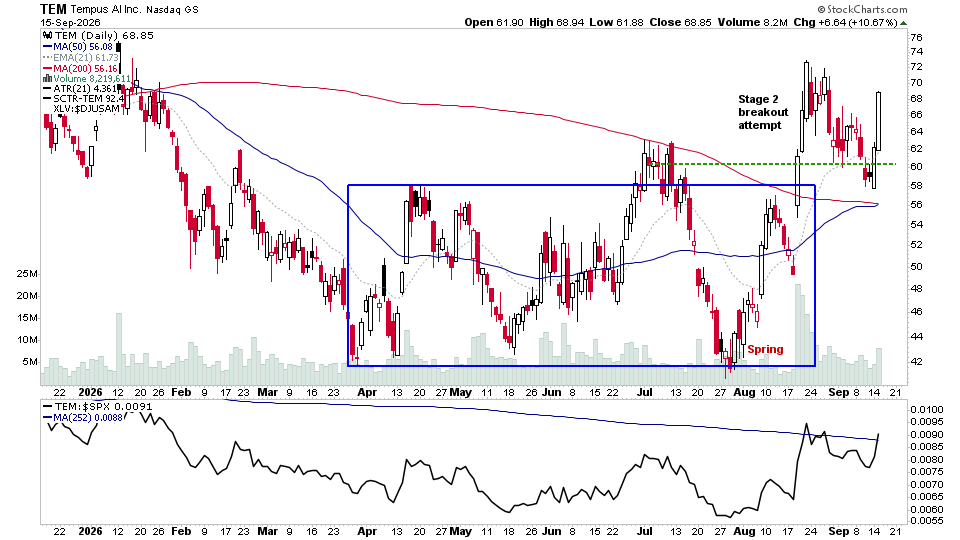
US Stocks Watchlist – 16 September 2026
There were 20 stocks highlighted from the US stocks watchlist scans today...
Read More

13 September, 2026
Stage Analysis Members Video – 13 September 2026 (59mins)
The Stage Analysis members video starting with a look at the current US Watchlist Stocks on multiple timeframes, Stages Summary, the new GICS Screener, Heatmap & Performance pages, the Sector breadth and Sub-industries Bell Curves, the key Market Breadth Charts to determine the Weight of Evidence, Bitcoin & Ethereum, the Major US Stock Market Indexes and the ETF Summary.
Read More
13 September, 2026
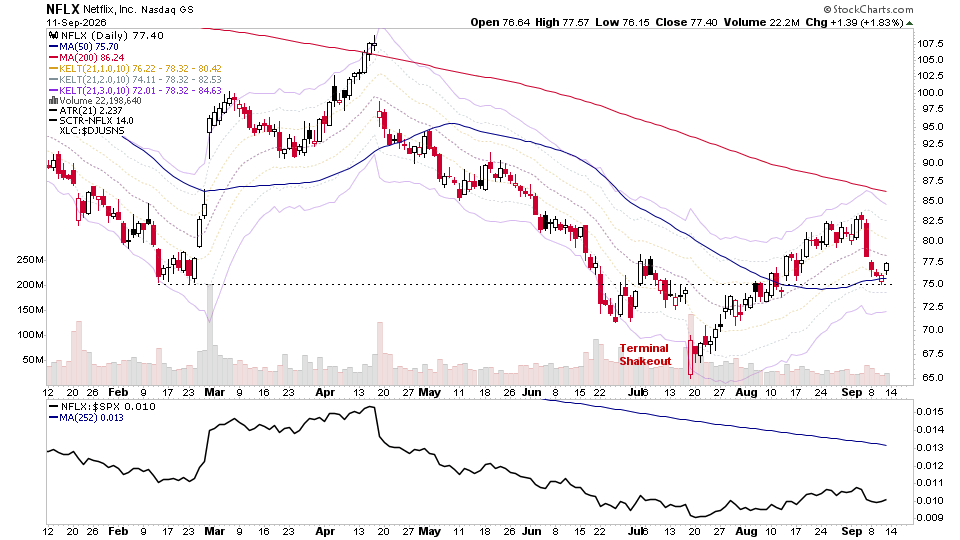
US Stocks Watchlist – 14 September 2026
There are 20 stocks highlighted from the weekends US stocks watchlist scans...
Read More

11 September, 2026
Market Breadth: Percentage of Stocks Above their 50 Day, 150 Day & 200 Day Moving Averages Combined
The US Total Percentage of Stocks above their 50 Day, 150 Day & 200 Day Moving Averages (shown above) decreased by -6.95% this week. Therefore, the overall combined average is at 44.02% in the US market (NYSE and Nasdaq markets combined) above their short, medium and long term moving averages.
Read More