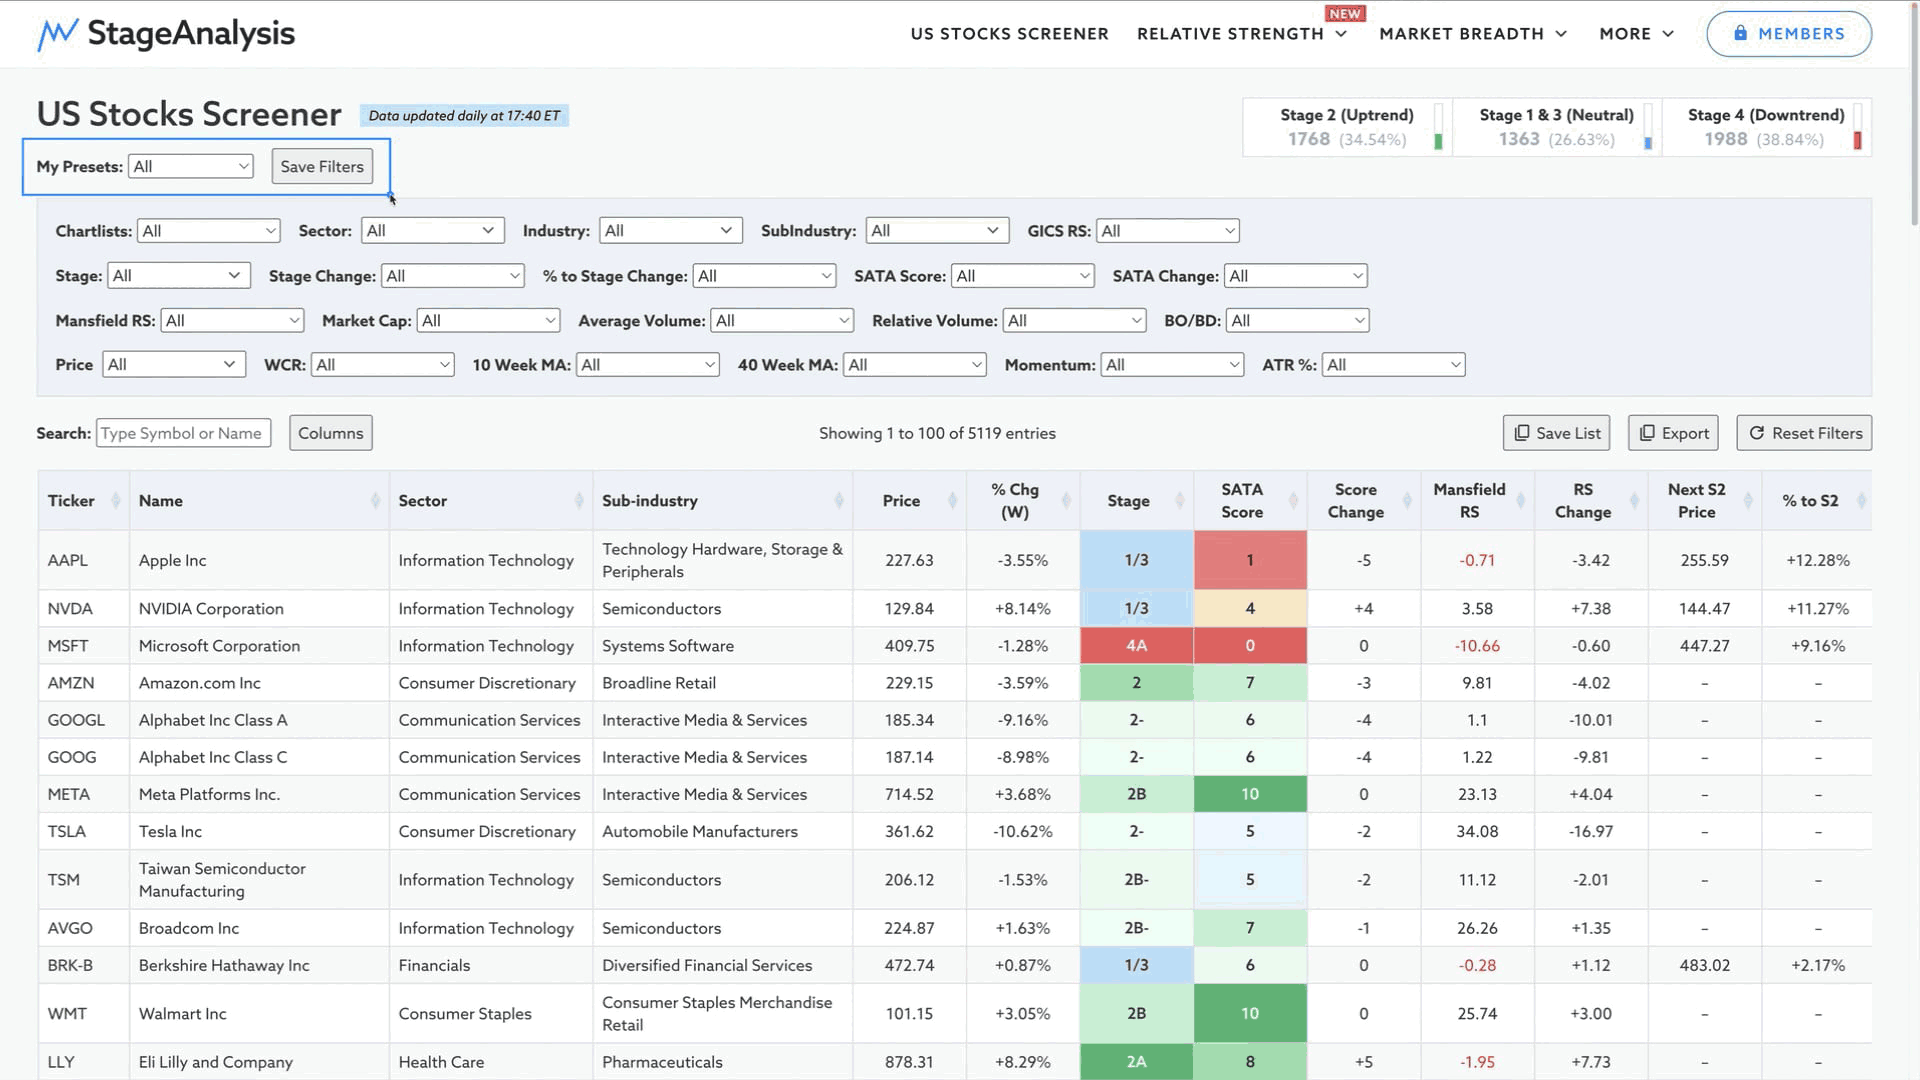
More new features have been added to the Stage Analysis Screener. So we begin the video by discussing how to use the NEW My Presets dropdown that is visible above the filters section. Followed by the US Watchlist Stocks in detail on multiple timeframes, Relative Strength Rankings, the Sector breadth and Sub-industries Bell Curves, the key Market Breadth Charts to determine the Weight of Evidence, Bitcoin & Ethereum and the Major US Stock Market Indexes Update and ETFs on the move.
Read More

Blog
09 February, 2025
Stage Analysis Members Video – 9 February 2025 (1hr)
02 February, 2025
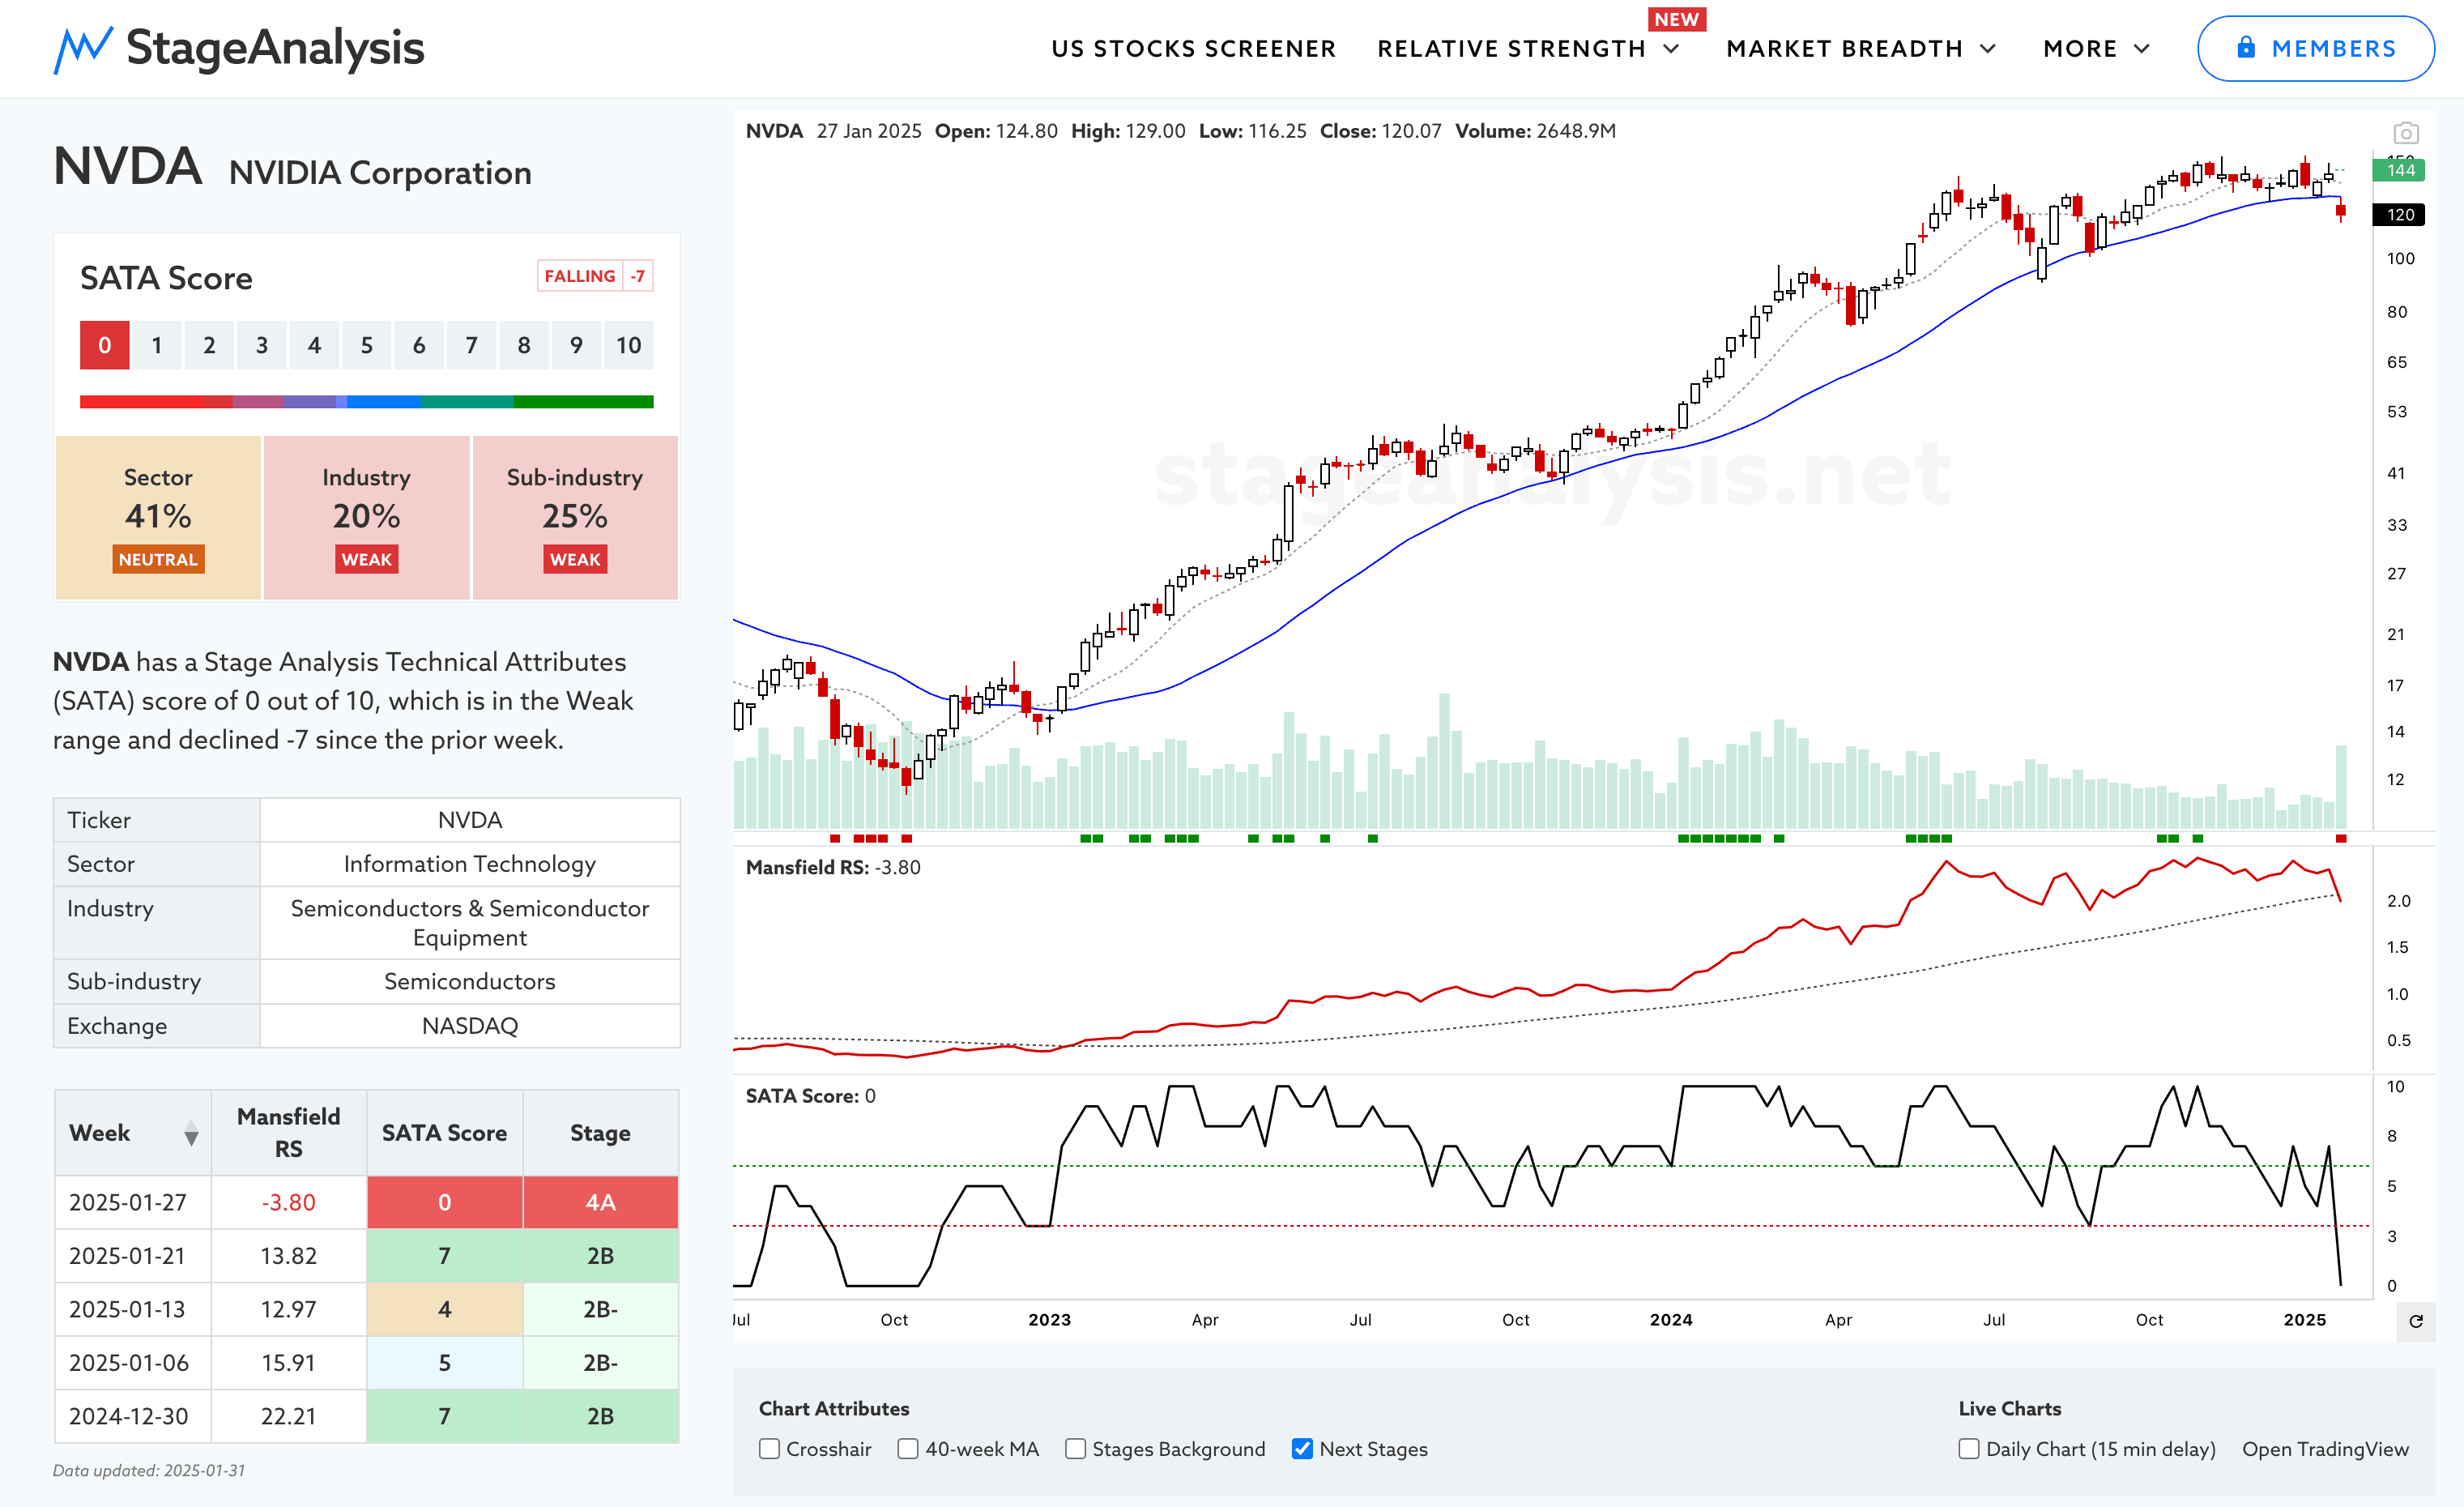
Stage Analysis Members Video – 2 February 2025 (1hr 13mins)
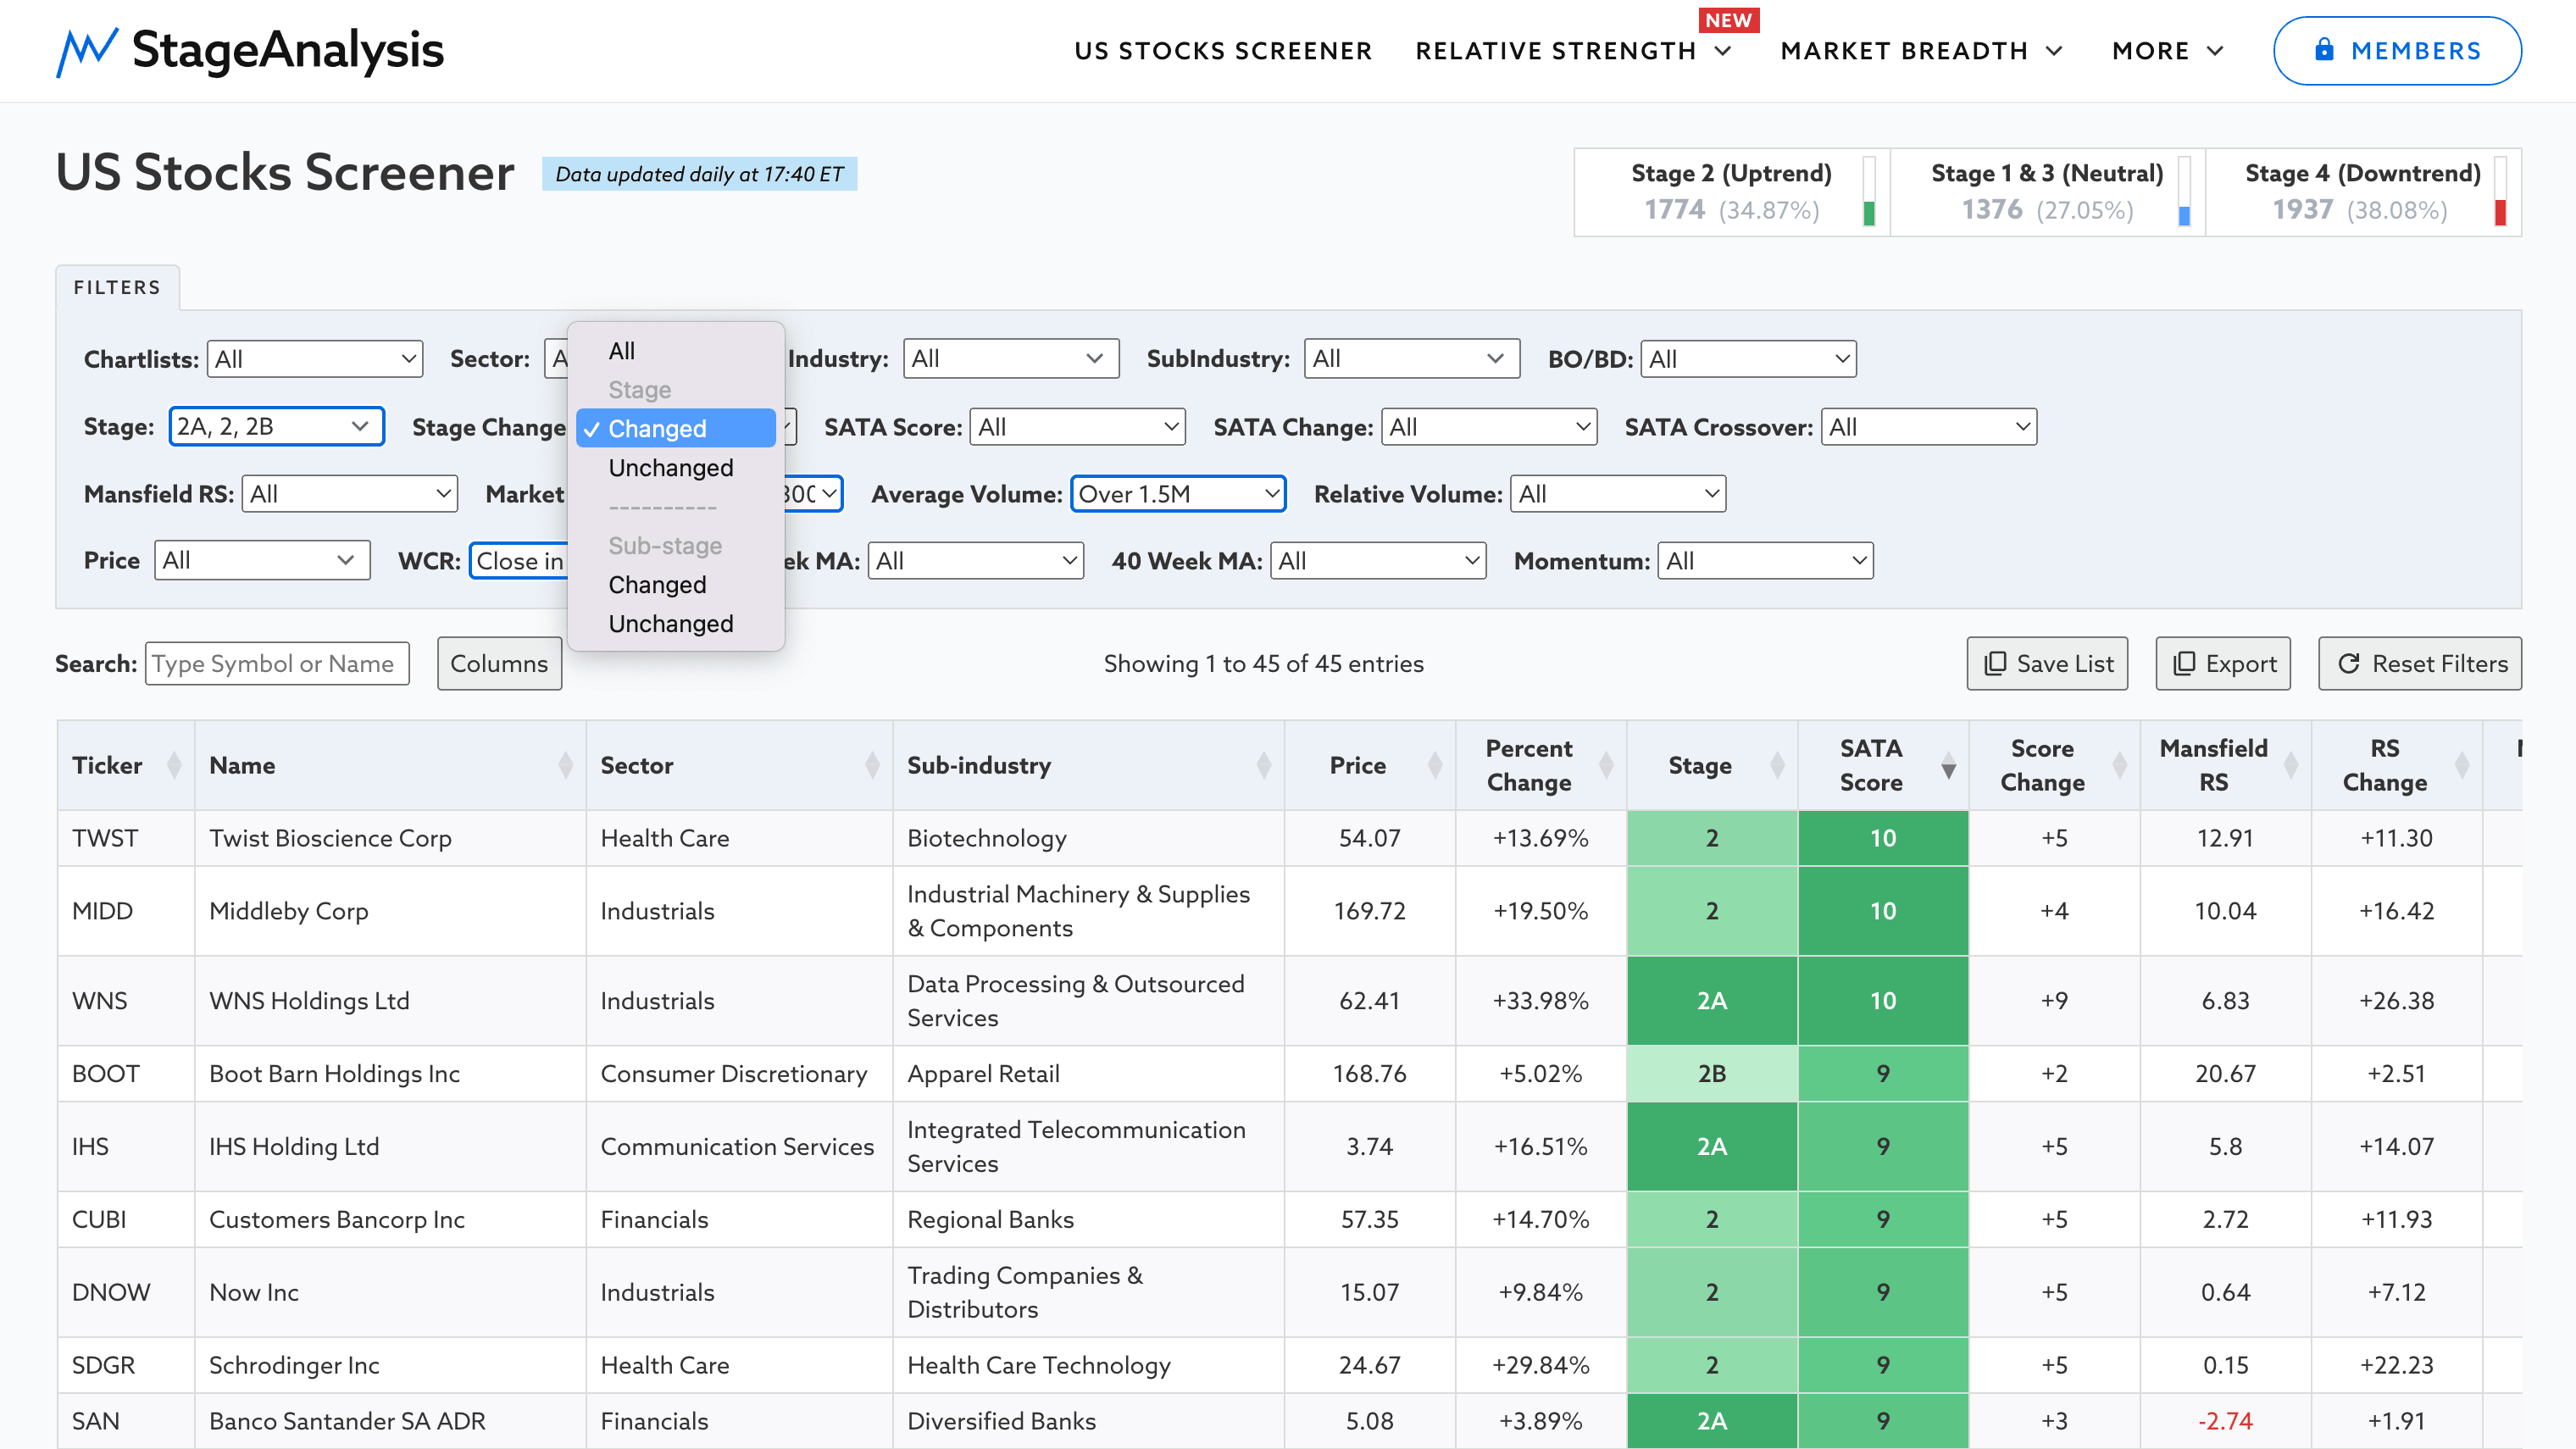
This weeks video starts with a discussion of NVDA, as it made its first Stage 4A breakdown attempt in multiple years. Followed by how to use the new screener filters to find stocks in similar positions to what I show in the US Watchlist Stocks posts each week...
Read More
26 January, 2025
Stage Analysis Members Video – 26 January 2025 (1hr 14mins)
Stage Analysis members video begins this with a look at yet more new features – Stage Change and Momentum filters, plus the new Relative Strength section. Followed by the US Watchlist Stocks in detail on multiple timeframes, the Sector breadth and Sub-industries Bell Curves, the key Market Breadth Charts to determine the Weight of Evidence, Bitcoin & Ethereum and the Major US Stock Market Indexes Update and ETFs on the move...
Read More
19 January, 2025
Stage Analysis Members Video – 19 January 2025 (1hr 4mins)
Stage Analysis members video starting with a look at the new Stage tools, followed by the US Watchlist Stocks in detail on multiple timeframes, the Sector breadth and Sub-industries Bell Curves, the key Market Breadth Charts to determine the Weight of Evidence, Bitcoin & Ethereum and the Major US Stock Market Indexes Update.
Read More
12 January, 2025
Stage Analysis Members Video – 12 January 2025 (59mins)
Stage Analysis members video starting with a look at the US Watchlist Stocks in detail on multiple timeframes, previewing the upcoming Stage 2A and Stage 4A tools for the screener, the Sector breadth and Sub-industries Bell Curves, the key Market Breadth Charts to determine the Weight of Evidence, Bitcoin & Ethereum and the Major US Stock Market Indexes Update.
Read More
05 January, 2025
Stage Analysis Members Video – 5 January 2025 (57mins)
Stage Analysis members video starting with a look at the US Watchlist Stocks in detail on multiple timeframes, the Sector breadth and Sub-industries Bell Curves, the key Market Breadth Charts to determine the Weight of Evidence, Bitcoin & Ethereum and the Major US Stock Market Indexes Update.
Read More
29 December, 2024
Stage Analysis Members Video – 29 December 2024 (54mins)
Stage Analysis members video discussing the US Watchlist Stocks in detail on multiple timeframes, the Sector breadth and Sub-industries Bell Curves, the key Market Breadth Charts to determine the Weight of Evidence, Bitcoin & Ethereum and the Major US Stock Market Indexes Update.
Read More
22 December, 2024
Stage Analysis Members Video – 22 December 2024 (1hr 11mins)
Stage Analysis members video discussing the US Watchlist Stocks in detail on multiple timeframes, the Sector breadth and Sub-industries Bell Curves, the key Market Breadth Charts to determine the Weight of Evidence, the Significant Bars, Bitcoin & Ethereum and the Major US Stock Market Indexes Update.
Read More
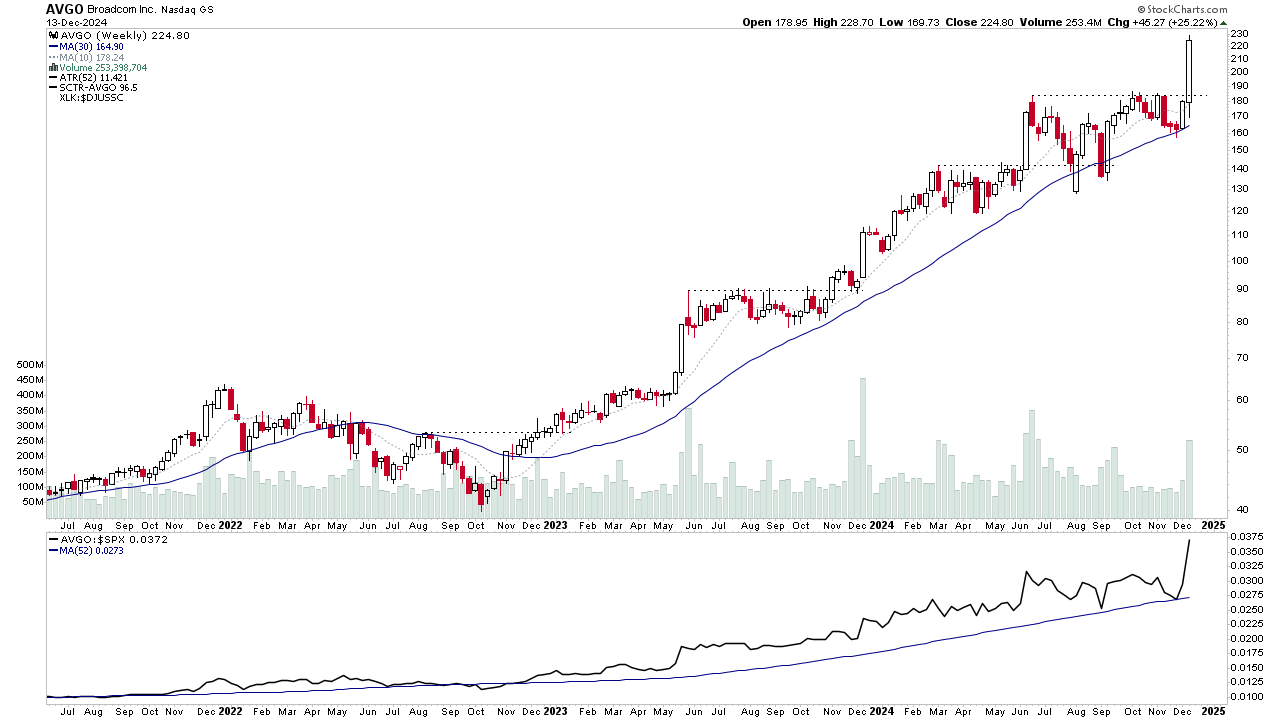
15 December, 2024
Stage Analysis Members Video – 15 December 2024 (59mins)
Stage Analysis members video discussing the Significant Bars, then the US Watchlist Stocks in detail on multiple timeframes, the Sector breadth and Sub-industries Bell Curves, the key Market Breadth Charts to determine the Weight of Evidence, Bitcoin & Ethereum and the Major US Stock Market Indexes Update.
Read More
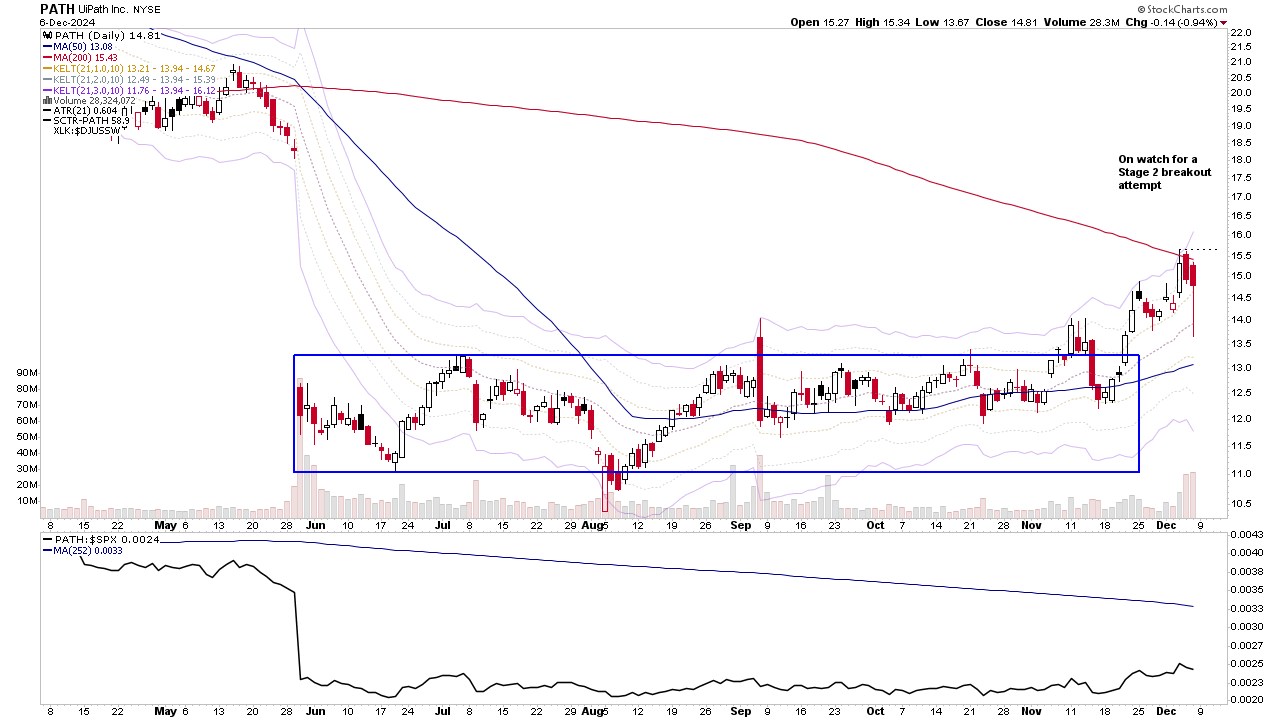
08 December, 2024
Stage Analysis Members Video – 8 December 2024 (1hr 3mins)
Stage Analysis members video discussing the US Watchlist Stocks in detail on multiple timeframes, the Sector breadth and Sub-industries Bell Curves, the key Market Breadth Charts to determine the Weight of Evidence, the Significant Bars, Bitcoin & Ethereum and the Major US Stock Market Indexes Update.
Read More