The Stage Analysis members video discussing the current US Watchlist Stocks on multiple timeframes, Stage 2 Breakout & Stage 4 Breakdown attempts, Stages Summary, the Sector breadth and Sub-industries Bell Curves, Relative Strength Rankings, the key Market Breadth Charts to determine the Weight of Evidence, Bitcoin & Ethereum, the Major US Stock Market Indexes and ETF Summary.
Read More

Blog

10 May, 2026
Stage Analysis Members Video – 10 May 2026 (1hr)

03 May, 2026
Stage Analysis Members Video – 3 May 2026 (1hr 17mins)
The Stage Analysis members video beginning with a discussion of the current US Watchlist Stocks on multiple timeframes, Stage 2 Breakout & Stage 4 Breakdown attempts, Stages Summary, the Sector breadth and Sub-industries Bell Curves, Relative Strength Rankings, the key Market Breadth Charts to determine the Weight of Evidence, Bitcoin & Ethereum, the Major US Stock Market Indexes and ETF Summary.
Read More

26 April, 2026
Stage Analysis Members Video – 26 April 2026 (55mins)
The Stage Analysis members video starts with a discussion of the current US Watchlist Stocks on multiple timeframes, Stage 2 Breakout & Stage 4 Breakdown attempts, Stages Summary, the Sector breadth and Sub-industries Bell Curves, Relative Strength Rankings, the key Market Breadth Charts to determine the Weight of Evidence, Bitcoin & Ethereum, the Major US Stock Market Indexes and ETF Summary.
Read More

19 April, 2026
Stage Analysis Members Video – 19 April 2026 (1hr 9mins)
The Stage Analysis members video begins with a look at the NEW UK Stage Analysis website which launched on Saturday. Followed by the current US Watchlist Stocks on multiple timeframes, Stage 2 Breakout & Stage 4 Breakdown attempts, Stages Summary, the Sector breadth and Sub-industries Bell Curves, Relative Strength Rankings, the key Market Breadth Charts to determine the Weight of Evidence, Bitcoin & Ethereum, the Major US Stock Market Indexes, ETF Summary.
Read More

12 April, 2026
Stage Analysis Members Video – 12 April 2026 (1hr 2mins)
The Stage Analysis members video begins with a look at the current US Watchlist Stocks on multiple timeframes, Stage 2 Breakout & Stage 4 Breakdown attempts, Stages Summary, the Sector breadth and Sub-industries Bell Curves, Relative Strength Rankings, the key Market Breadth Charts to determine the Weight of Evidence, Bitcoin & Ethereum, the Major US Stock Market Indexes, ETF Summary and brief look at the NEW UK Stage Analysis website, which is due to launch in the next few weeks.
Read More

05 April, 2026
Stage Analysis Members Video – 5 April 2026 (54mins)
The Stage Analysis members video begins with a discussion of US Watchlist Stocks on multiple timeframes, Stage 2 Breakout & Stage 4 Breakdown attempts, Stages Summary, the Sector breadth and Sub-industries Bell Curves, Relative Strength Rankings, the key Market Breadth Charts to determine the Weight of Evidence, Bitcoin & Ethereum, the Major US Stock Market Indexes and ETF Summary.
Read More
29 March, 2026
Stage Analysis Members Video – 29 March 2026 (52mins)
The Stage Analysis members video begins this week with a discussion of the Major US Stock Market Indexes on multiple timeframes, Stage 2 Breakout & Stage 4 Breakdown attempts, Stages Summary, the Sector breadth and Sub-industries Bell Curves, Relative Strength Rankings, the key Market Breadth Charts to determine the Weight of Evidence, Bitcoin & Ethereum and ETF Summary.
Read More
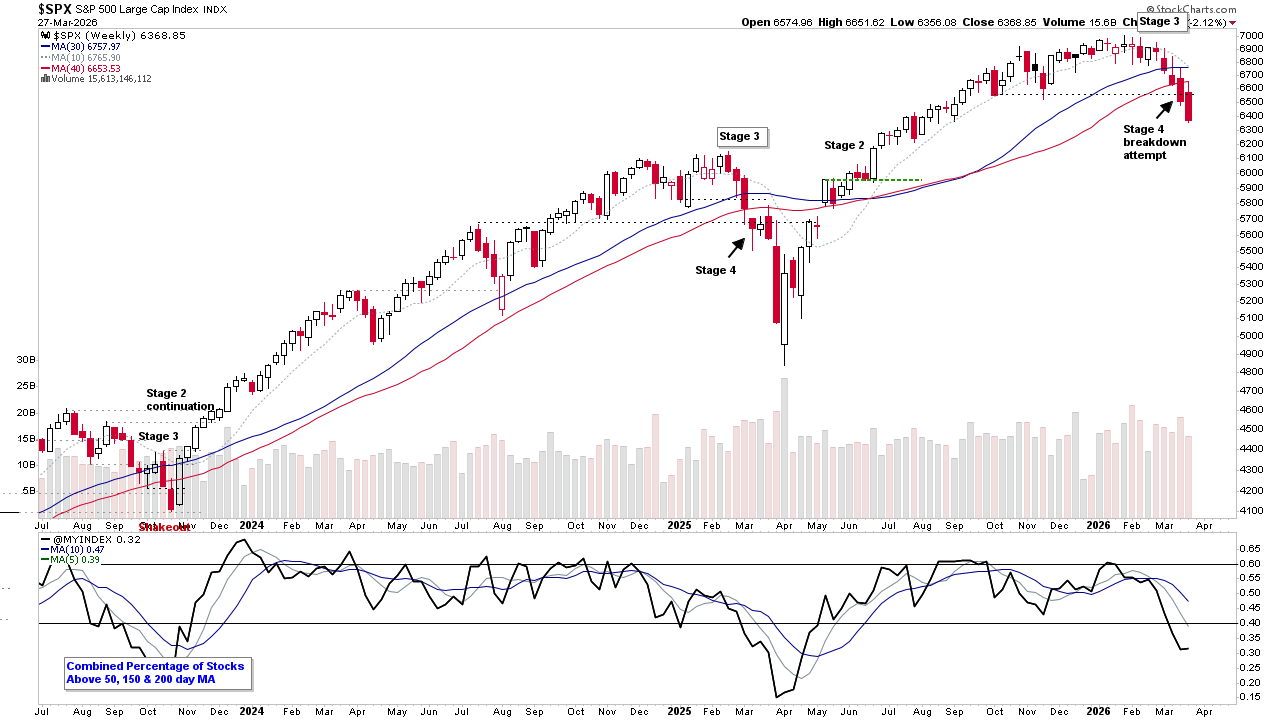
22 March, 2026
Video: Multiple Stage 4 Breakdown Attempts in Major US Market Indexes – SPY, QQQ, VTI... (50mins)
The Stage Analysis members video begins this week with a discussion of the the Major US Stock Market Indexes on multiple timeframes as multiple indexes are making potential Stage 4 breakdown attempts. Then reviewing last weeks Stage 2 Breakout & Stage 4 Breakdown attempts, SATA Bullish Percent Index, Stages Summary, the Sector breadth and Sub-industries Bell Curves, Relative Strength Rankings, the key Market Breadth Charts to determine the Weight of Evidence, Bitcoin & Ethereum and ETF Summary.
Read More
15 March, 2026
Stage Analysis Weekend Video – 15 March 2026 (38mins)
The Stage Analysis weekend video discussing the Major US Stock Market Indexes, Stage 2 Breakout & Stage 4 Breakdown attempts, Stages Summary, the Sector breadth and Sub-industries Bell Curves, Relative Strength Rankings, the key Market Breadth Charts to determine the Weight of Evidence and ETF Summary.
Read More

07 March, 2026
Stage Analysis Members Video – 8 March 2026 (59mins)
The Stage Analysis members video begins this week with a discussion of the most liquid US stock on multiple timeframes, Stage 2 Breakout & Stage 4 Breakdown attempts, Stages Summary, the Sector breadth and Sub-industries Bell Curves, Relative Strength Rankings, the key Market Breadth Charts to determine the Weight of Evidence, Bitcoin & Ethereum, the Major US Stock Market Indexes and ETF Summary.
Read More