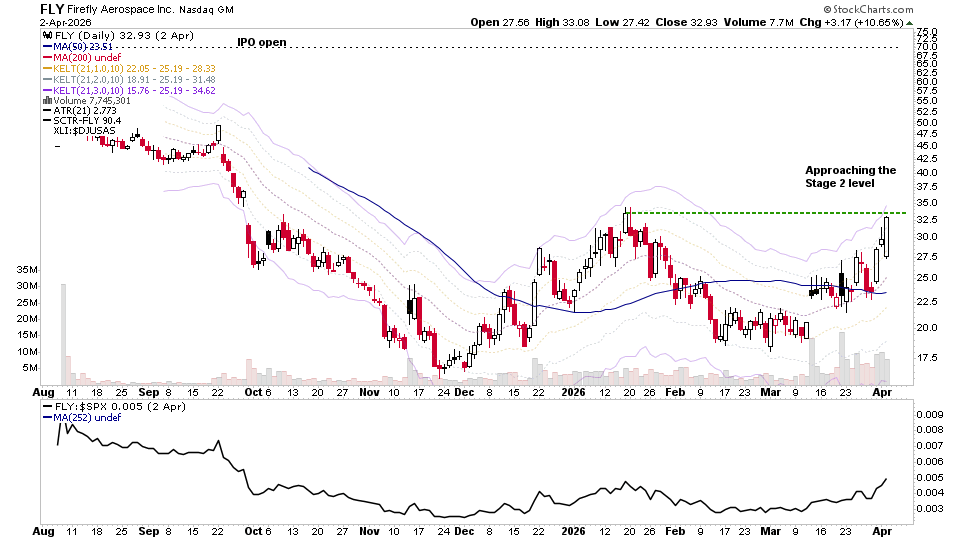
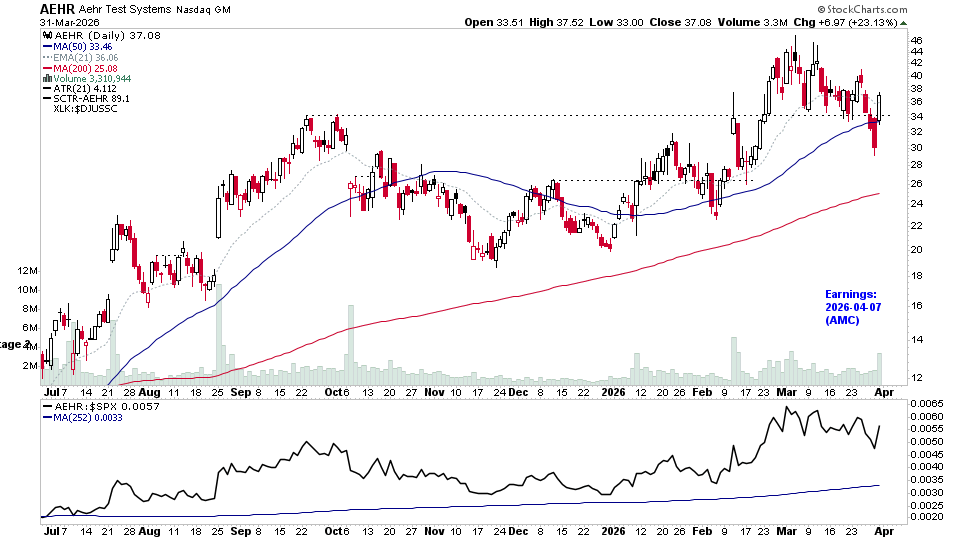
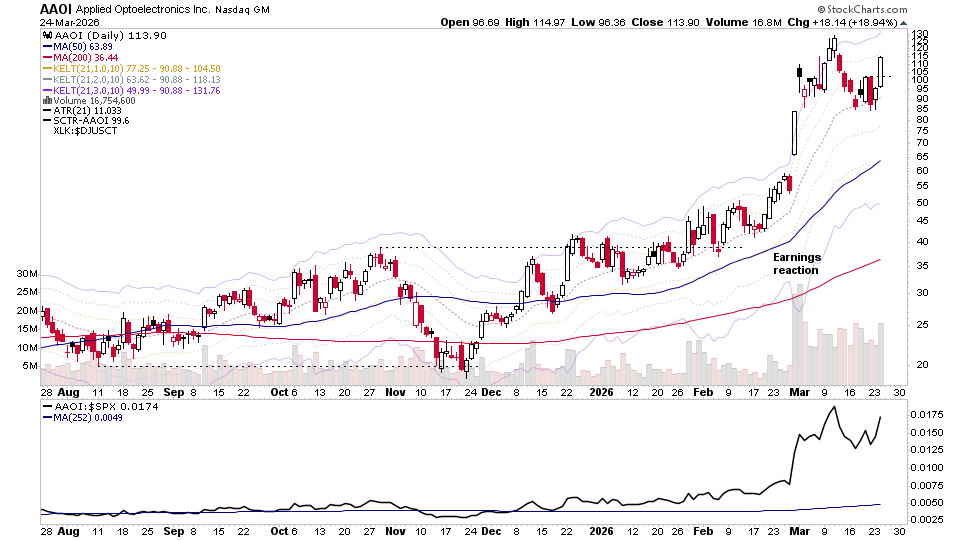
There are 20 stocks highlighted from the weekends US stocks watchlist scans...
Read More

Blog
05 April, 2026
US Stocks Watchlist – 6 April 2026

04 April, 2026
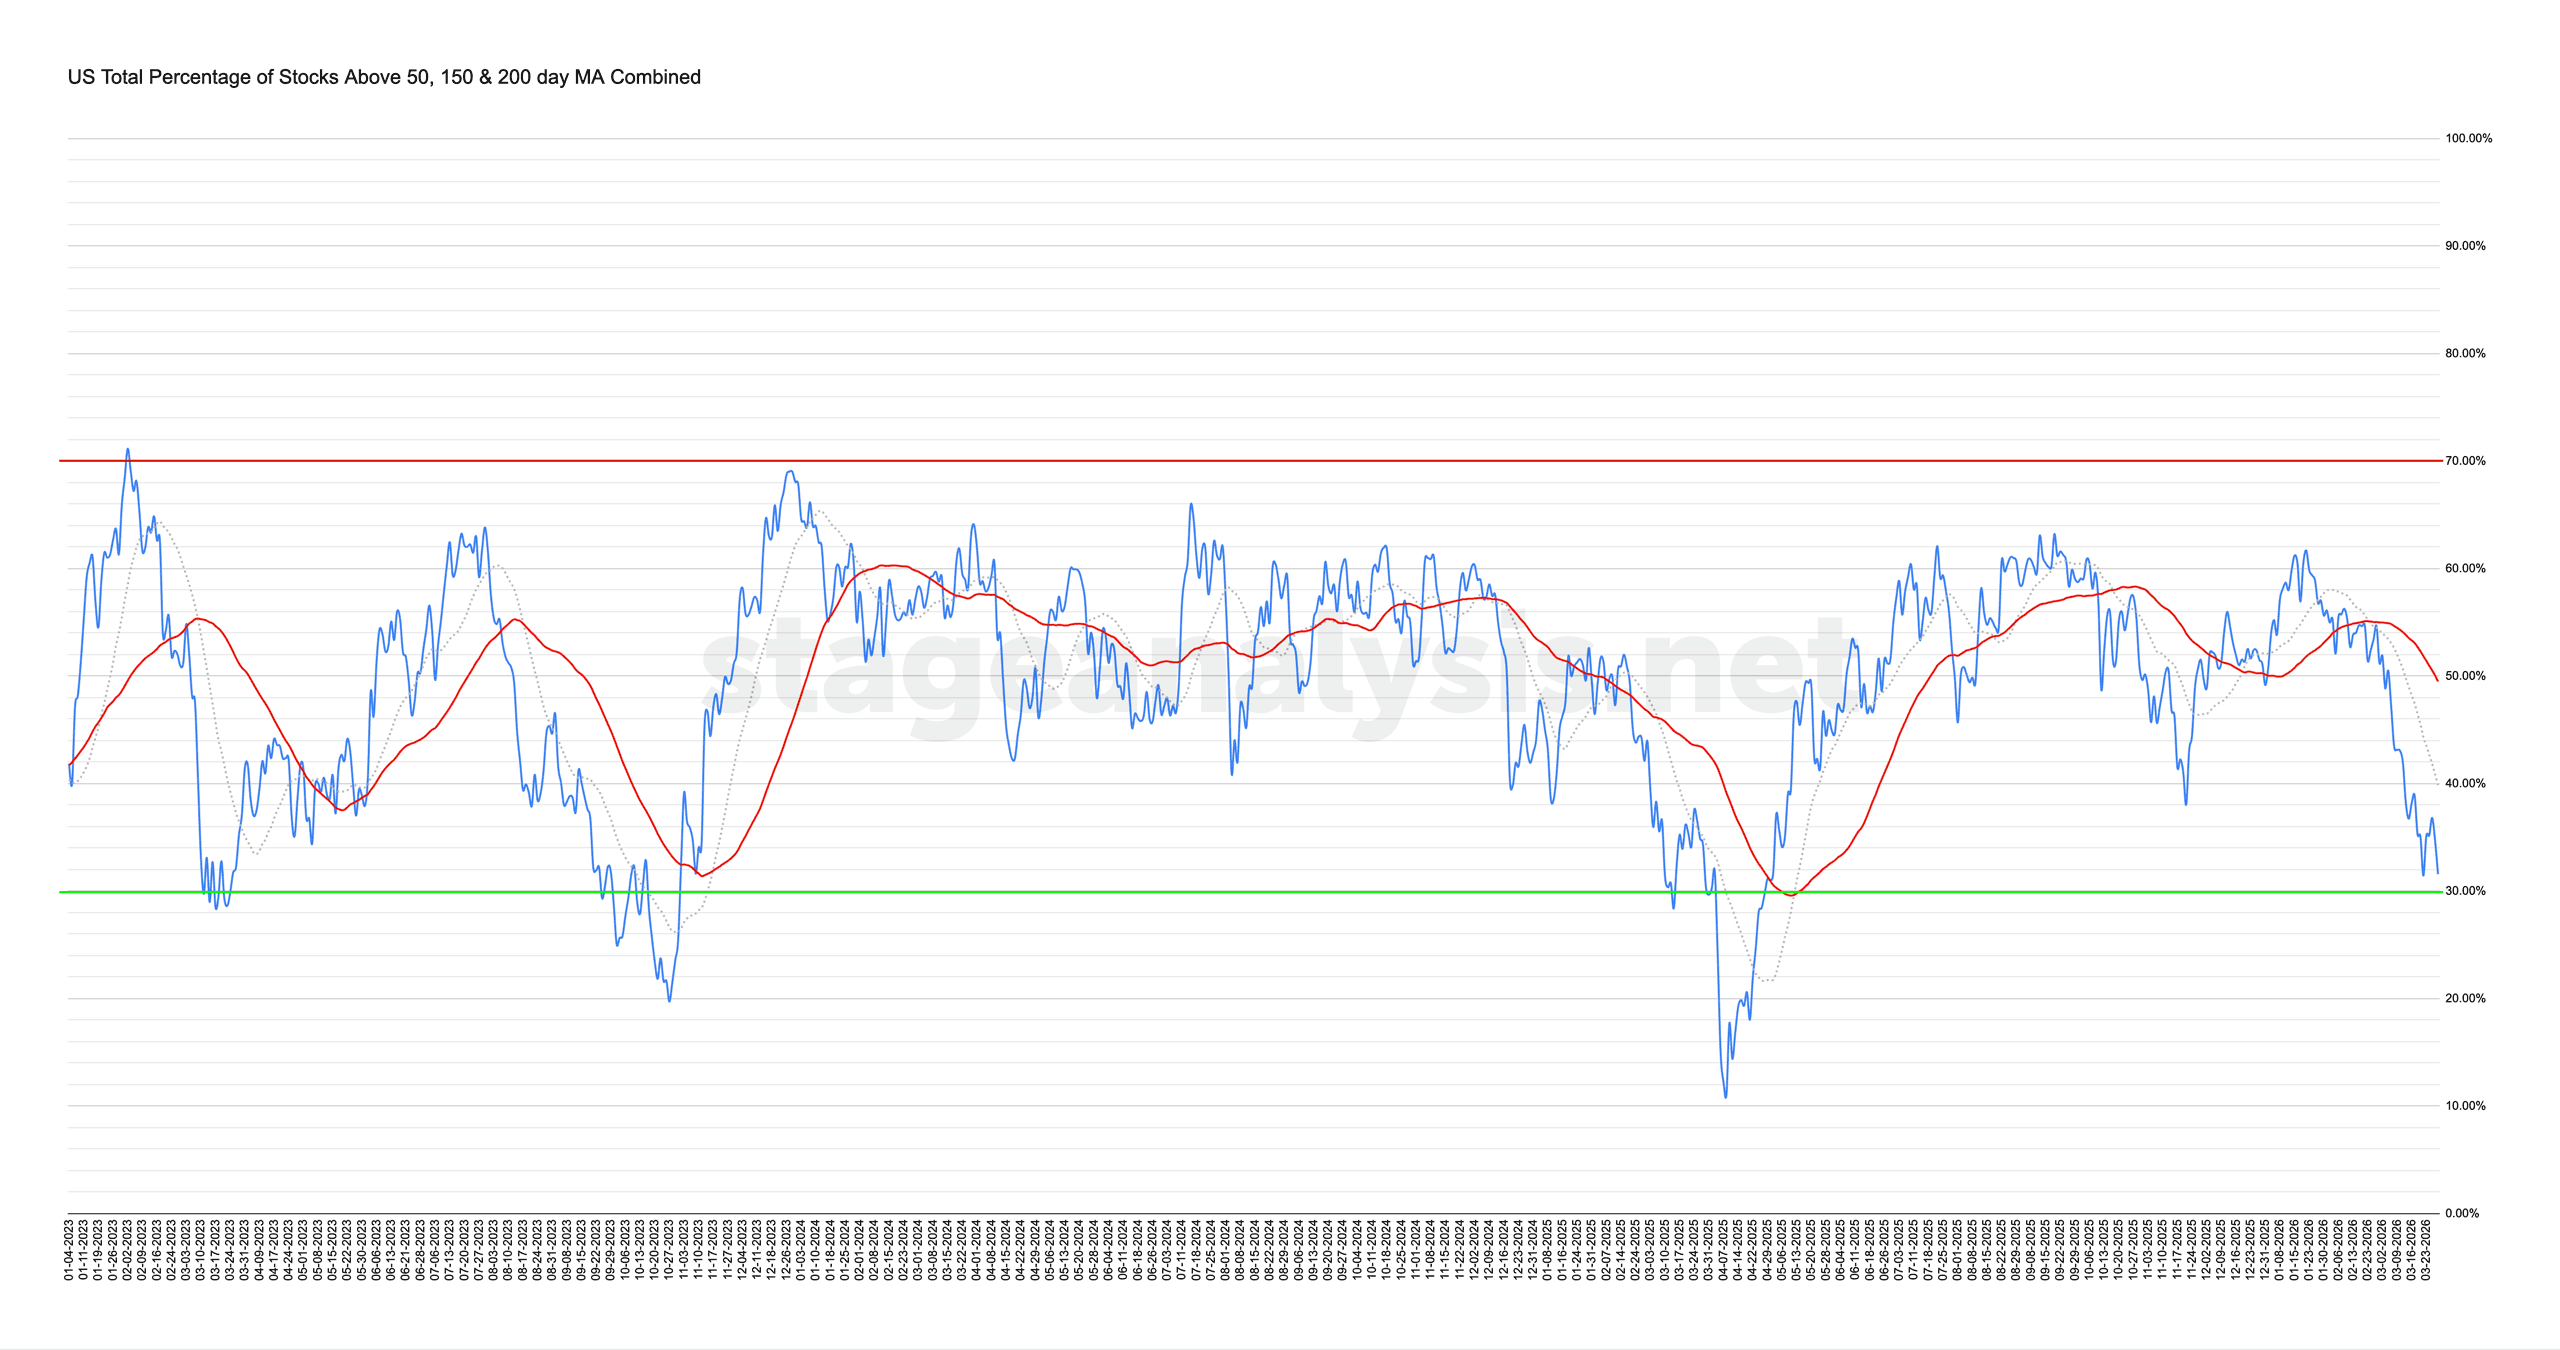
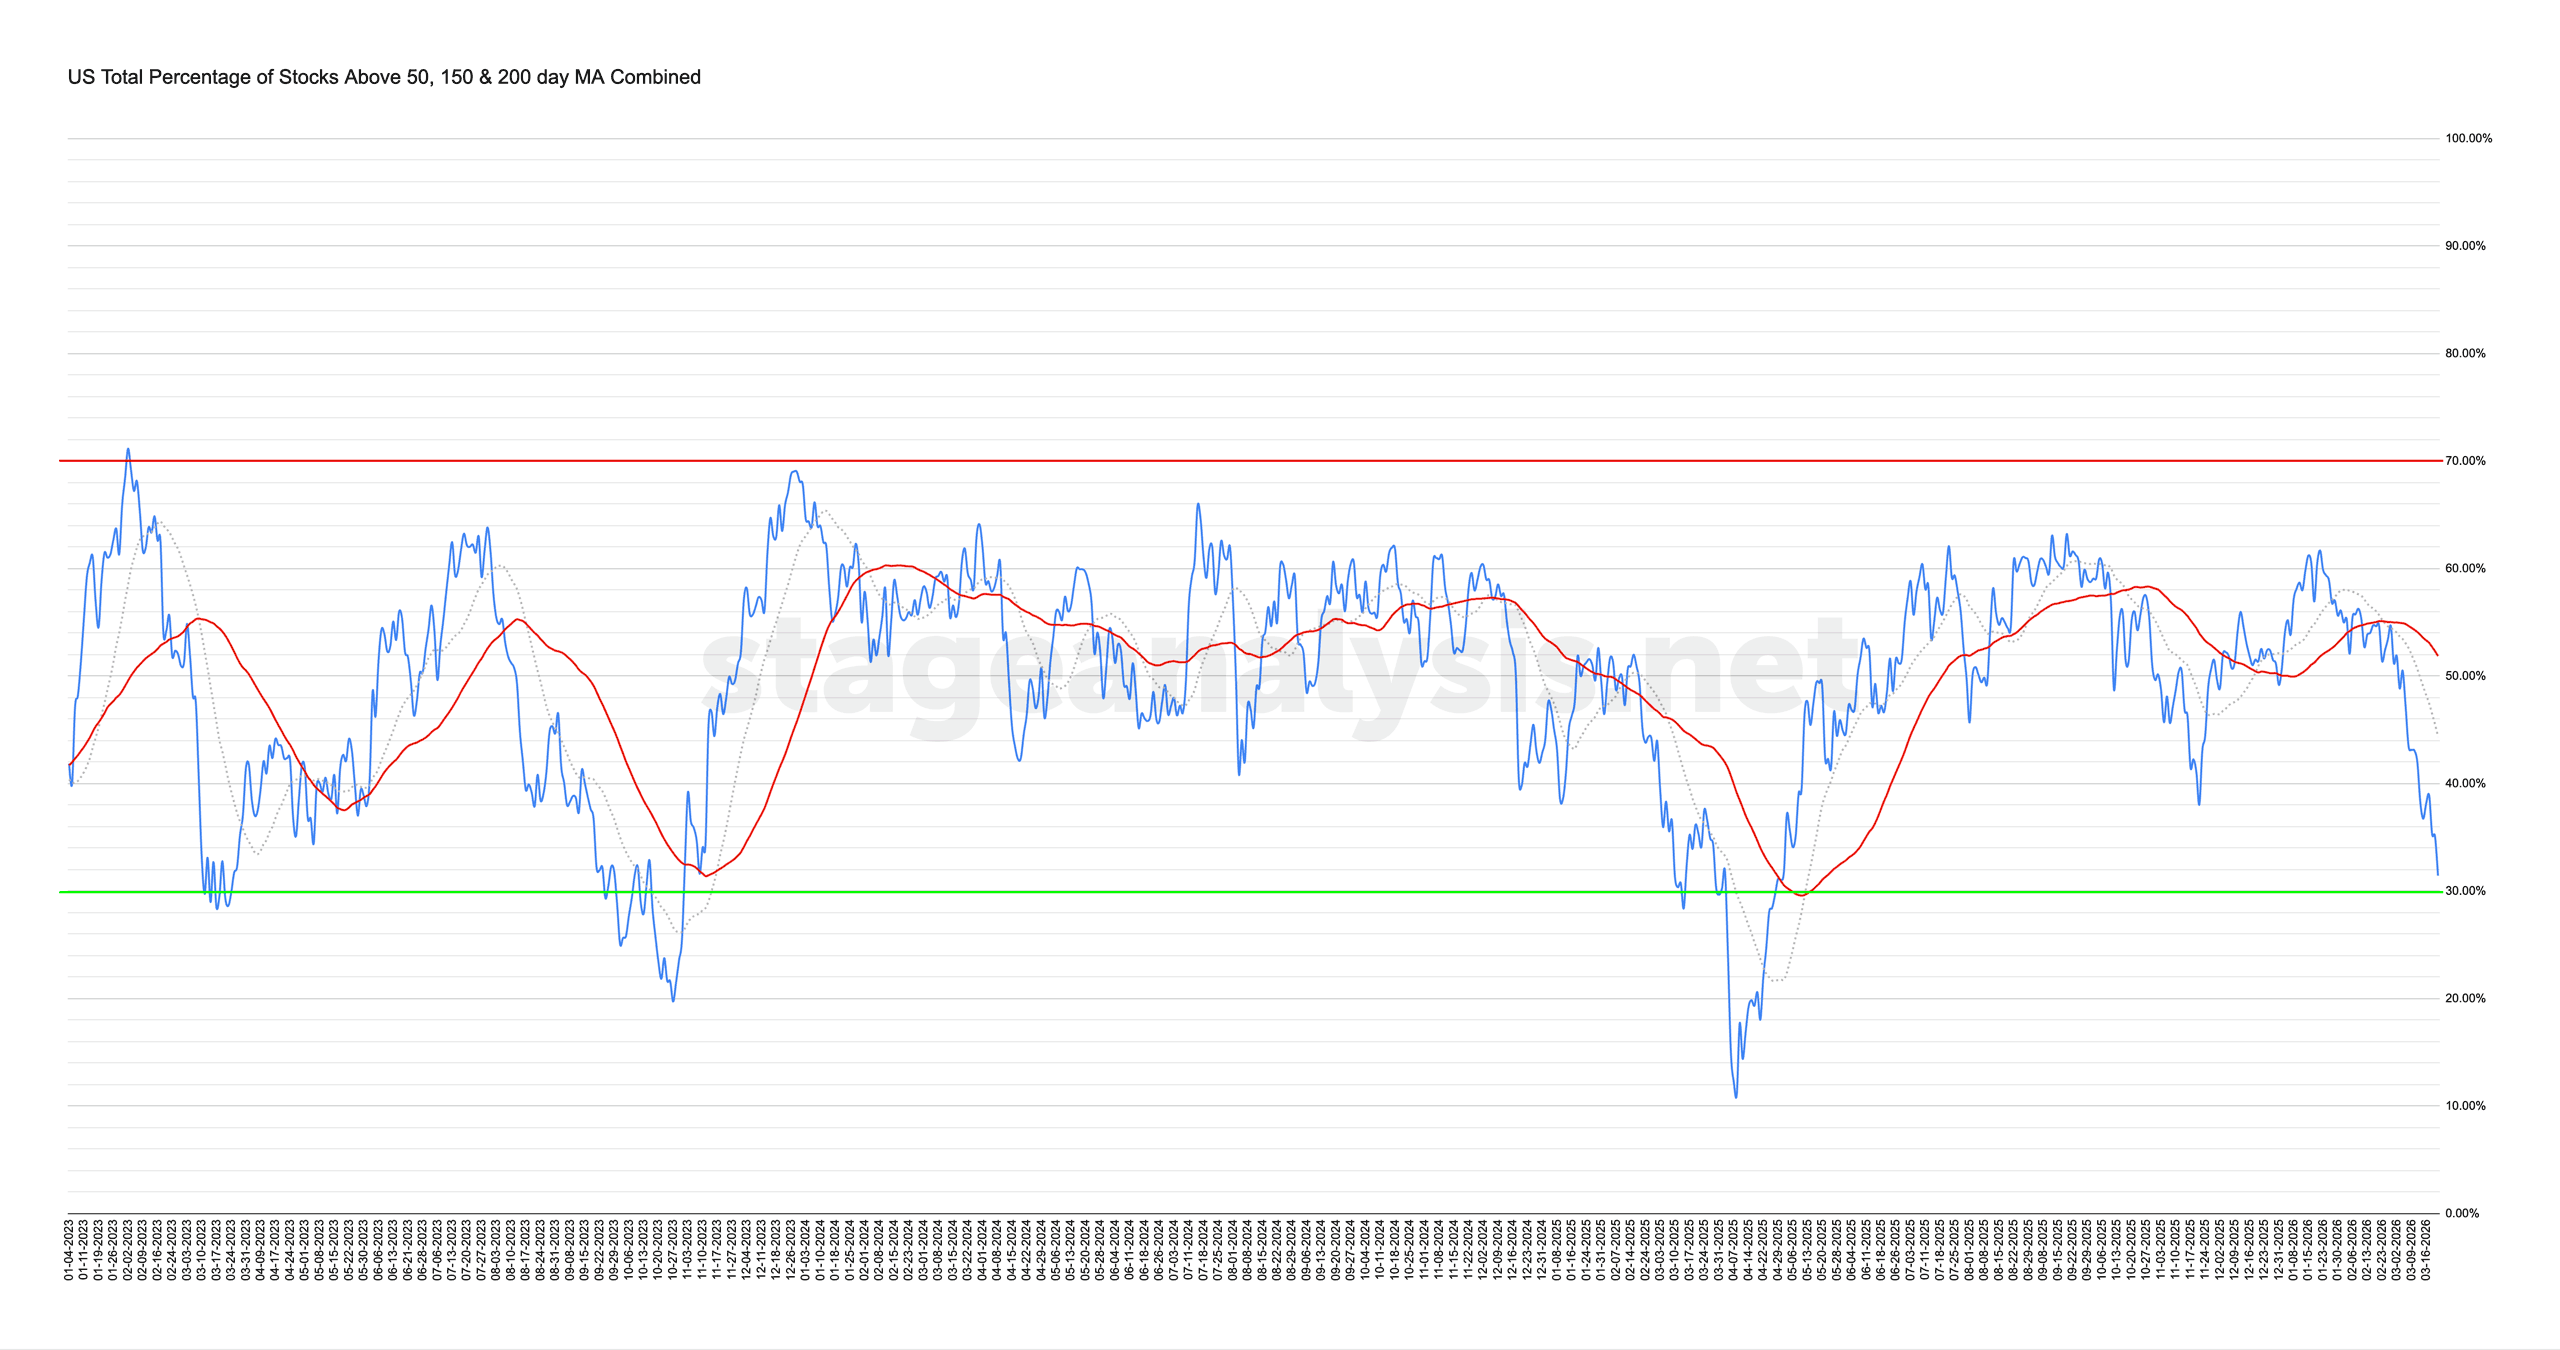
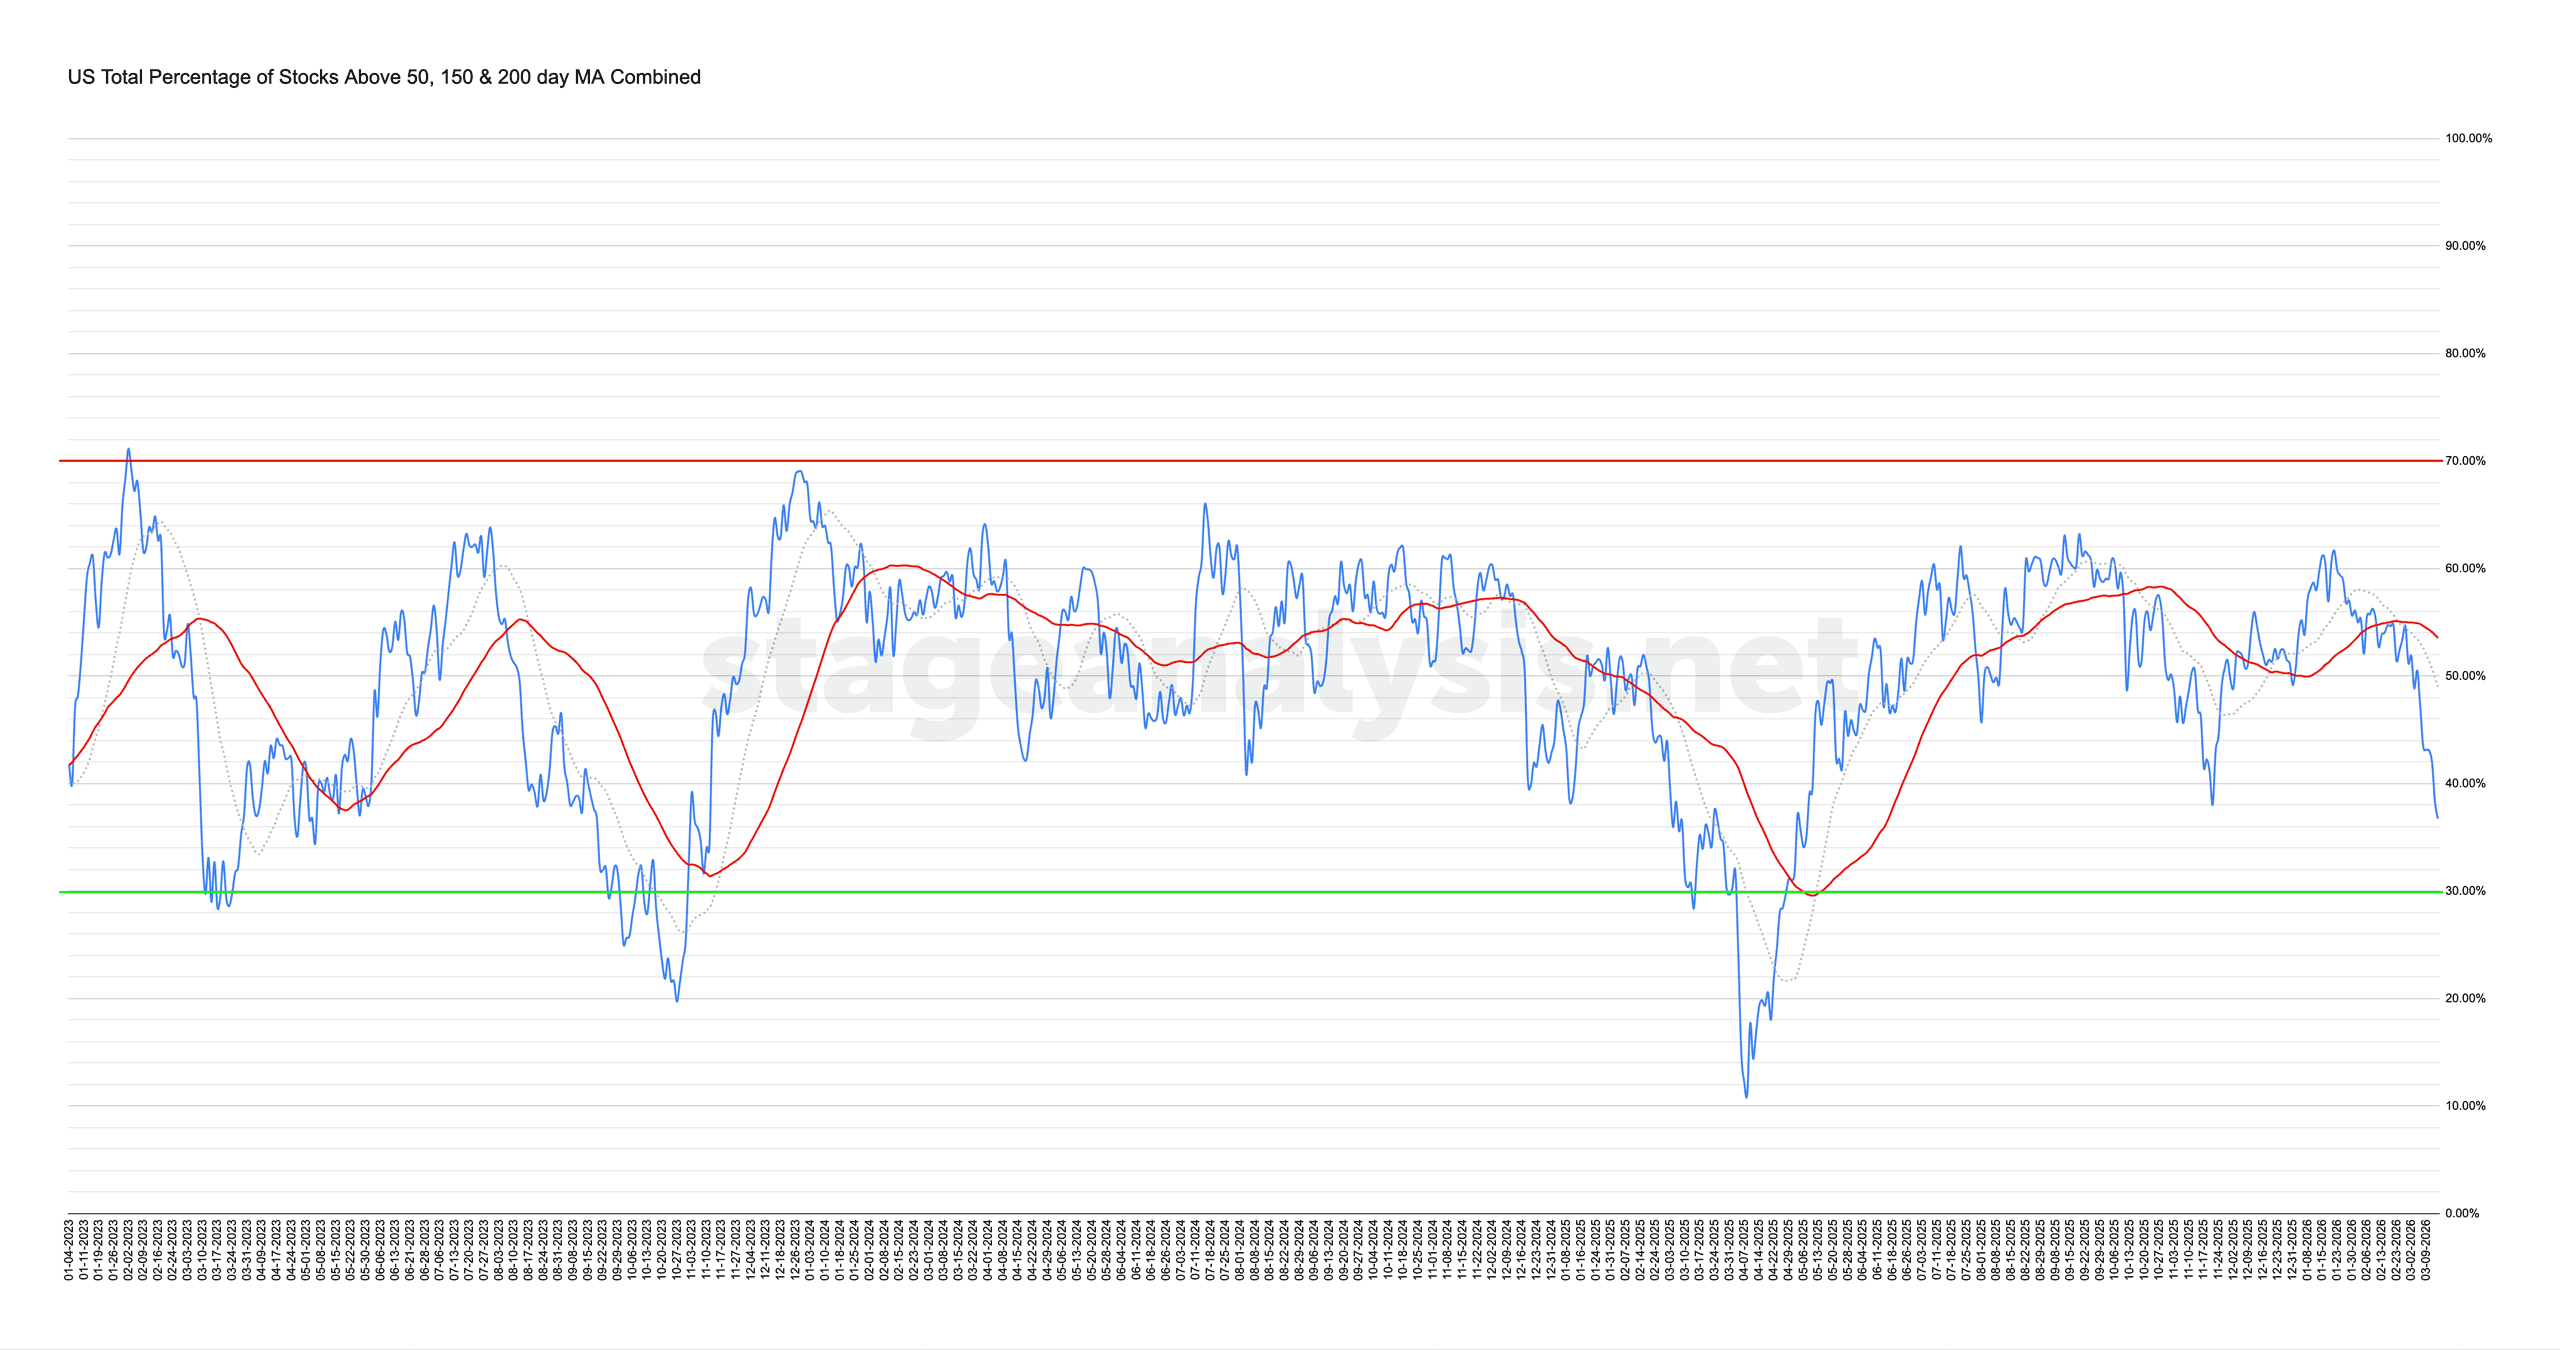
Market Breadth: Percentage of Stocks Above their 50 Day, 150 Day & 200 Day Moving Averages Combined
The US Total Percentage of Stocks above their 50 Day, 150 Day & 200 Day Moving Averages (shown above) increased by +6.70% this week. Therefore, the overall combined average is at 38.27% in the US market (NYSE and Nasdaq markets combined) above their short, medium and long term moving averages.
Read More
01 April, 2026
US Stocks Watchlist – 1 April 2026
There were 21 stocks highlighted from the US stocks watchlist scans today...
Read More
29 March, 2026
Stage Analysis Members Video – 29 March 2026 (52mins)
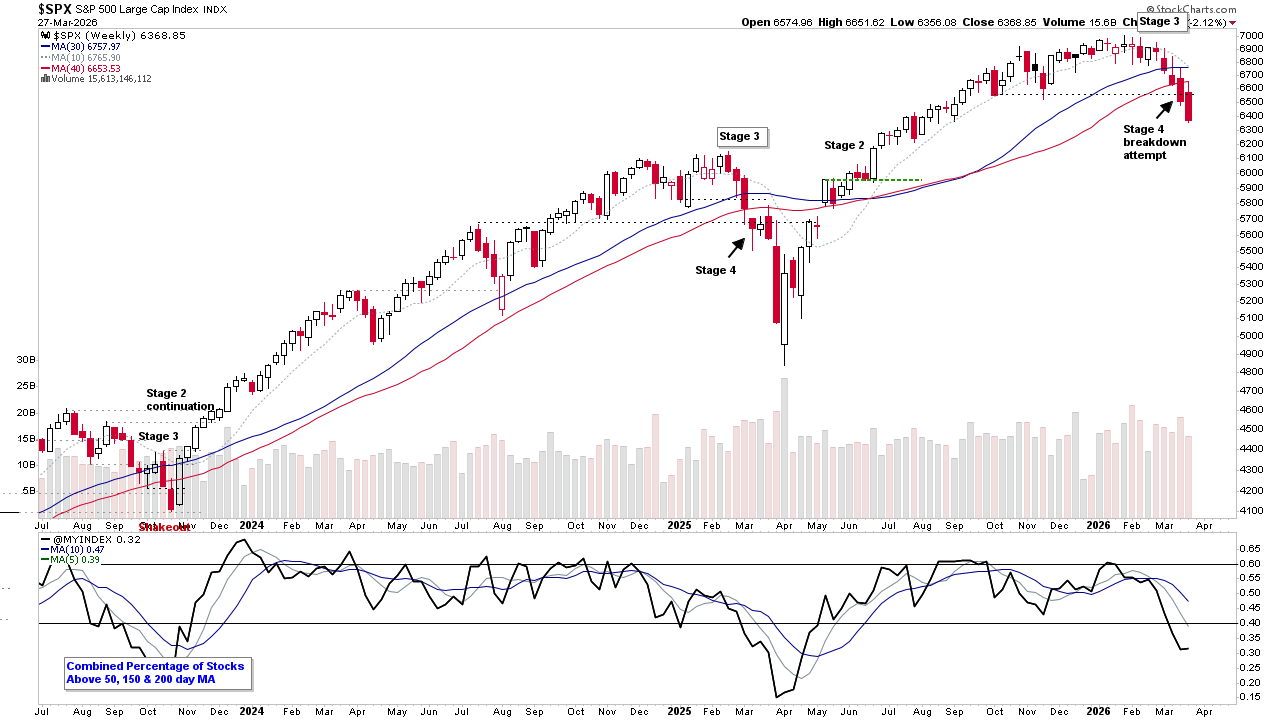
The Stage Analysis members video begins this week with a discussion of the Major US Stock Market Indexes on multiple timeframes, Stage 2 Breakout & Stage 4 Breakdown attempts, Stages Summary, the Sector breadth and Sub-industries Bell Curves, Relative Strength Rankings, the key Market Breadth Charts to determine the Weight of Evidence, Bitcoin & Ethereum and ETF Summary.
Read More
28 March, 2026
Market Breadth: Percentage of Stocks Above their 50 Day, 150 Day & 200 Day Moving Averages Combined
The US Total Percentage of Stocks above their 50 Day, 150 Day & 200 Day Moving Averages (shown above) increased by +0.14% this week. Therefore, the overall combined average is at 31.56% in the US market (NYSE and Nasdaq markets combined) above their short, medium and long term moving averages.
Read More
24 March, 2026
US Stocks Watchlist – 25 March 2026
There were 20 stocks highlighted from the US stocks watchlist scans today...
Read More
22 March, 2026
Video: Multiple Stage 4 Breakdown Attempts in Major US Market Indexes – SPY, QQQ, VTI... (50mins)
The Stage Analysis members video begins this week with a discussion of the the Major US Stock Market Indexes on multiple timeframes as multiple indexes are making potential Stage 4 breakdown attempts. Then reviewing last weeks Stage 2 Breakout & Stage 4 Breakdown attempts, SATA Bullish Percent Index, Stages Summary, the Sector breadth and Sub-industries Bell Curves, Relative Strength Rankings, the key Market Breadth Charts to determine the Weight of Evidence, Bitcoin & Ethereum and ETF Summary.
Read More
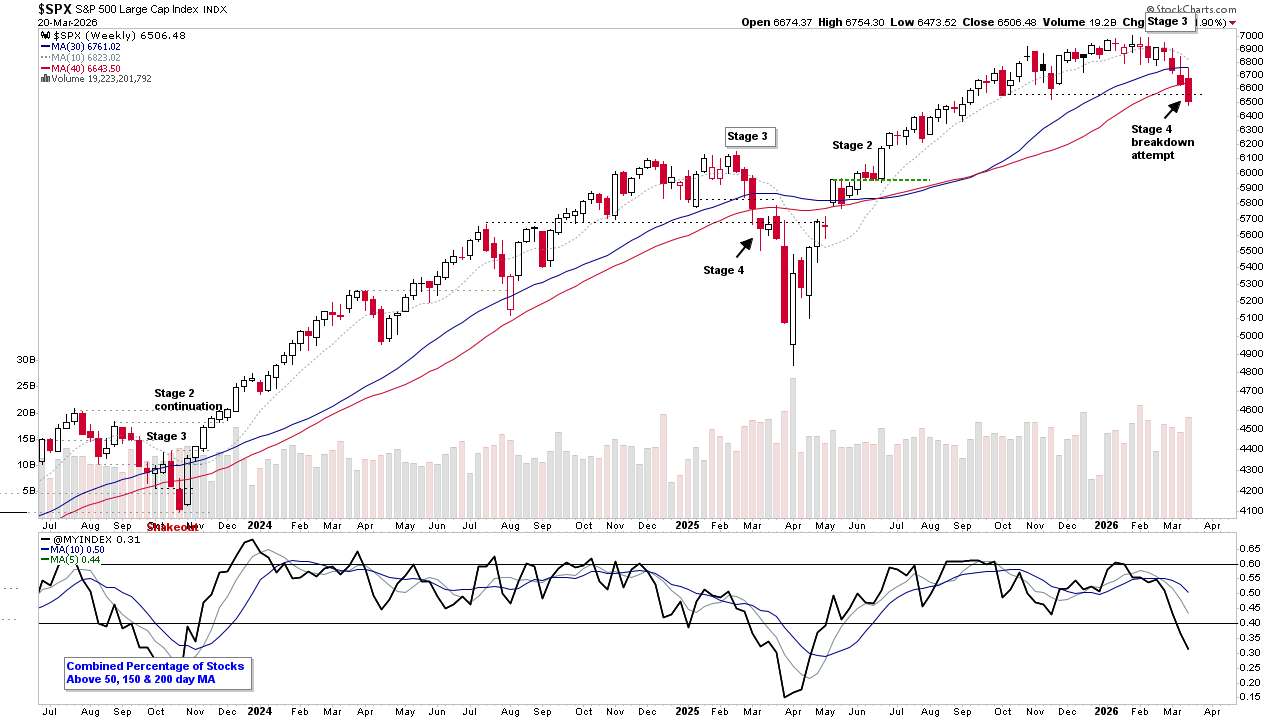
21 March, 2026
Market Breadth: Percentage of Stocks Above their 50 Day, 150 Day & 200 Day Moving Averages Combined
The US Total Percentage of Stocks above their 50 Day, 150 Day & 200 Day Moving Averages (shown above) decreased by -5.30% this week. Therefore, the overall combined average is at 31.43% in the US market (NYSE and Nasdaq markets combined) above their short, medium and long term moving averages.
Read More
15 March, 2026
Stage Analysis Weekend Video – 15 March 2026 (38mins)
The Stage Analysis weekend video discussing the Major US Stock Market Indexes, Stage 2 Breakout & Stage 4 Breakdown attempts, Stages Summary, the Sector breadth and Sub-industries Bell Curves, Relative Strength Rankings, the key Market Breadth Charts to determine the Weight of Evidence and ETF Summary.
Read More
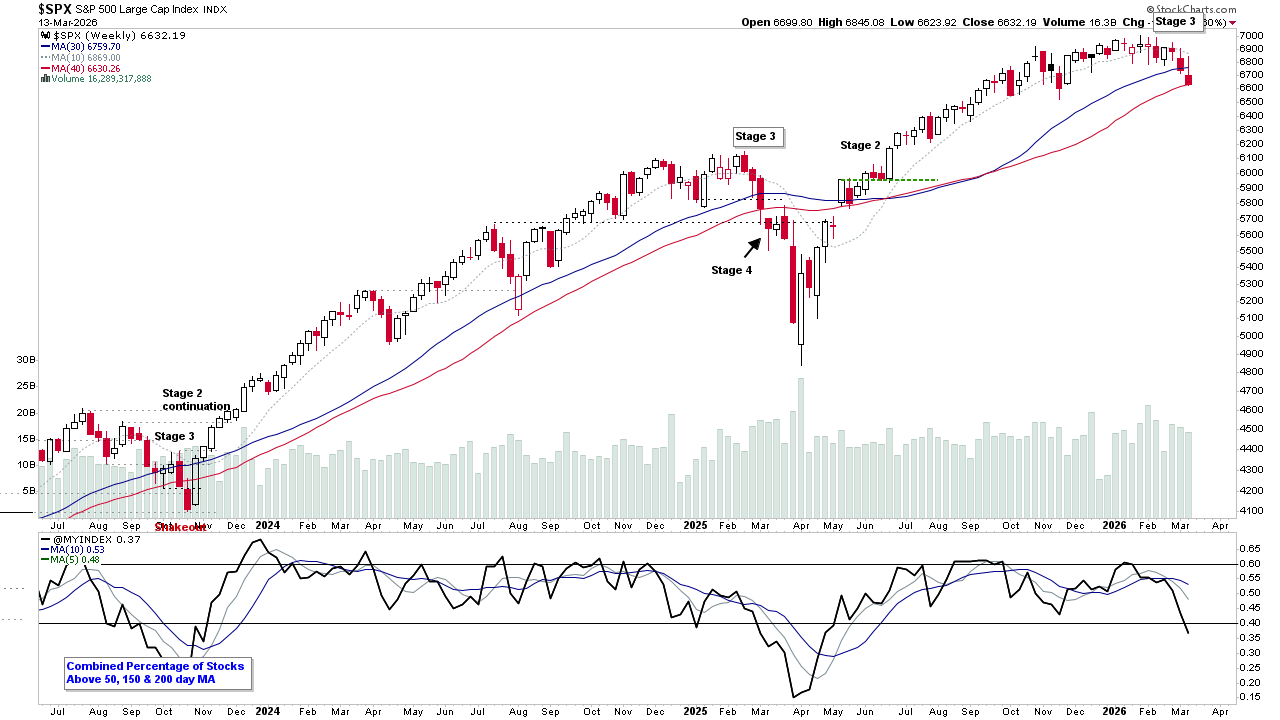
13 March, 2026
Market Breadth: Percentage of Stocks Above their 50 Day, 150 Day & 200 Day Moving Averages Combined
The US Total Percentage of Stocks above their 50 Day, 150 Day & 200 Day Moving Averages (shown above) decreased by -6.77% this week. Therefore, the overall combined average is at 36.73% in the US market (NYSE and Nasdaq markets combined) above their short, medium and long term moving averages.
Read More