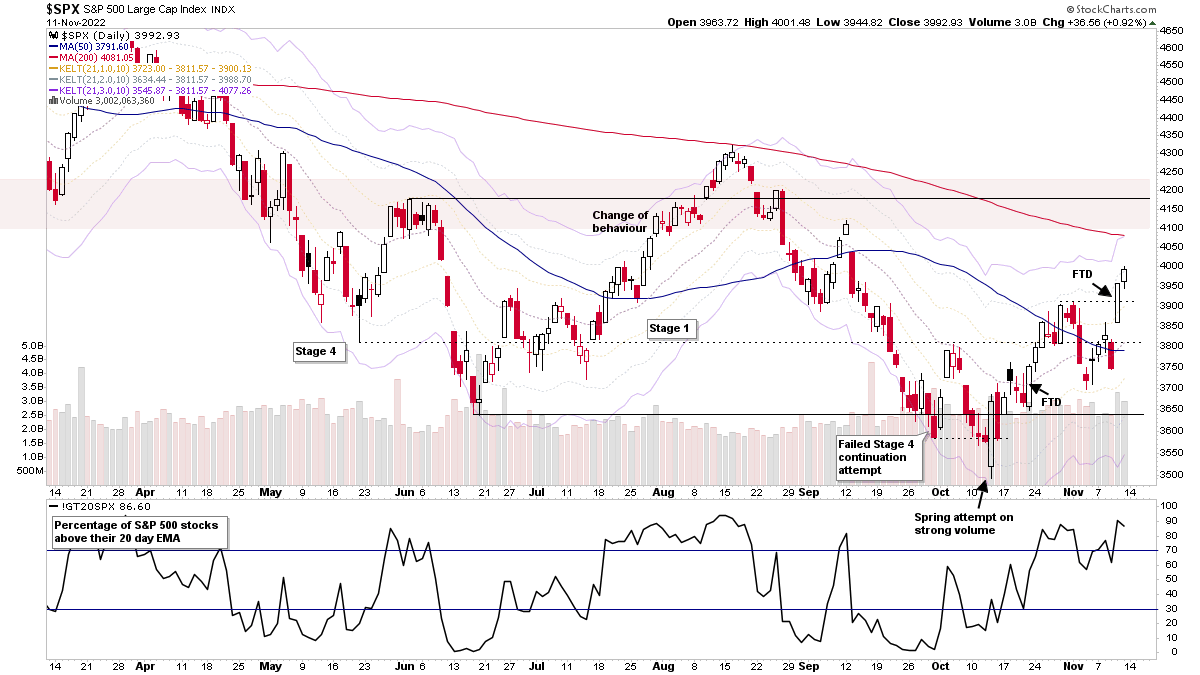
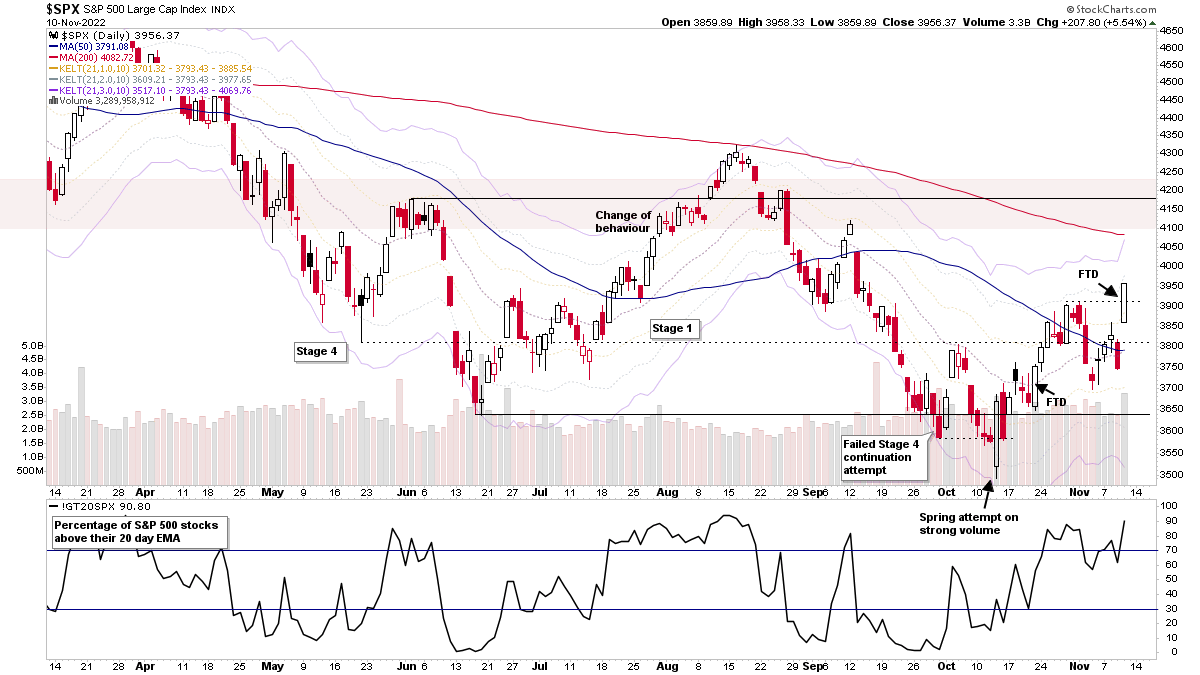
The S&P 500 continues to develop in a potential Stage 1 base structure that's been developing since the change of behaviour off of the June lows. The recent Spring on October 13th triggered the start of the latest rally attempt within the developing structure and could potentially be Phase C of the structure, which puts it now in Stage 1 Phase D, with two Follow Through Days (FTDs) since then.
Read More

Blog
15 November, 2022
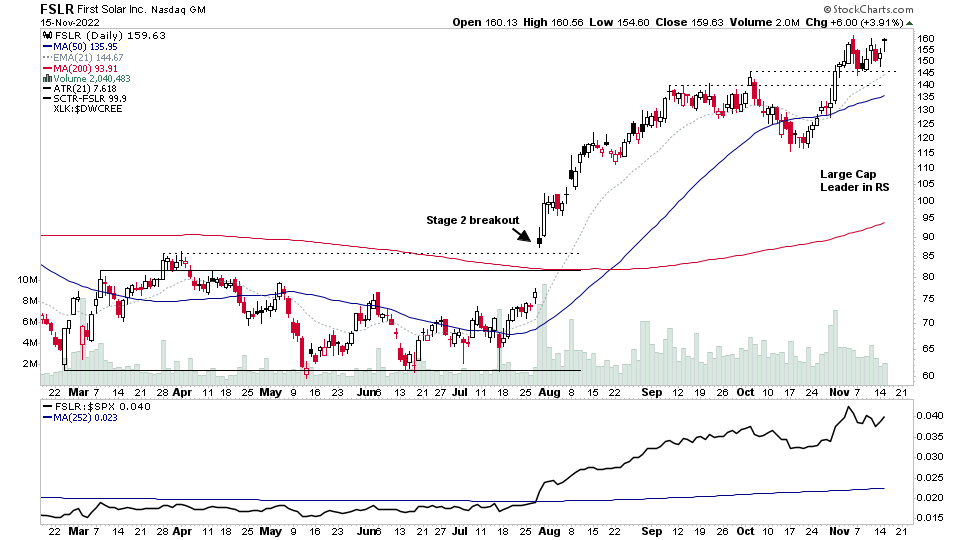
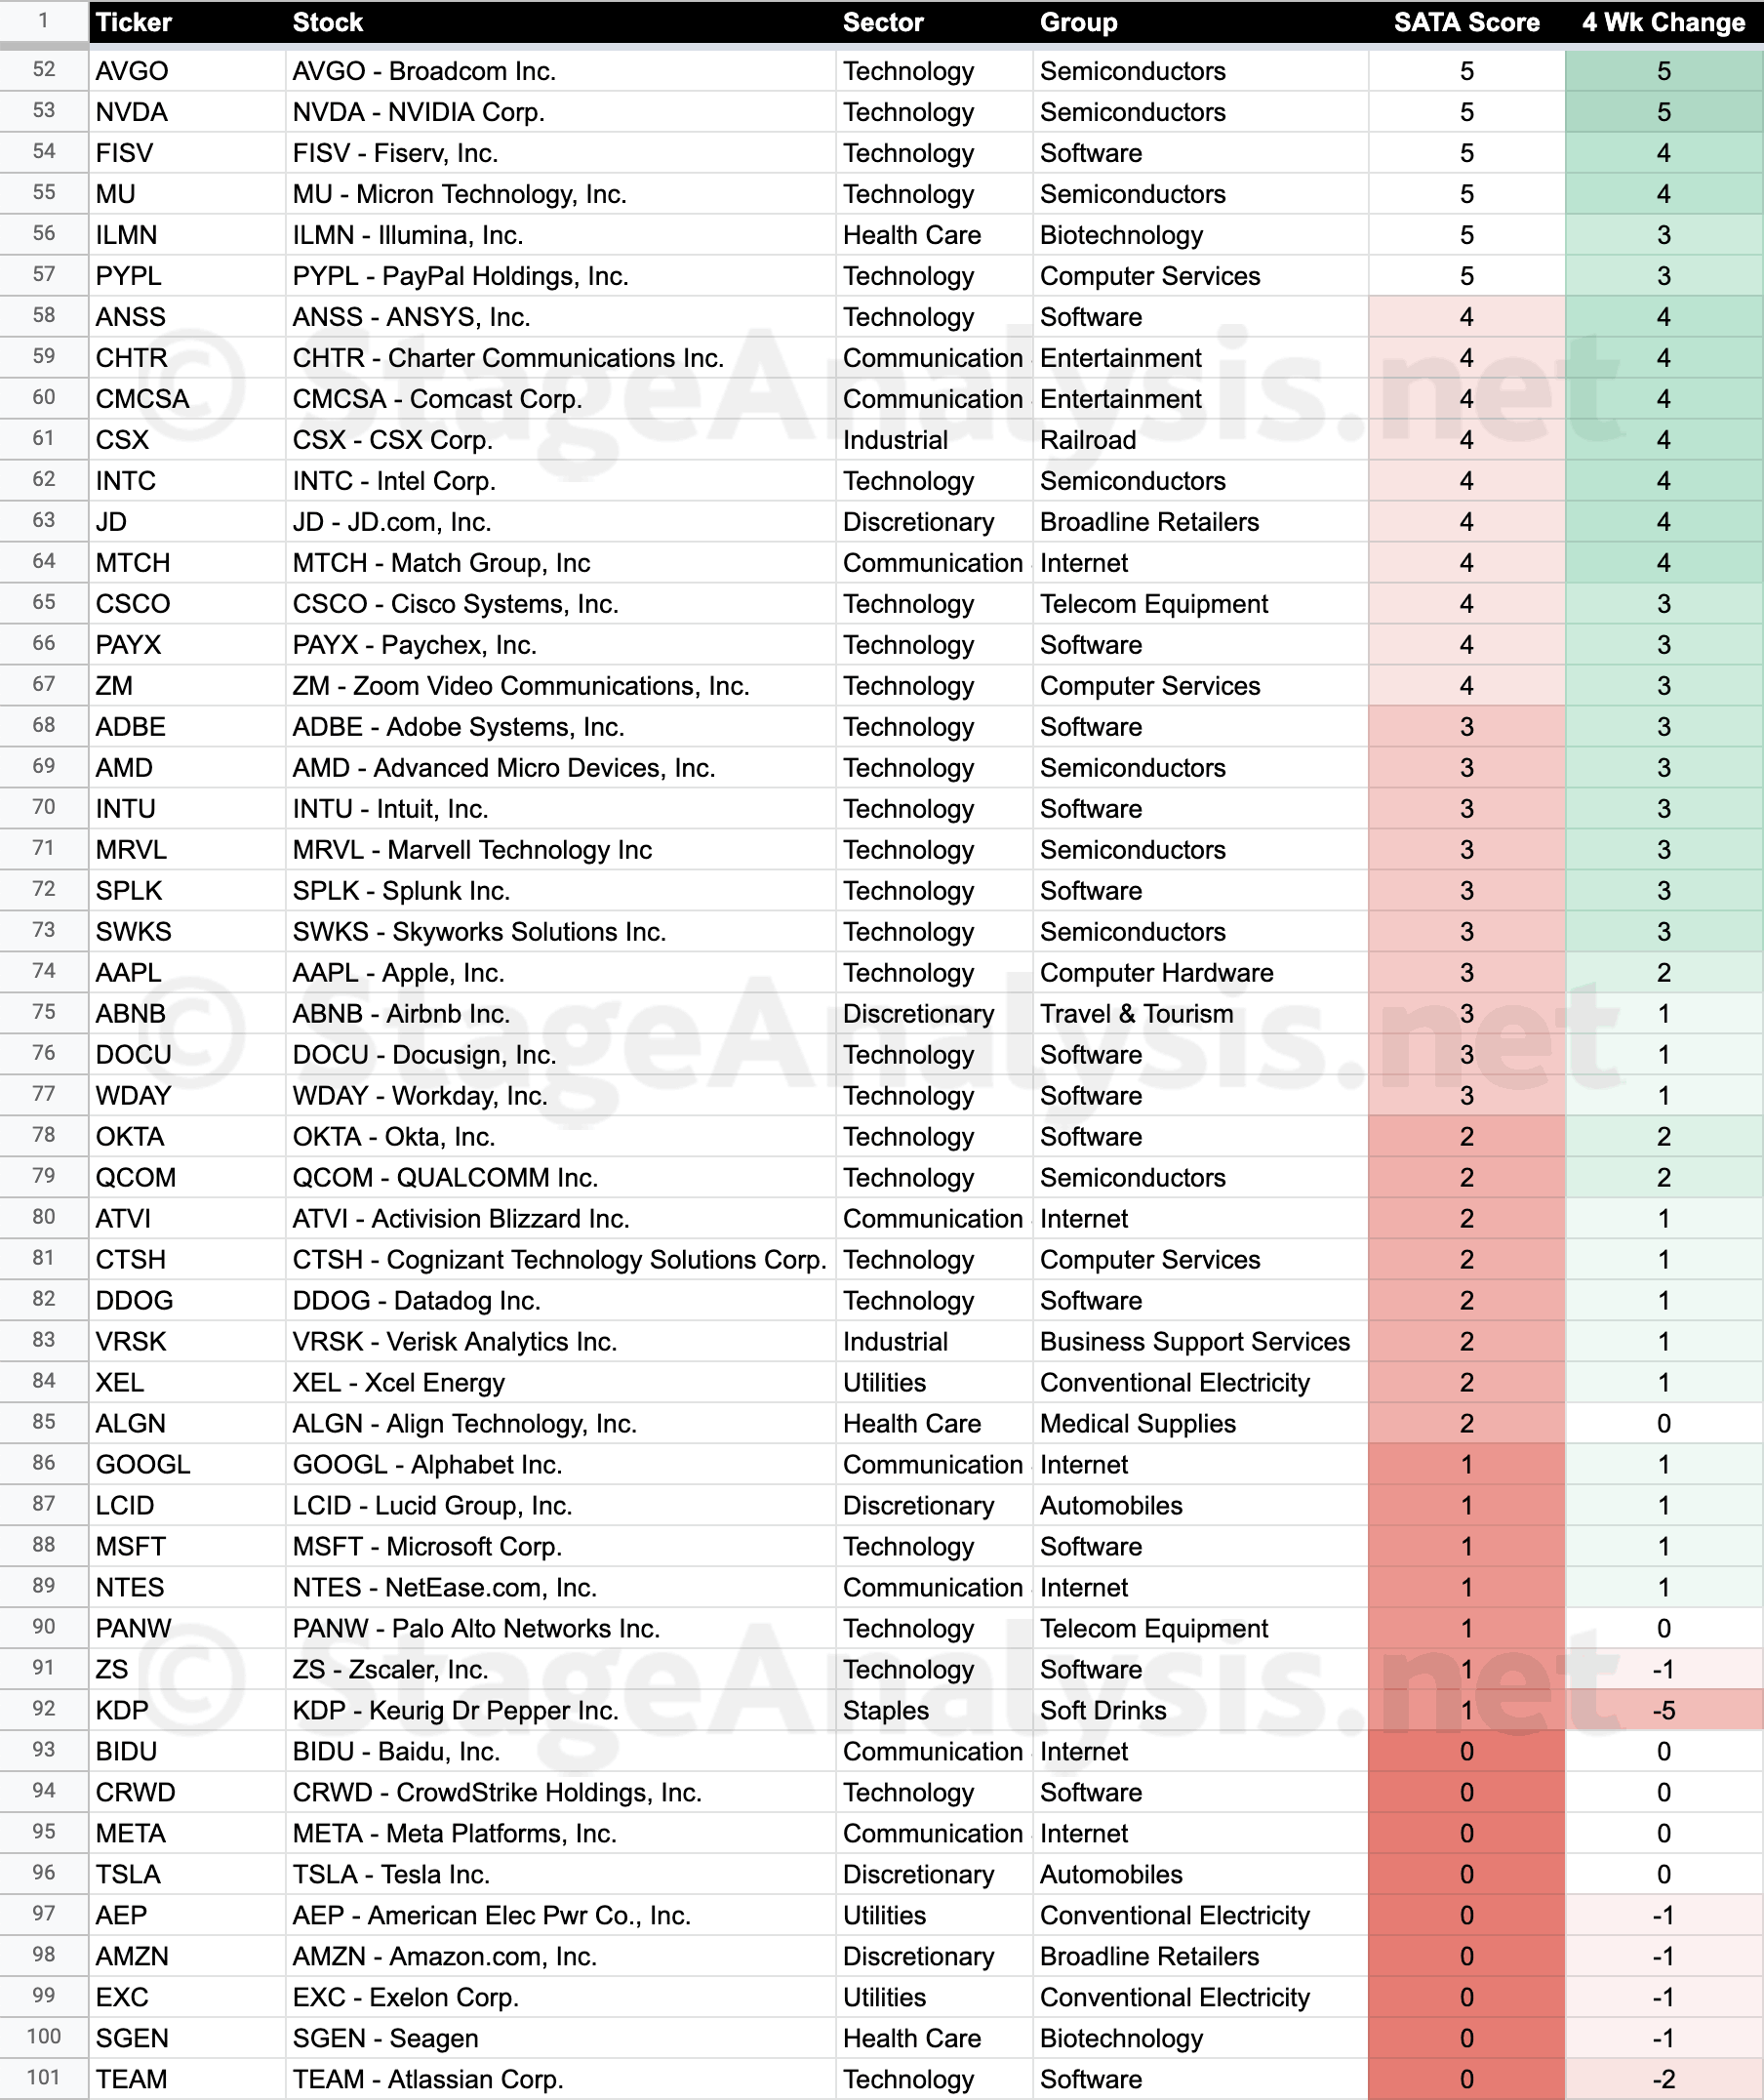
Stage Analysis Technical Attributes Scores – Nasdaq 100
It has been a month since I analysed the Stage Analysis Technical Attributes weekly scores for the Nasdaq 100. So I thought it might be a useful regular feature for the Stage Analysis members, as it shows a rough guide of the Stages of the individual stocks within the Nasdaq 100, as everything above a 7 would be considered in the Stage 2 zone, 4-6 in the Stage 1 or Stage 3 zone, and 3 or below is the Stage 4 zone.
Read More
13 November, 2022
Stage Analysis Members Video – 13 November 2022 (1hr 21mins)
The Stage Analysis members weekend video, this week discussing the significant bar in the US Dollar Index and price and volume action in the major stock market indexes. Plus Stage Analysis of the individual sectors and the Industry Groups Relative Strength Rankings, with a look in more depth of some of the groups making the strongest moves. Also discussion of the strong shift in the IBD Industry Groups Bell Curve – Bullish Percent data, and the Market Breadth Update to help to determine the current Weight of Evidence. And finishing with live markups of the weekends US Stocks Watchlist.
Read More
13 November, 2022
US Stocks Watchlist – 13 November 2022
For the watchlist from the weekend scans...
Read More
12 November, 2022
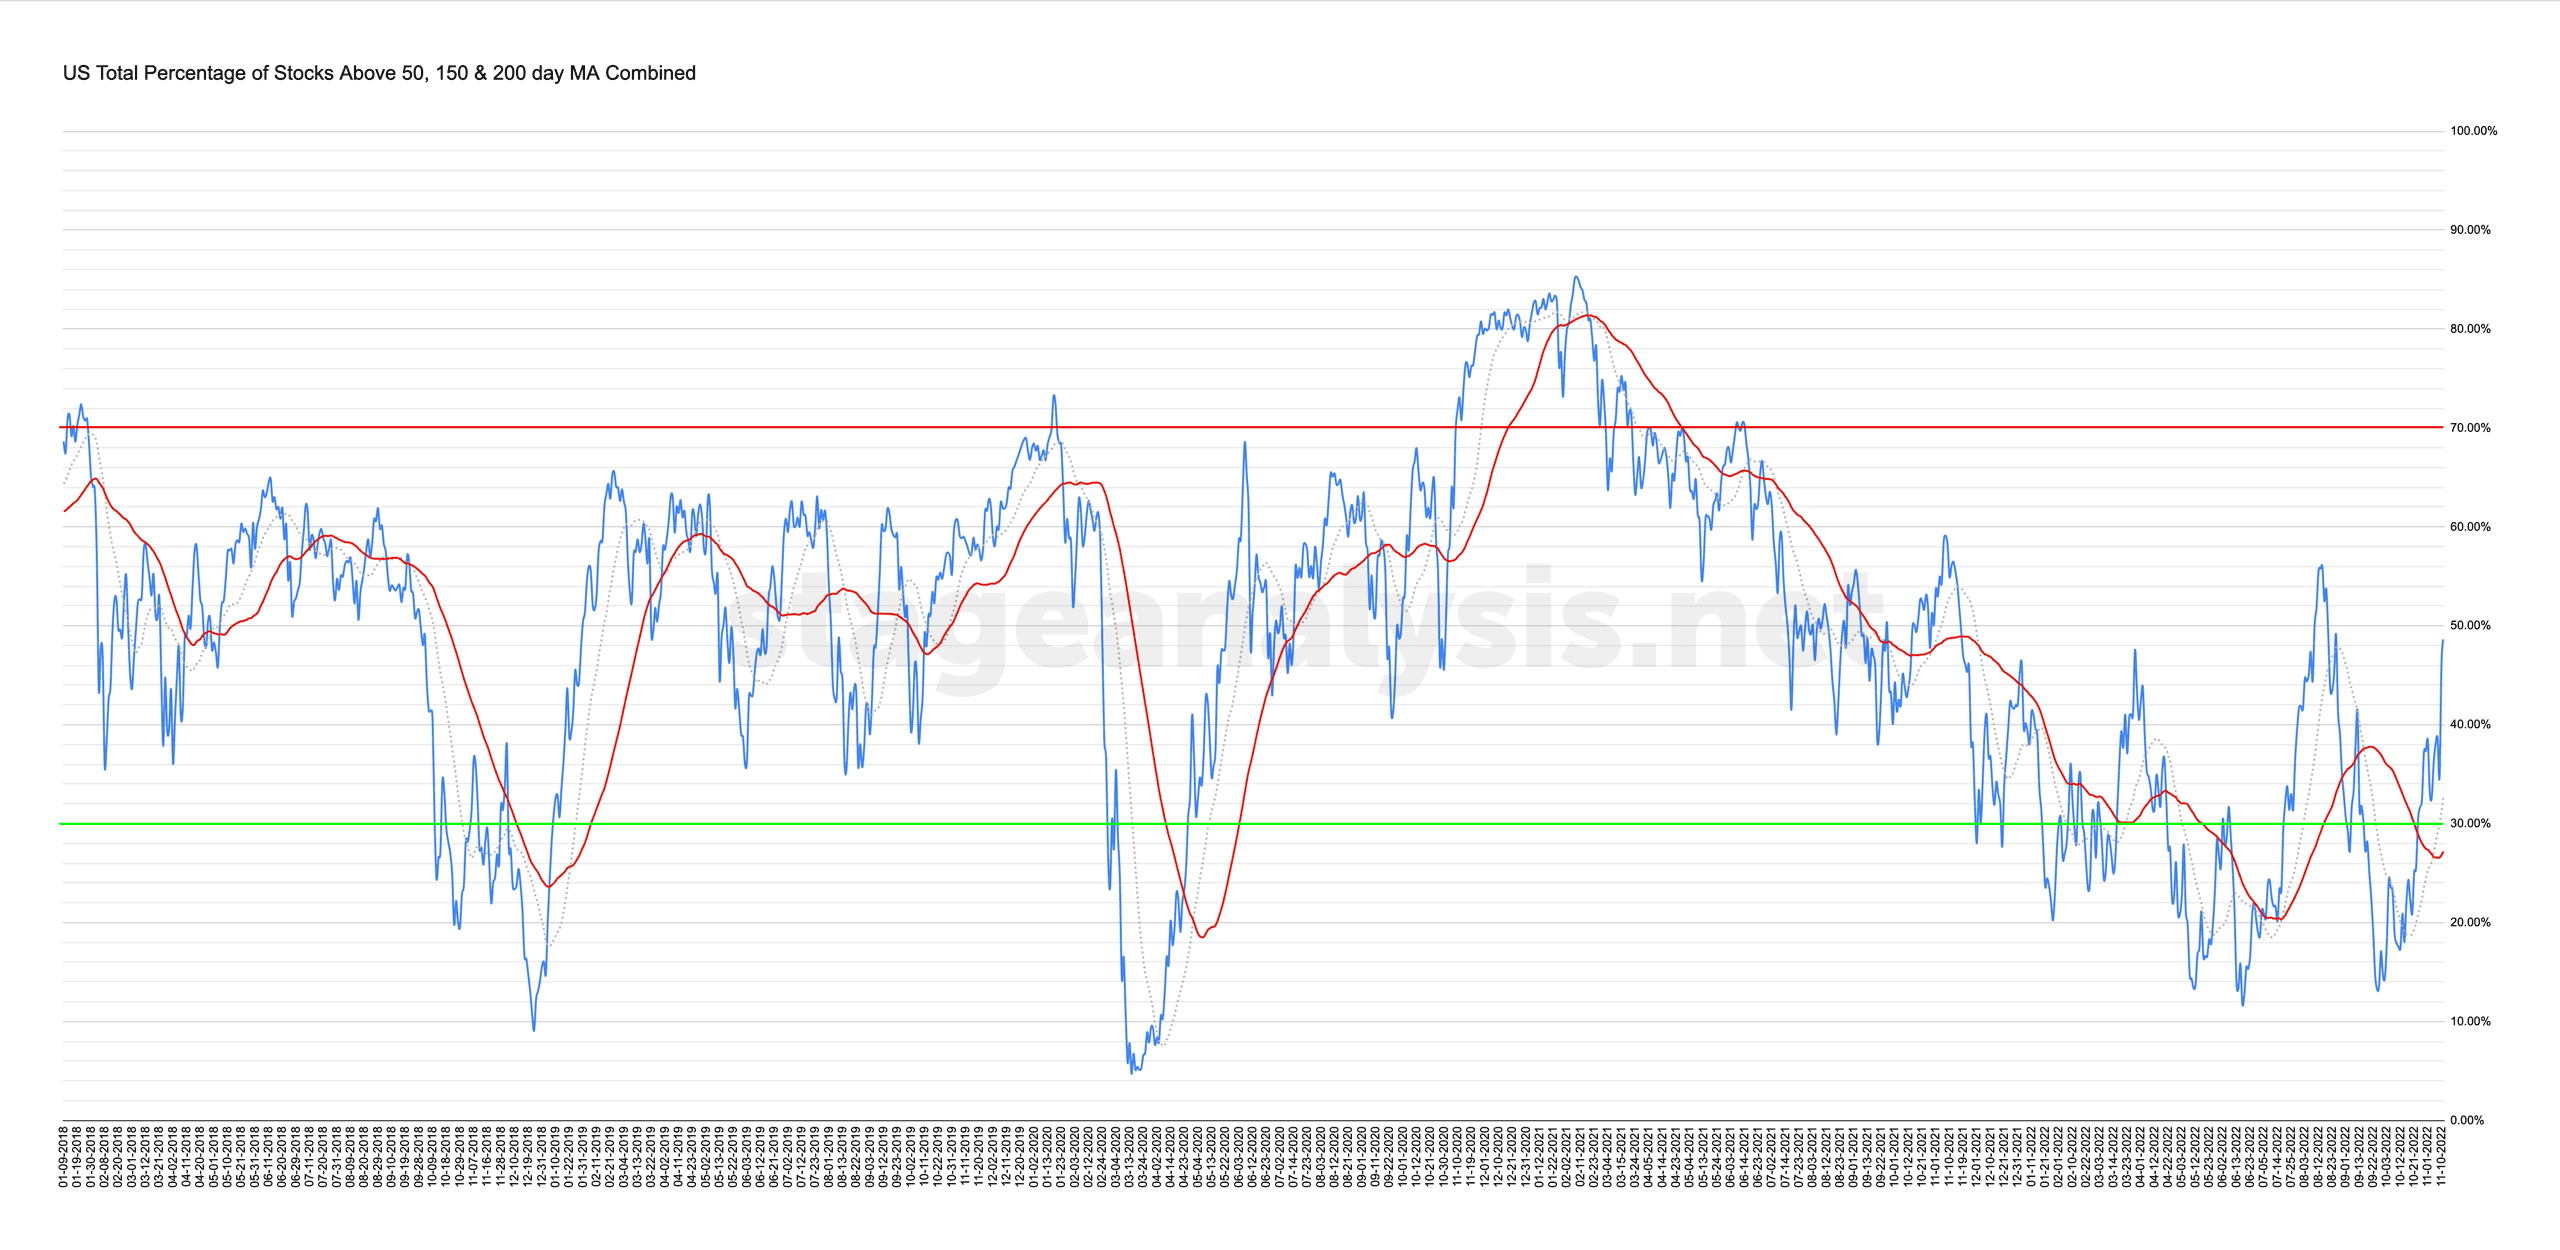
Market Breadth: Percentage of Stocks Above their 50 Day, 150 Day & 200 Day Moving Averages Combined
Custom Percentage of Stocks Above Their 50 Day, 150 Day & 200 Day Moving Averages Combined Market Breadth Charts for the Overall US Market, NYSE and Nasdaq for Market Timing and Strategy.
Read More
12 November, 2022
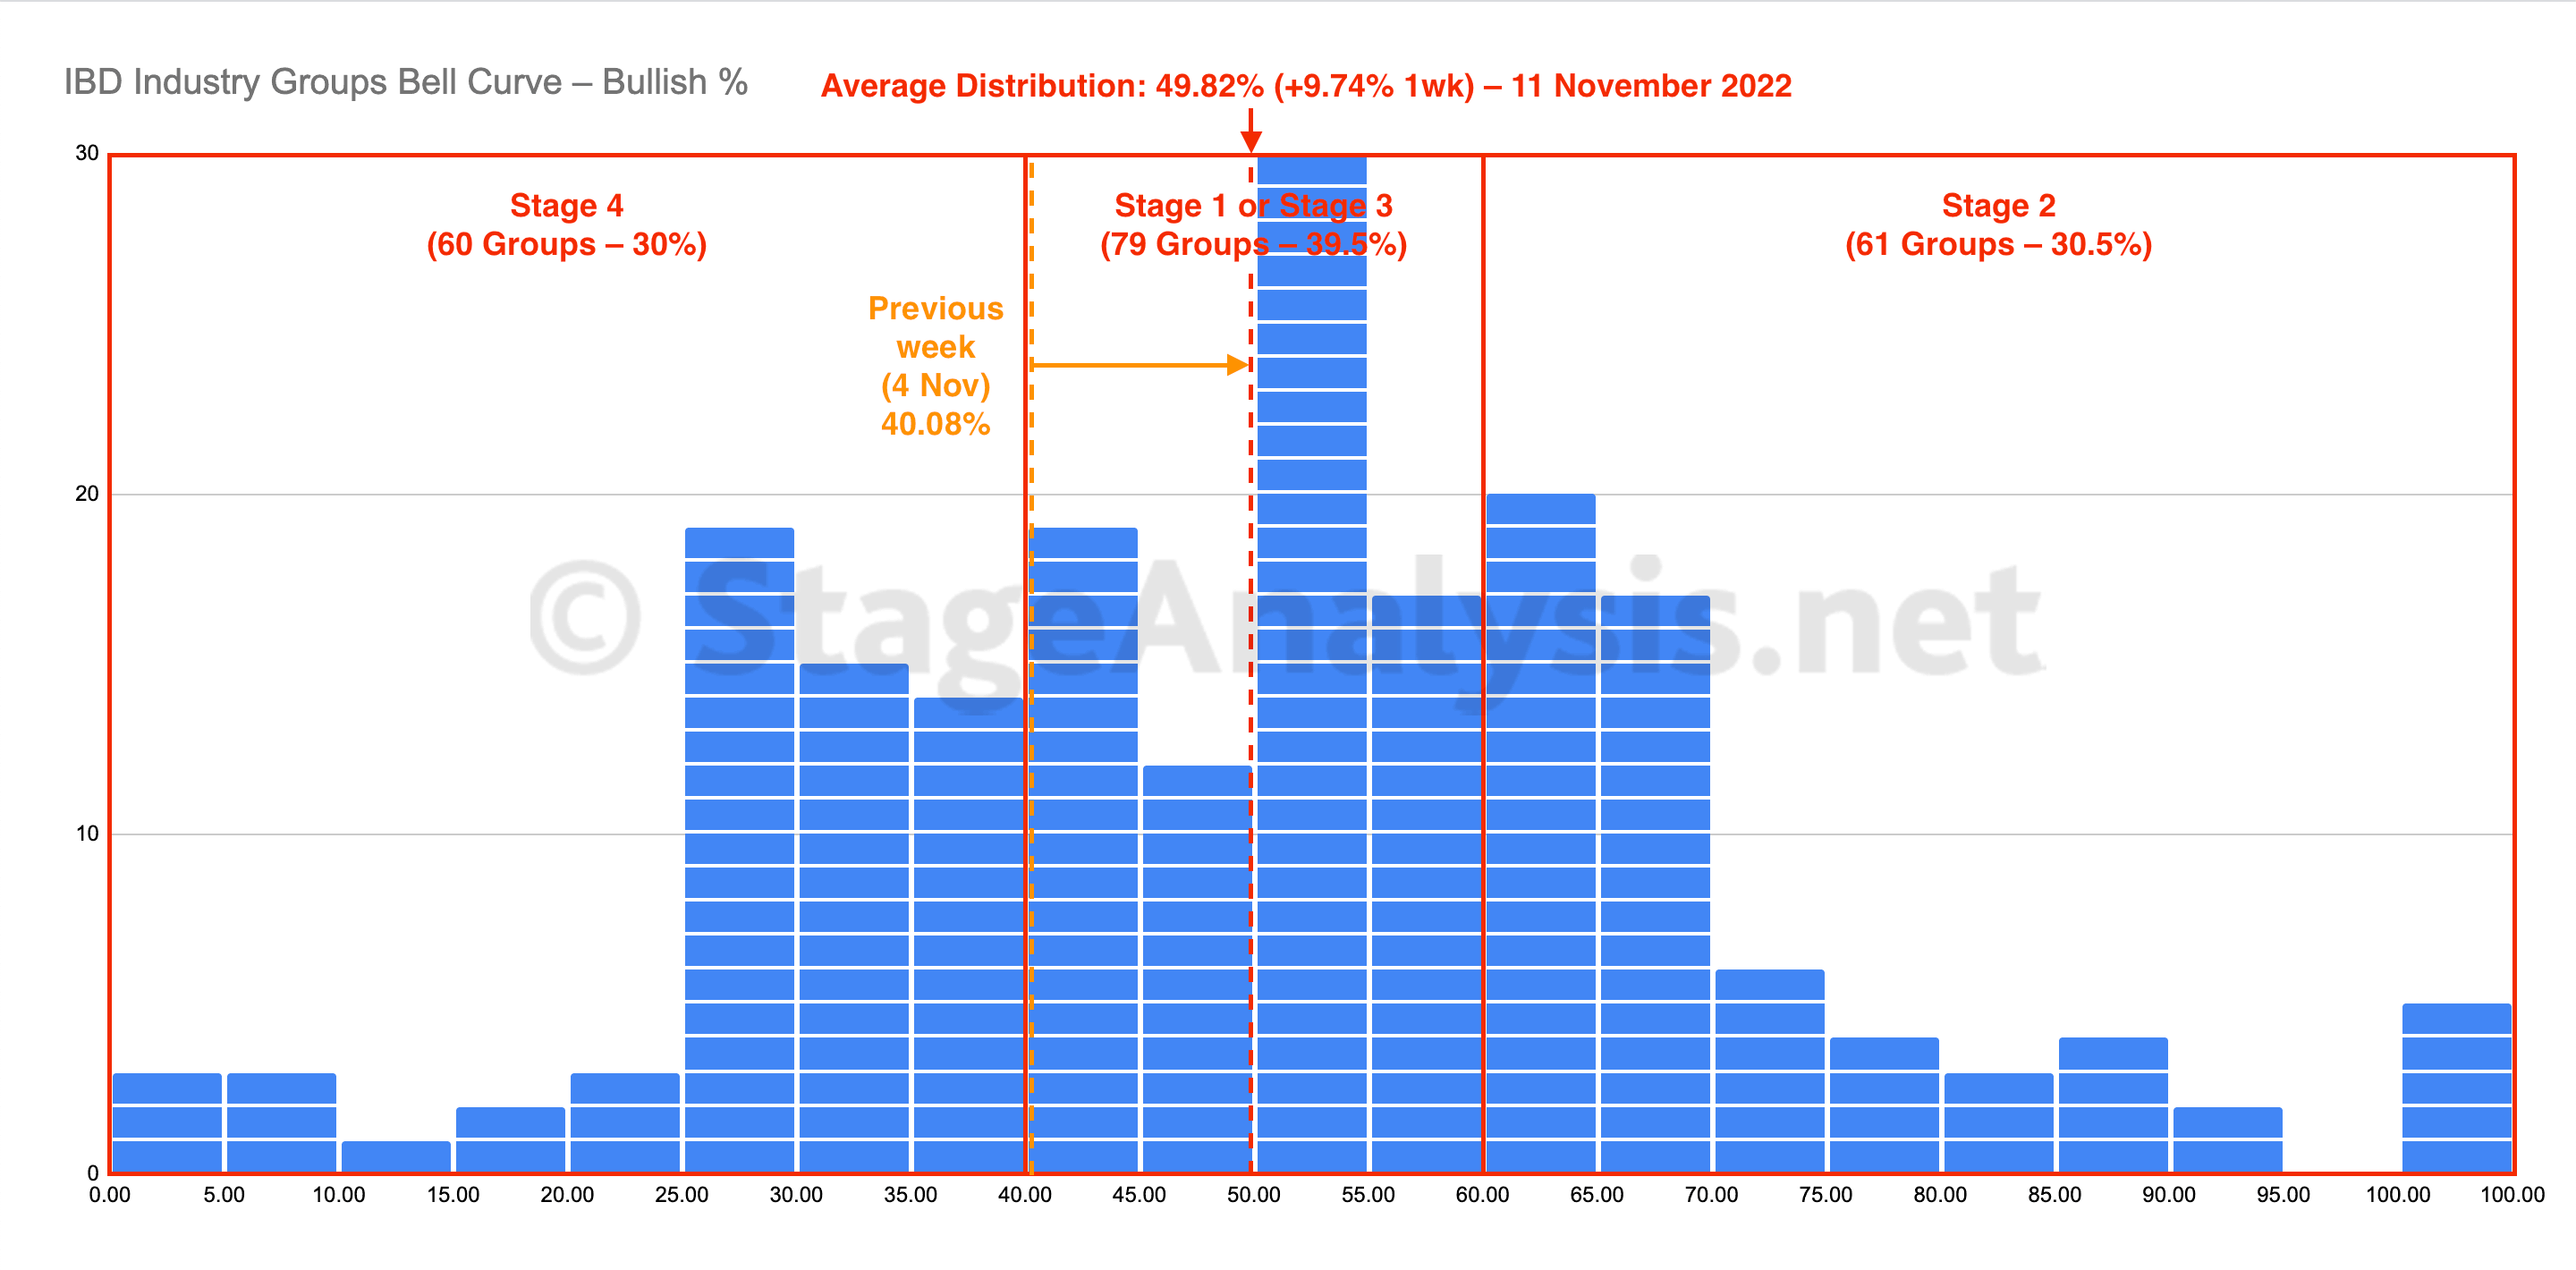
IBD Industry Groups Bell Curve – Bullish Percent
The IBD Industry Groups Bell Curve had a strong improvement this week of +9.74% to end the week at 49.82%, which is firmly in the Stage 1 zone in the middle of the range. A further 29 groups (+14.5%) moved into the Stage 2 zone this week, with 46 groups (-23%) leaving the Stage 4 zone...
Read More
12 November, 2022
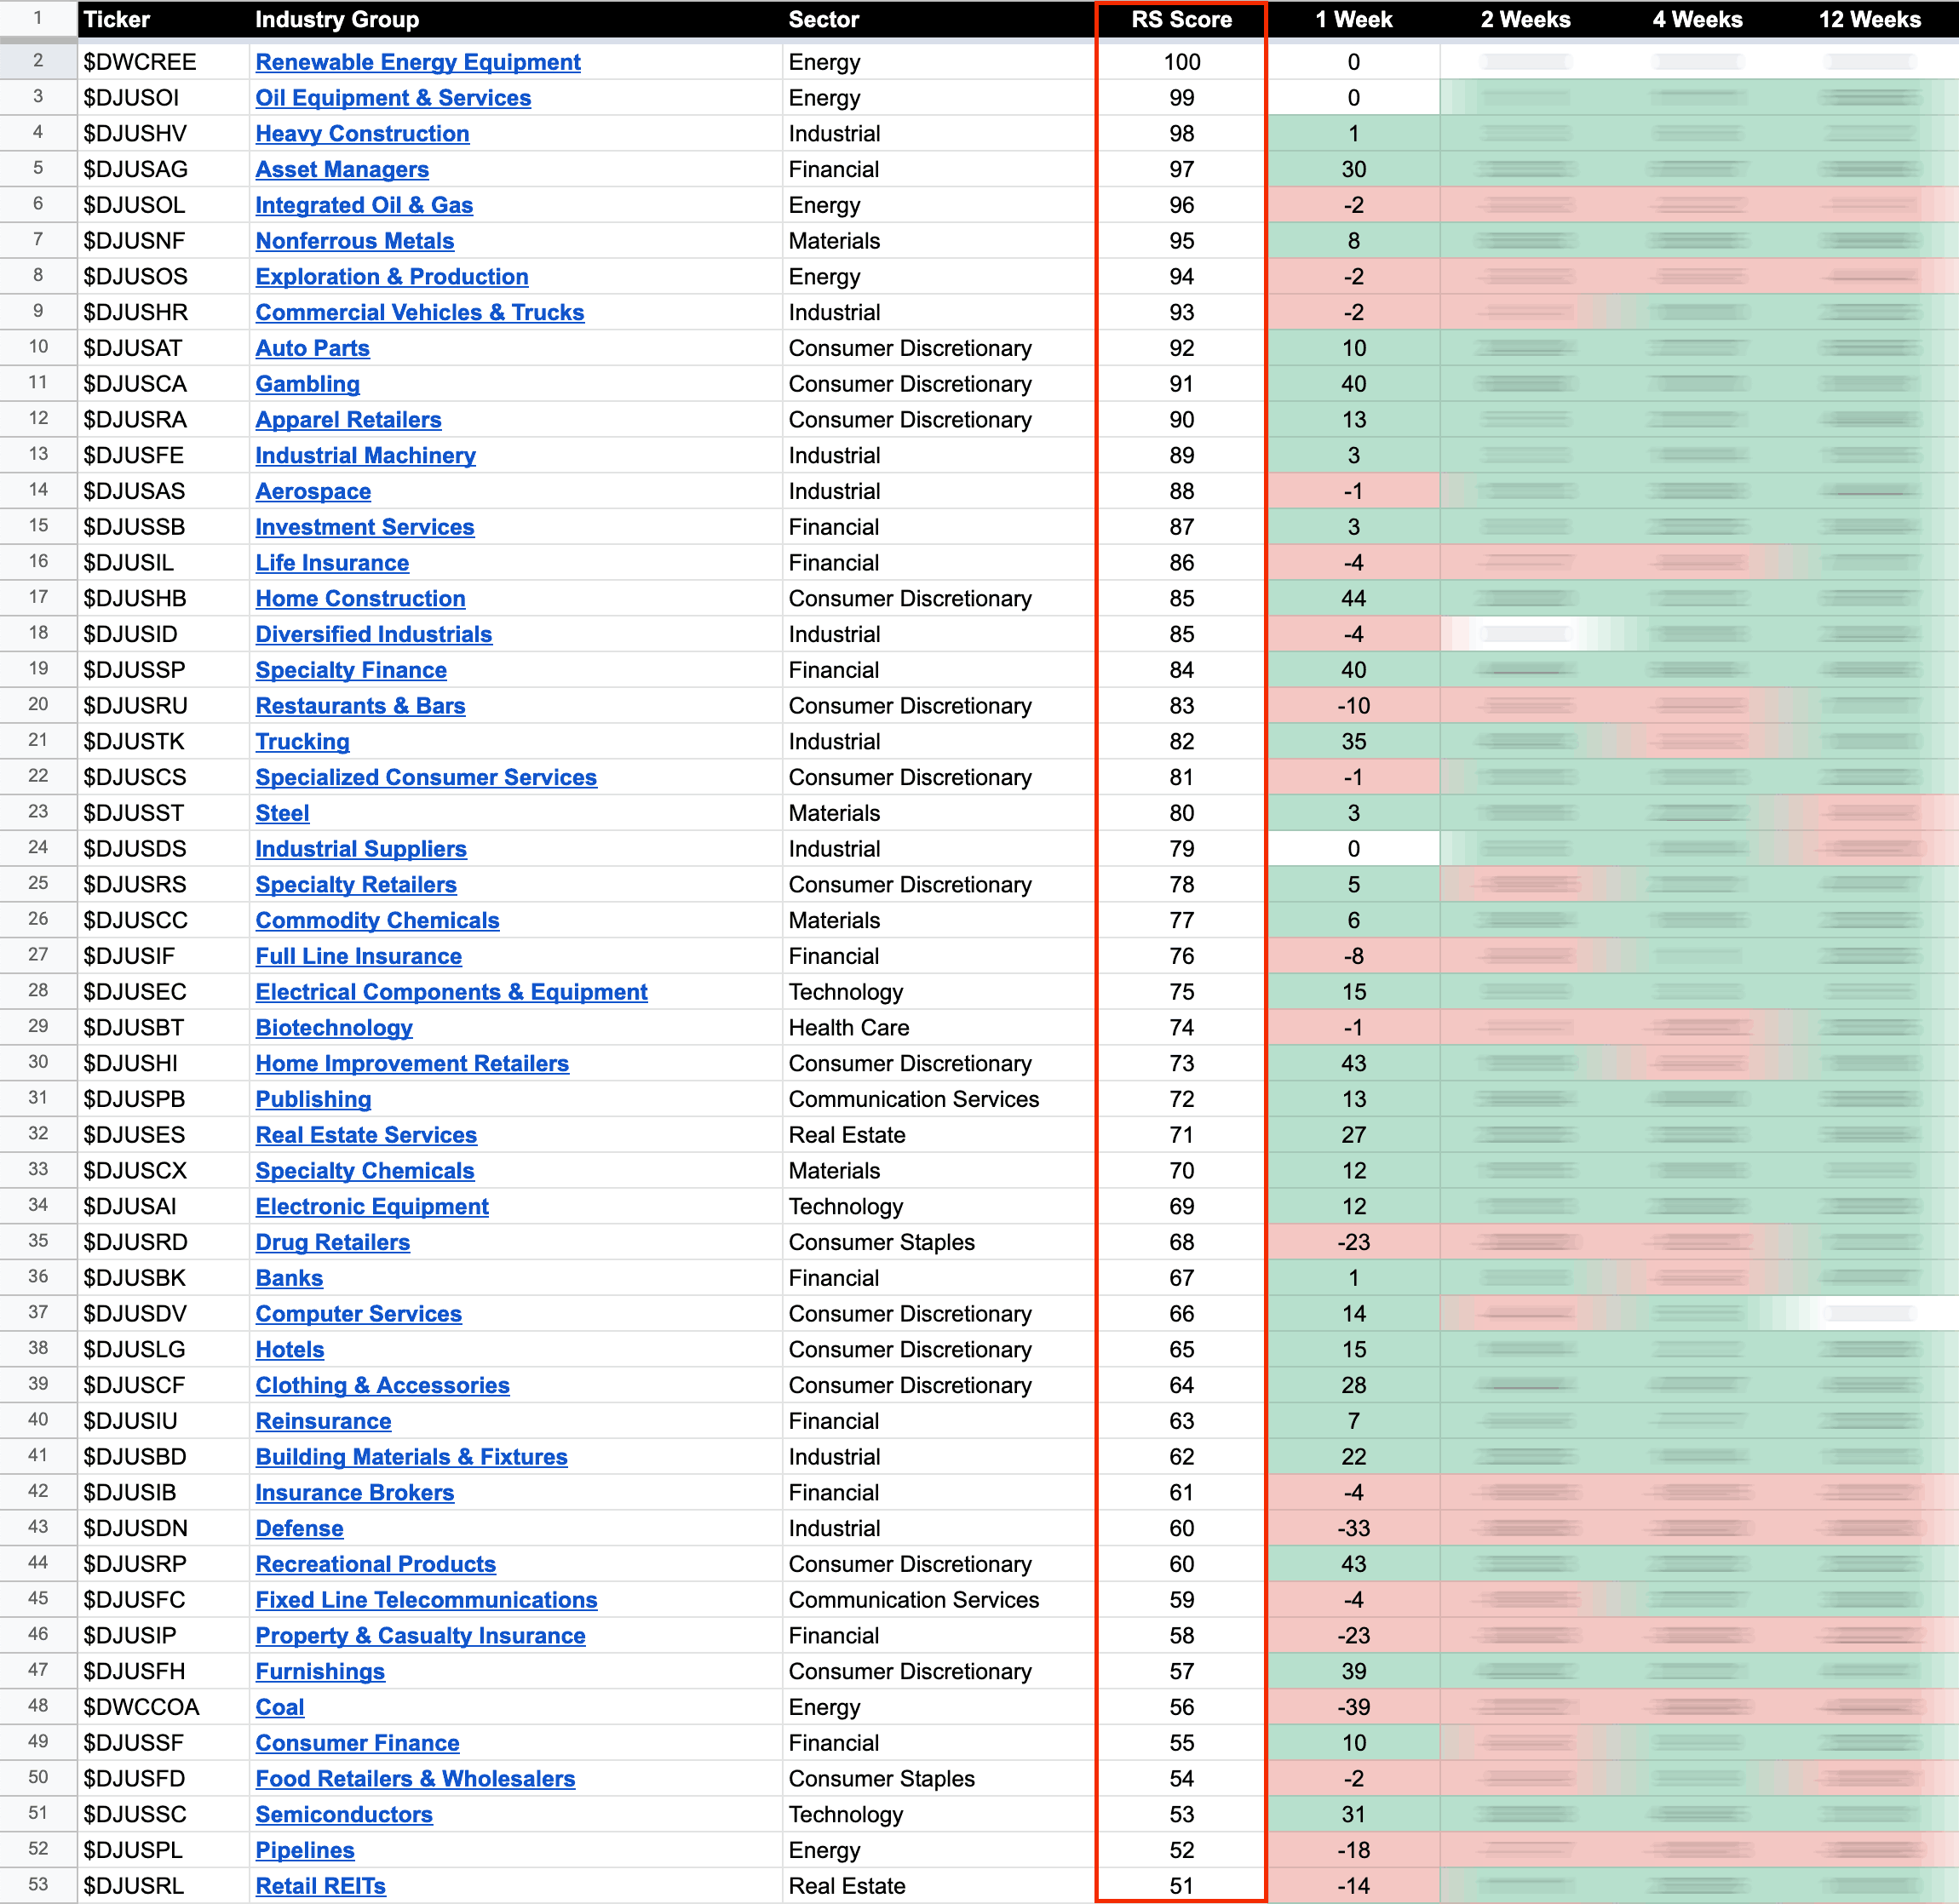
US Stocks Industry Groups Relative Strength Rankings
The purpose of the Relative Strength (RS) tables is to track the short, medium and long term RS changes of the individual groups to find the new leadership earlier than the crowd...
Read More
10 November, 2022
Stage Analysis Members Video – Follow Through Day – 10 November 2022 (46mins)
The members midweek video discussing the market, short-term market breadth and individual stocks from the watchlist in more detail following the huge moves in the stock market indexes, causing a further Follow Through Day (FTD).
Read More
09 November, 2022
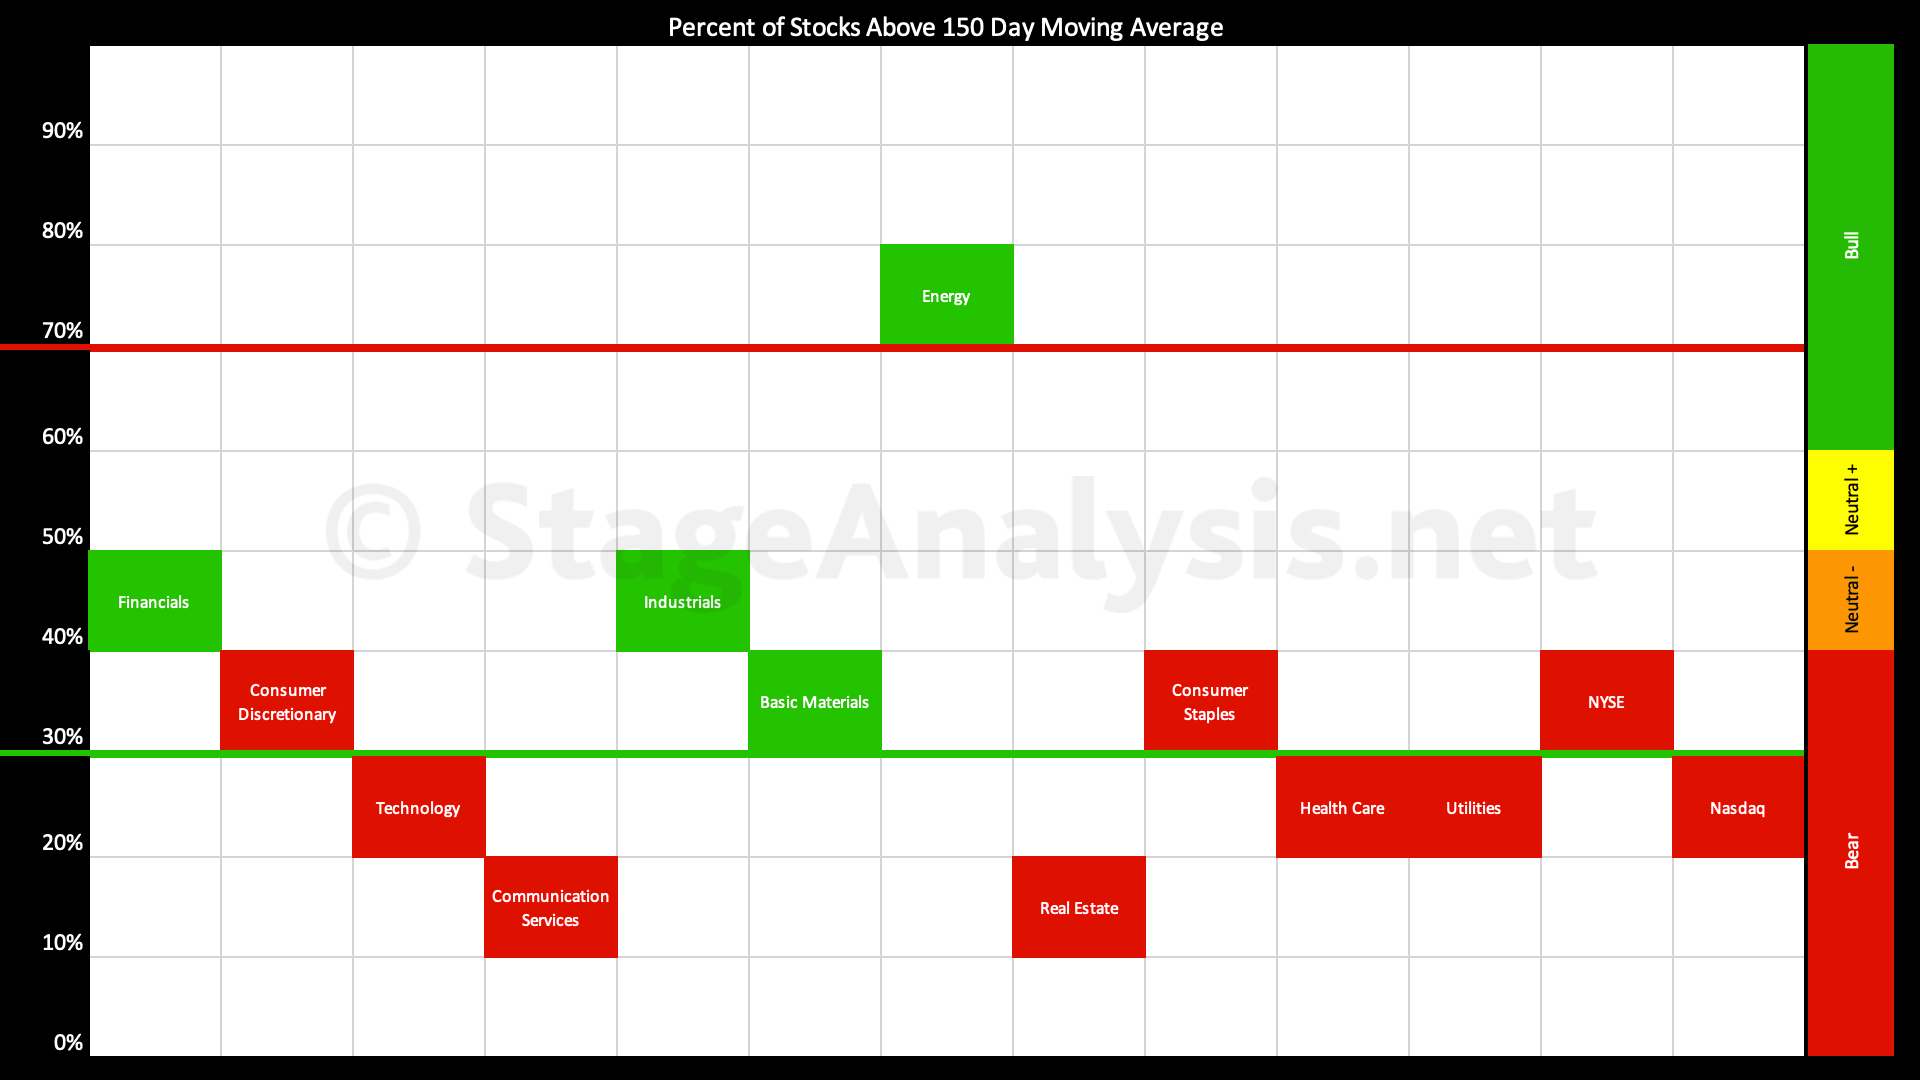
Sector Breadth: Percentage of US Stocks Above Their 150 day (30 Week) Moving Averages
The Percentage of US Stocks Above Their 150 day Moving Averages in the 11 major sectors has improved over the last month since my previous post on the 11th October when it was starting to rebound from lowest reading of the year at 14.76% on the 30th September...
Read More
09 November, 2022
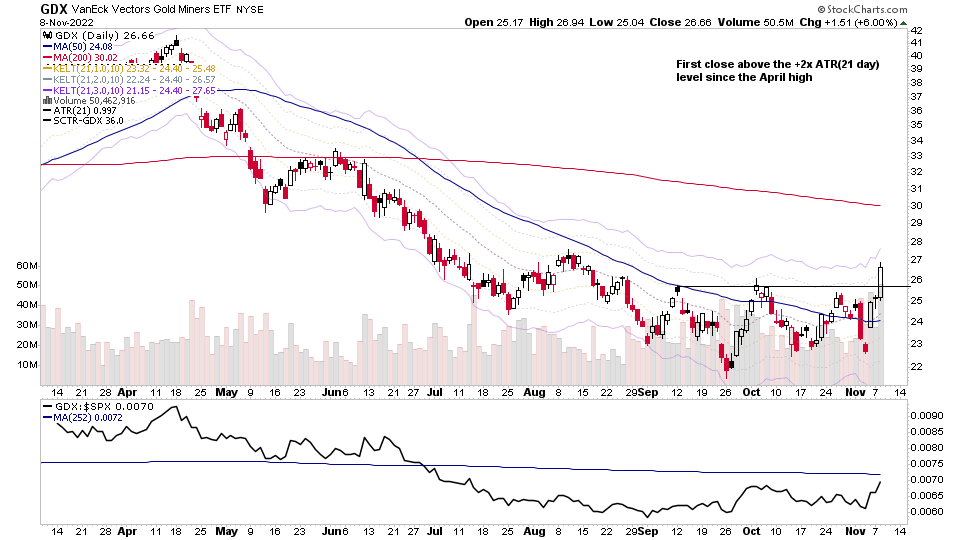
Precious Metals Stocks Showing Strong Relative Strength and the US Stocks Watchlist – 8 November 2022
The precious metals stocks – which I did a feature on in the weekend video – showed some the strongest relative strength today with multiple gold and silver stocks breaking out on volume from their recent base structures, and a couple are even attempting early Stage 2 breakouts (CDE & OR), but which still have declining 30 week MAs...
Read More