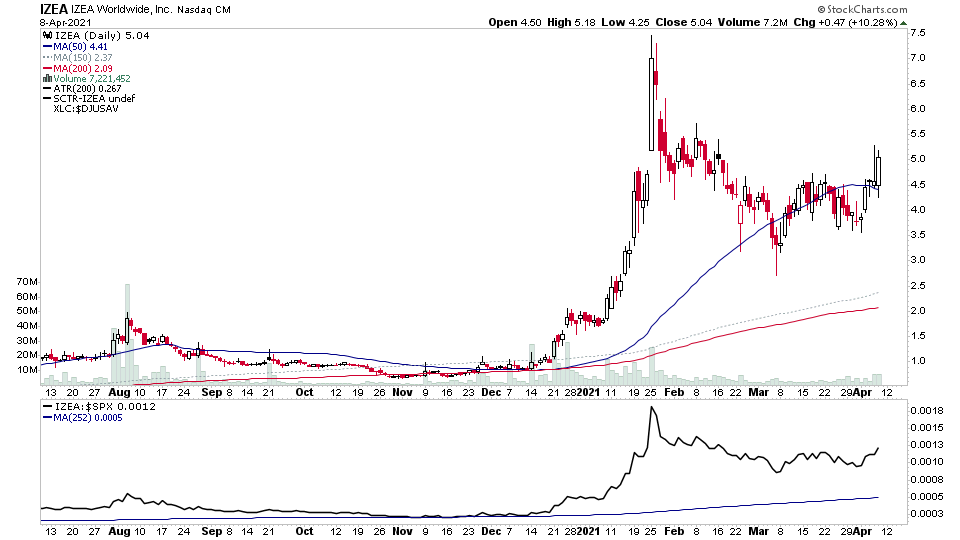
For the watchlist from Thursdays scans - AER, ALGN, BSIG, DT, FORM, FUTU, GPRO, GRWG, HIMX, IZEA, MOGO, PLYA, PTON, PYPL, QUOT, RICE, ROST, SONO, TIGR, UPWK, YETI
Read More

Blog
08 April, 2021
US Stocks Watchlist - 8 April 2021
07 April, 2021
US Stocks Watchlist - 7 April 2021
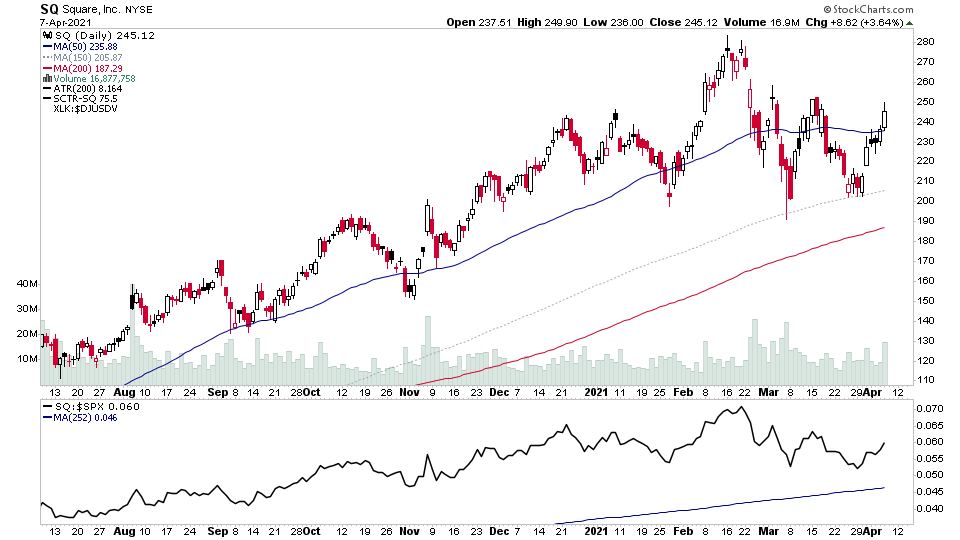
For the watchlist from Wednesdays scans - BNSO, CG, CLR, CMA, CMC, CMRE, DCP, DXC, EOG, EXTR, HES, HYRE, IDCC, IMO, ING, KSS, MGY, MPC, MTDR, QCOM, QUOT, SQ, TRGP. A big group theme tonight of note with almost half of the watchlist picks in the Energy group, with most in the Exploration & Production group.
Read More
06 April, 2021
US Stocks Watchlist - 6 April 2021
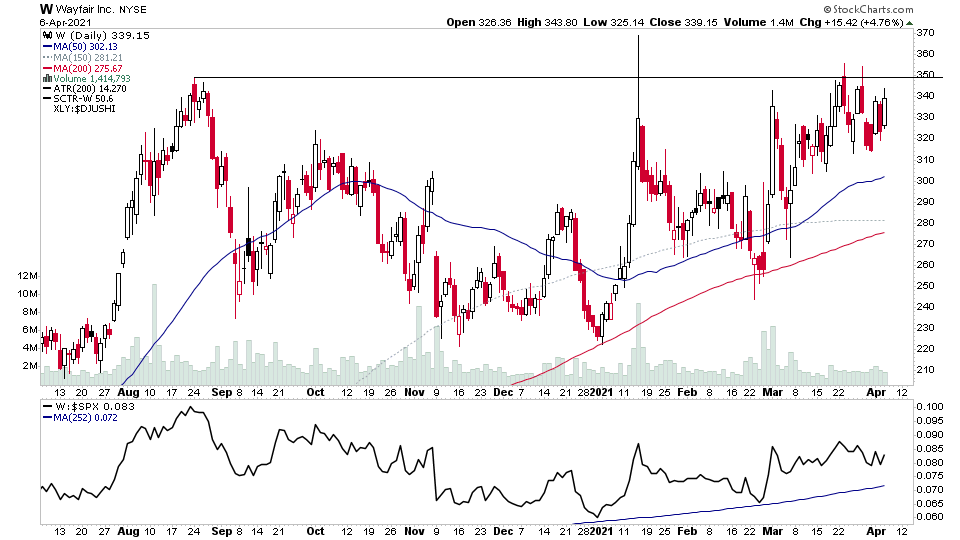
For the watchlist from Tuesdays scans - AAPL, AG, ALK, BLNK, DDOG, ENIA, HPP, MUDSU, SID, SUN, TWTR, W
Read More
05 April, 2021
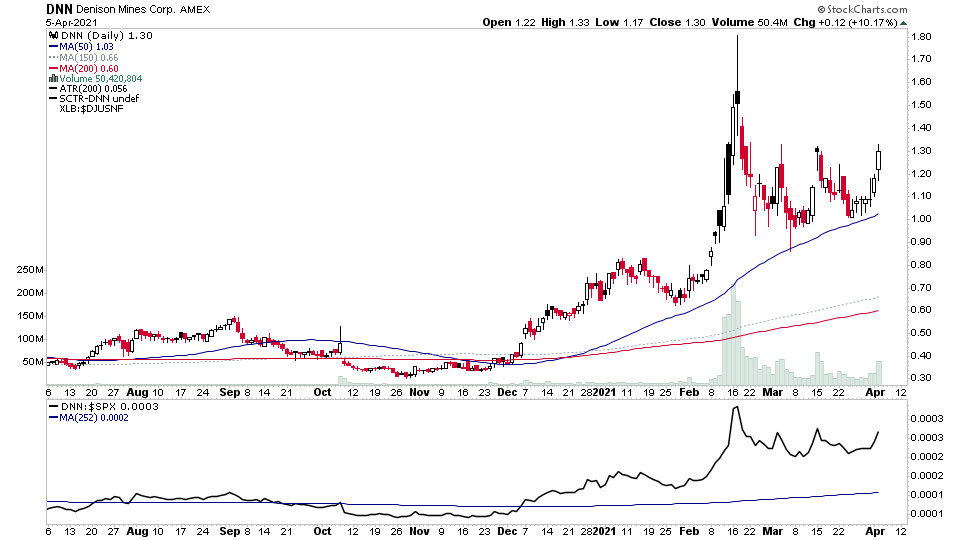
Uranium Group
The Uranium group was todays strongest group in which URA is the main ETF. Stocks from the group for the watchlist: NXE, UEC, DNN, CCJ, UUUU
Read More
05 April, 2021
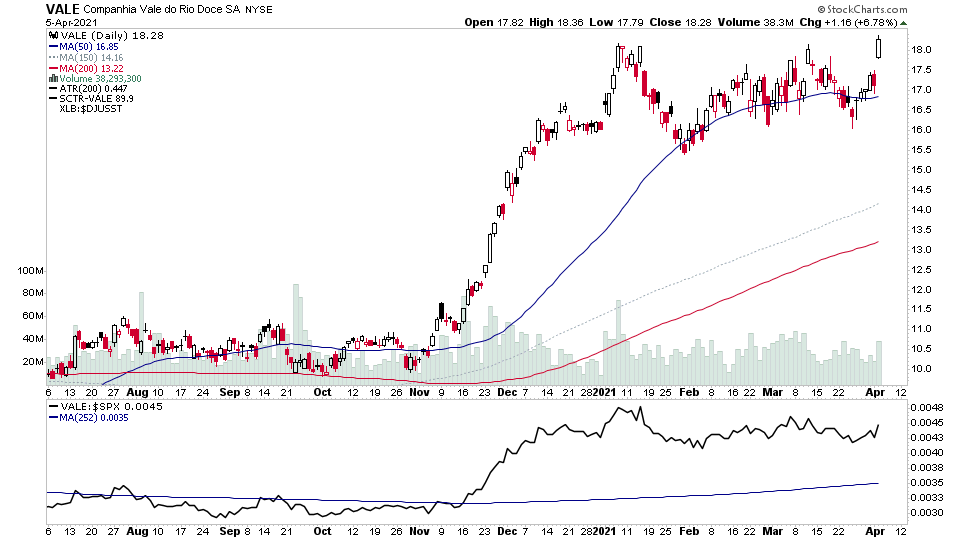
US Stocks Watchlist - 5 April 2021
For the watchlist from Mondays scans - APAM, BTBT, CTSH, DMYD, DXC, EL, GM, GROW, KEYS, MX, NCR, SLQT, TKAT, TRIP, TSLA, UA, UNFI, UUUU, VALE, VFC
Read More
04 April, 2021
US Stocks Watchlist - 4 April 2021
An exceptional large amount of stocks fro the watchlist from the weekend scans
Read More
31 March, 2021
US Stocks Watchlist - 31 March 2021
For the watchlist from Wednesdays scans - AVID, CONN, CPE, CRTO, PINS, PVH, QUOT, RAIL, SID, SLQT, TIGR, VALE, XONE
Read More
30 March, 2021
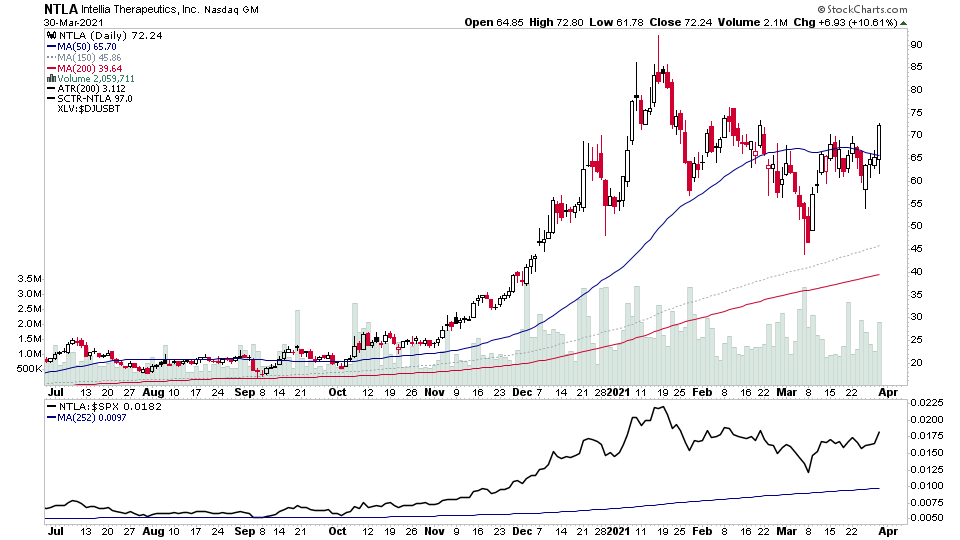
US Stocks Watchlist - 30 March 2021
For the watchlist from Tuesdays scans - AAL, DXC, KBH, LNTH, NTLA, TMHC
Read More
28 March, 2021
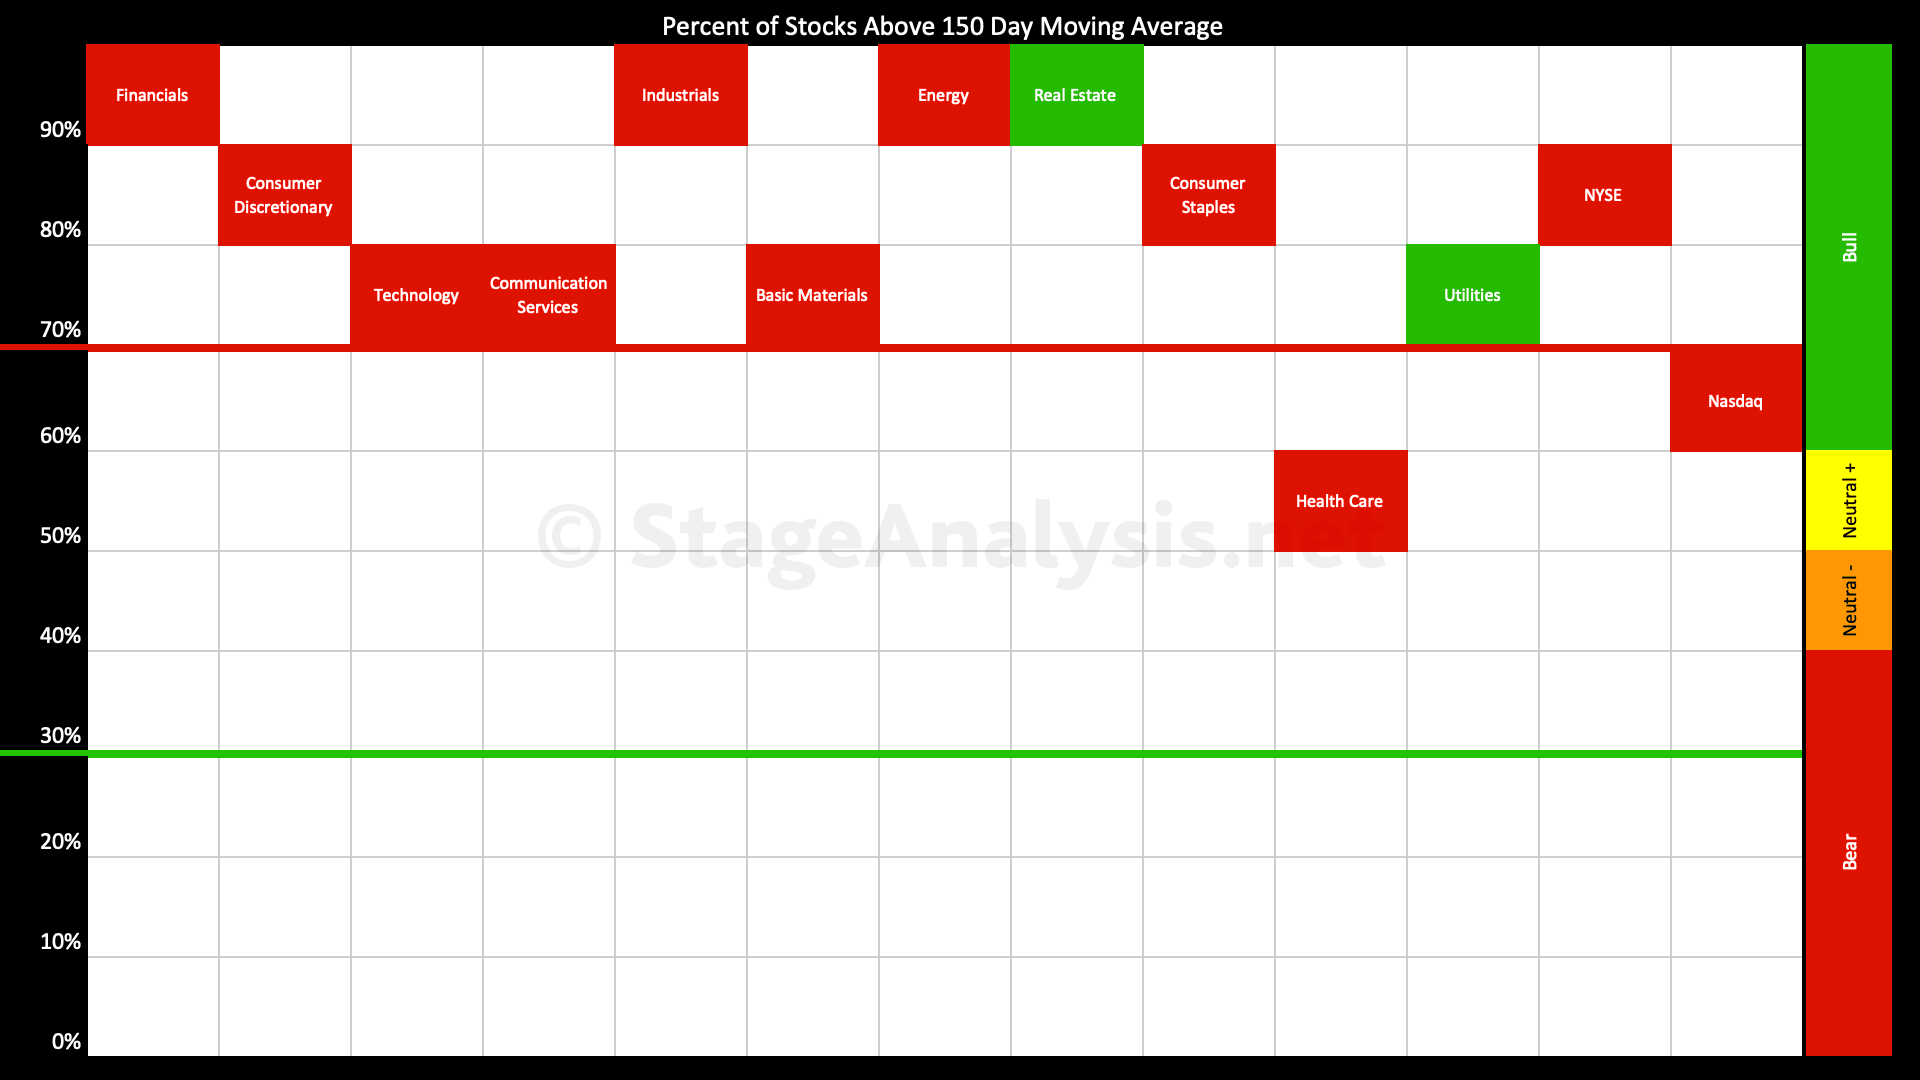
US Sectors: Percent of Stocks Above 150 Day Moving Averages
Sector Average at 82.35% (-2.32% 1wk) - which is in the Stage 2 zone. A negative week for the majority of sectors with only Utilities & Real Estate gaining.
Read More
28 March, 2021
US Stocks Watchlist - 28 March 2021
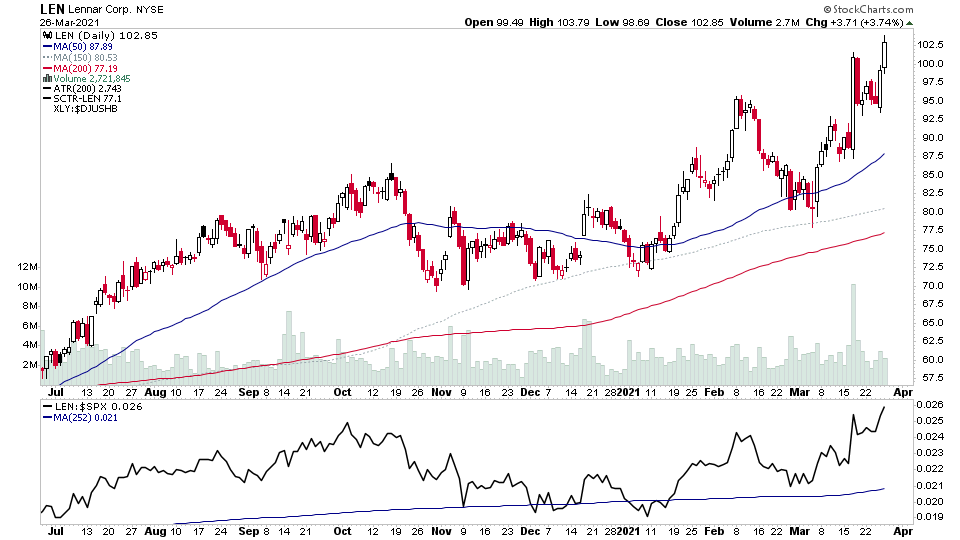
For the watchlist from the weekend scans - AA, ABB, ACN, AM, AMAT, AME, AR, AVGO, CDW, CENX, CNX, CPE, CVS, CVX, DHI, EOG, EQT, FBHS, KBH, LEN, MT, PAYX, PHM, RH, SEE, TMHC, TOL, UNP, UPST, VRTV, W, X
Read More