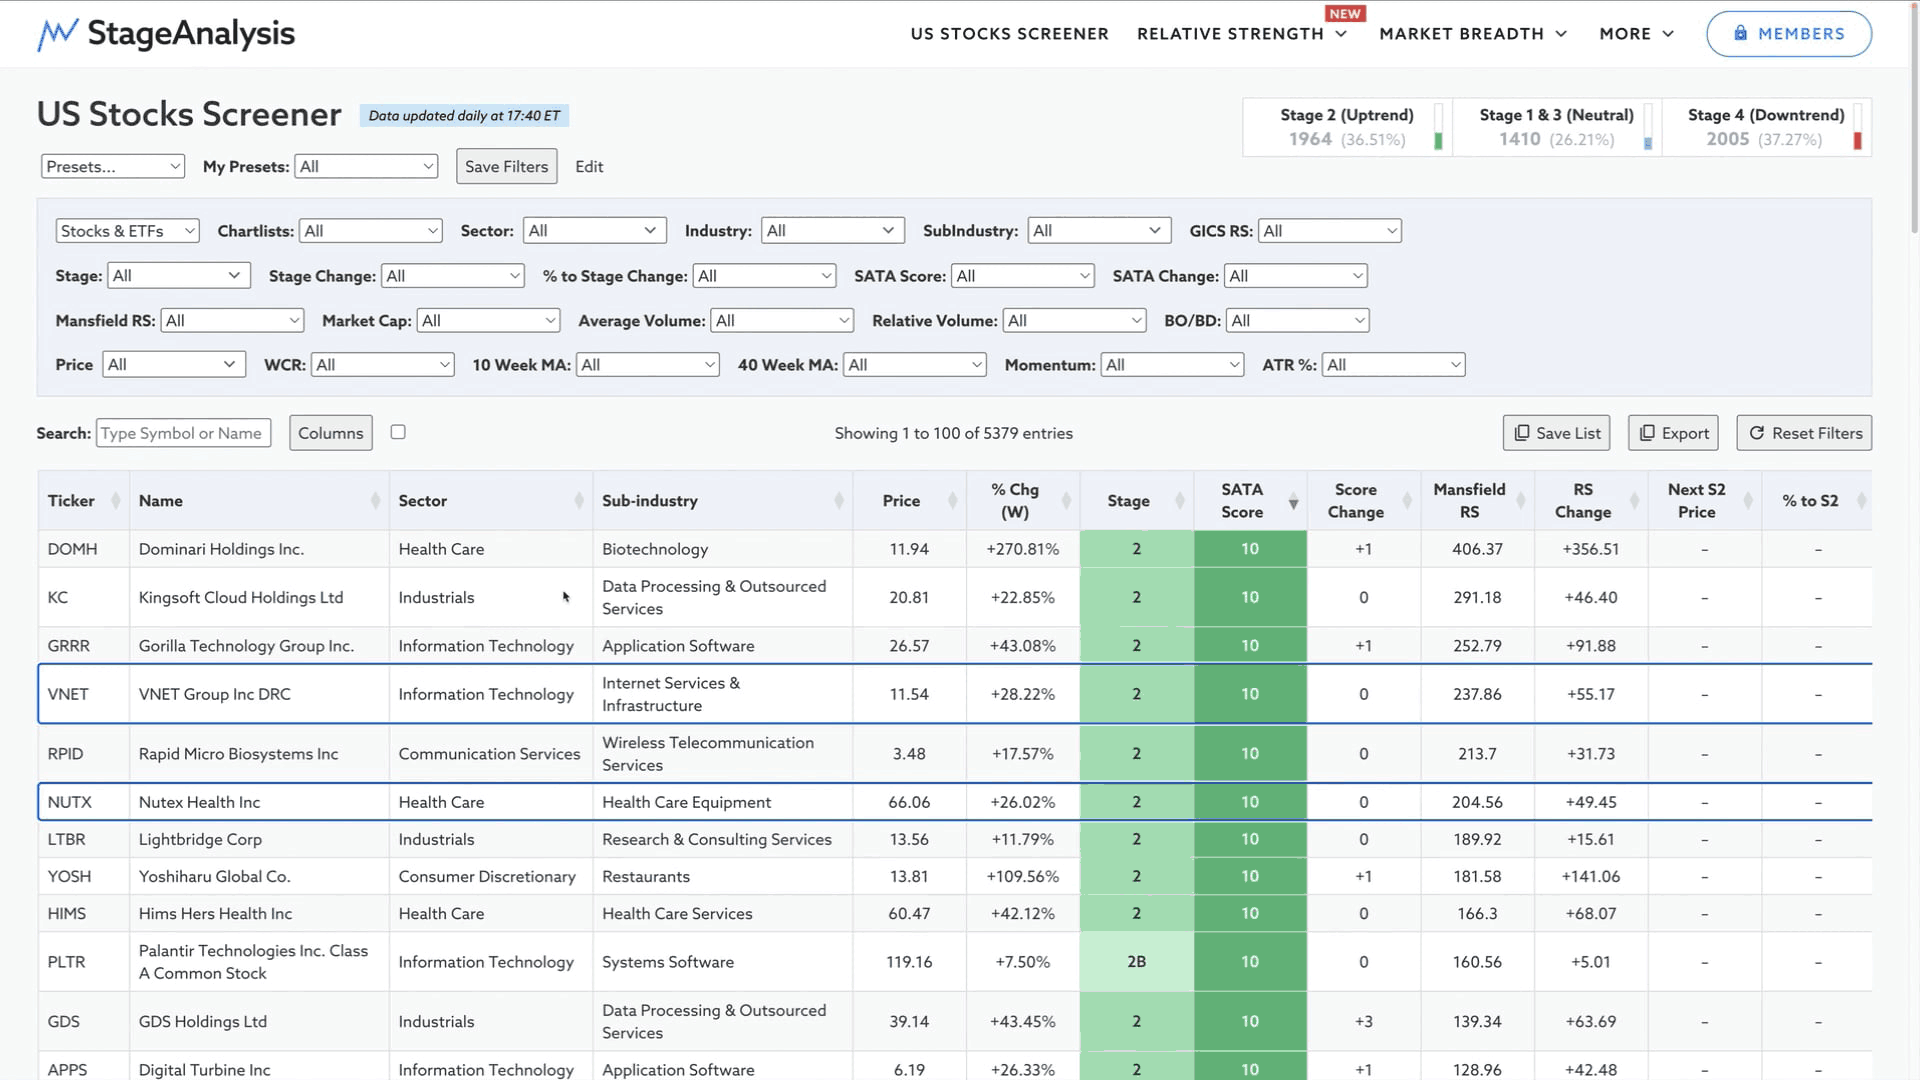
It's been another busy week of adding new features to the Stage Analysis Screener and also the Stages Summary. Here's a brief summary, but watch the video for detailed discussion of each...
Read More

Blog
13 February, 2025
US Stocks Watchlist – 13 February 2025
There were 16 stocks highlighted from the US stocks watchlist scans today...
Read More
11 February, 2025
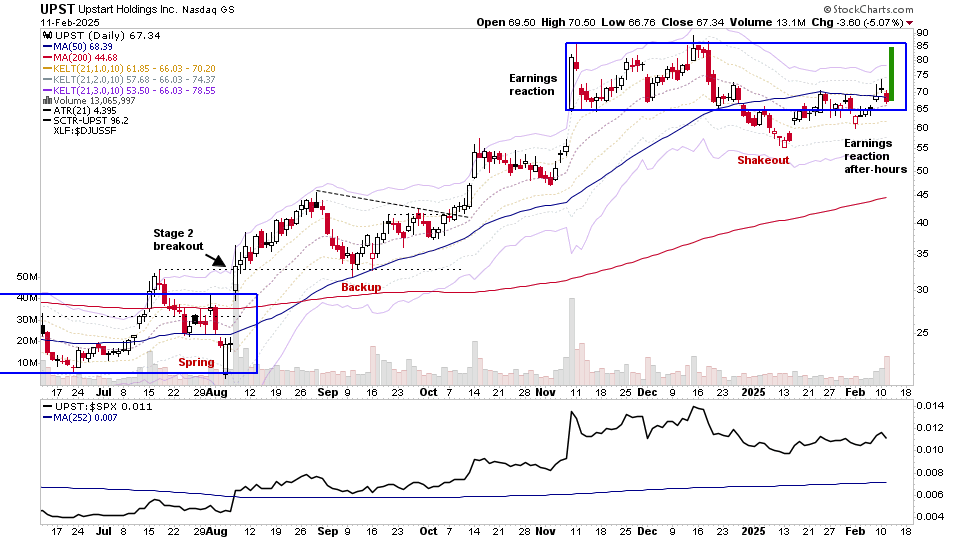
US Stocks Watchlist – 11 February 2025
There were 16 stocks highlighted from the US stocks watchlist scans today...
Read More
09 February, 2025
Stage Analysis Members Video – 9 February 2025 (1hr)
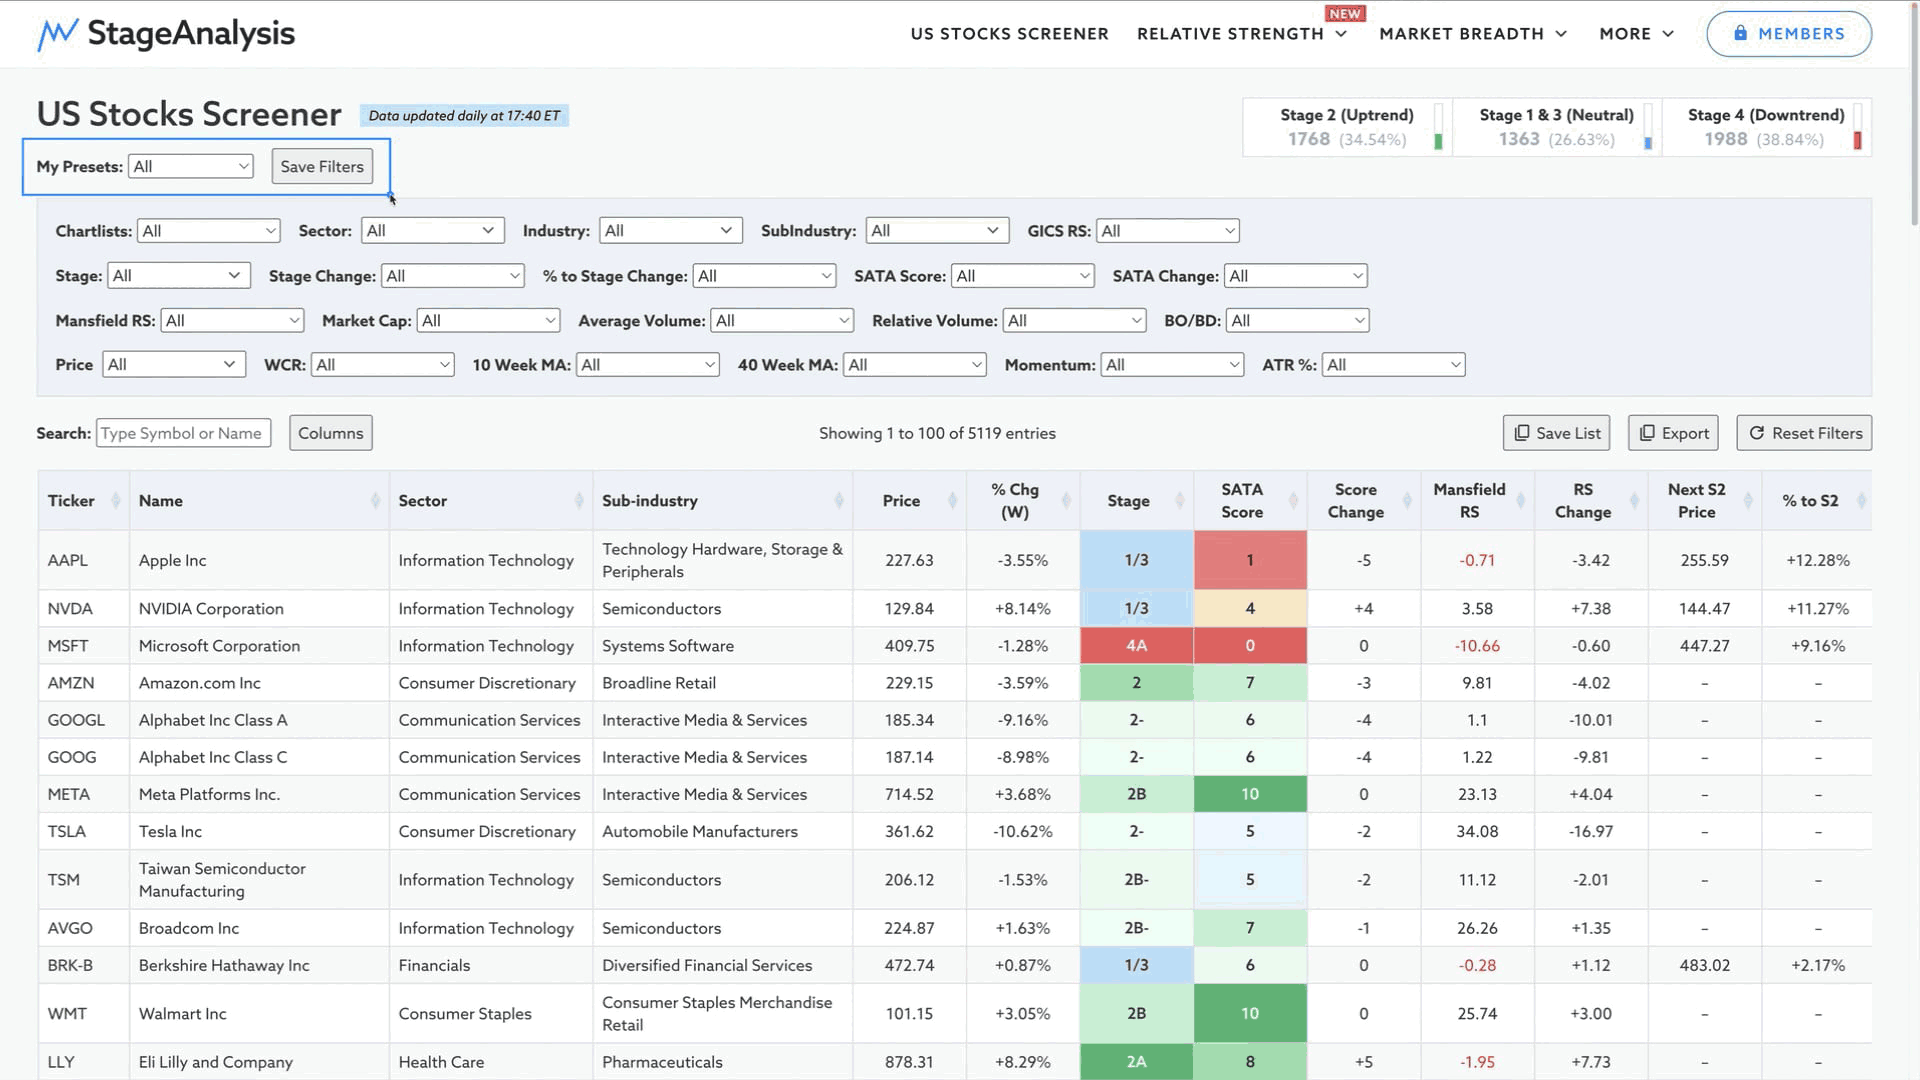
More new features have been added to the Stage Analysis Screener. So we begin the video by discussing how to use the NEW My Presets dropdown that is visible above the filters section. Followed by the US Watchlist Stocks in detail on multiple timeframes, Relative Strength Rankings, the Sector breadth and Sub-industries Bell Curves, the key Market Breadth Charts to determine the Weight of Evidence, Bitcoin & Ethereum and the Major US Stock Market Indexes Update and ETFs on the move.
Read More
09 February, 2025
US Stocks Watchlist – 9 February 2024
There were 14 stocks highlighted from the US stocks watchlist scans today...
Read More
08 February, 2025
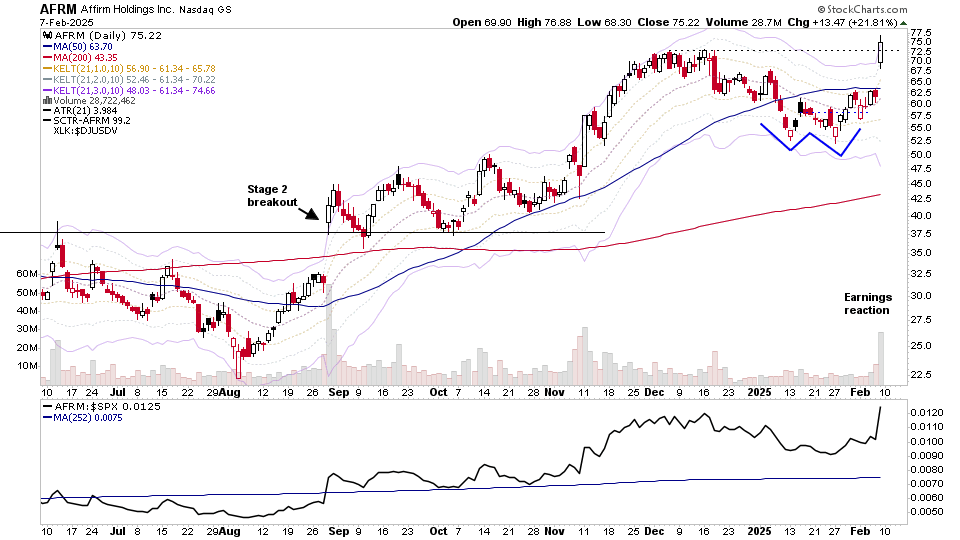
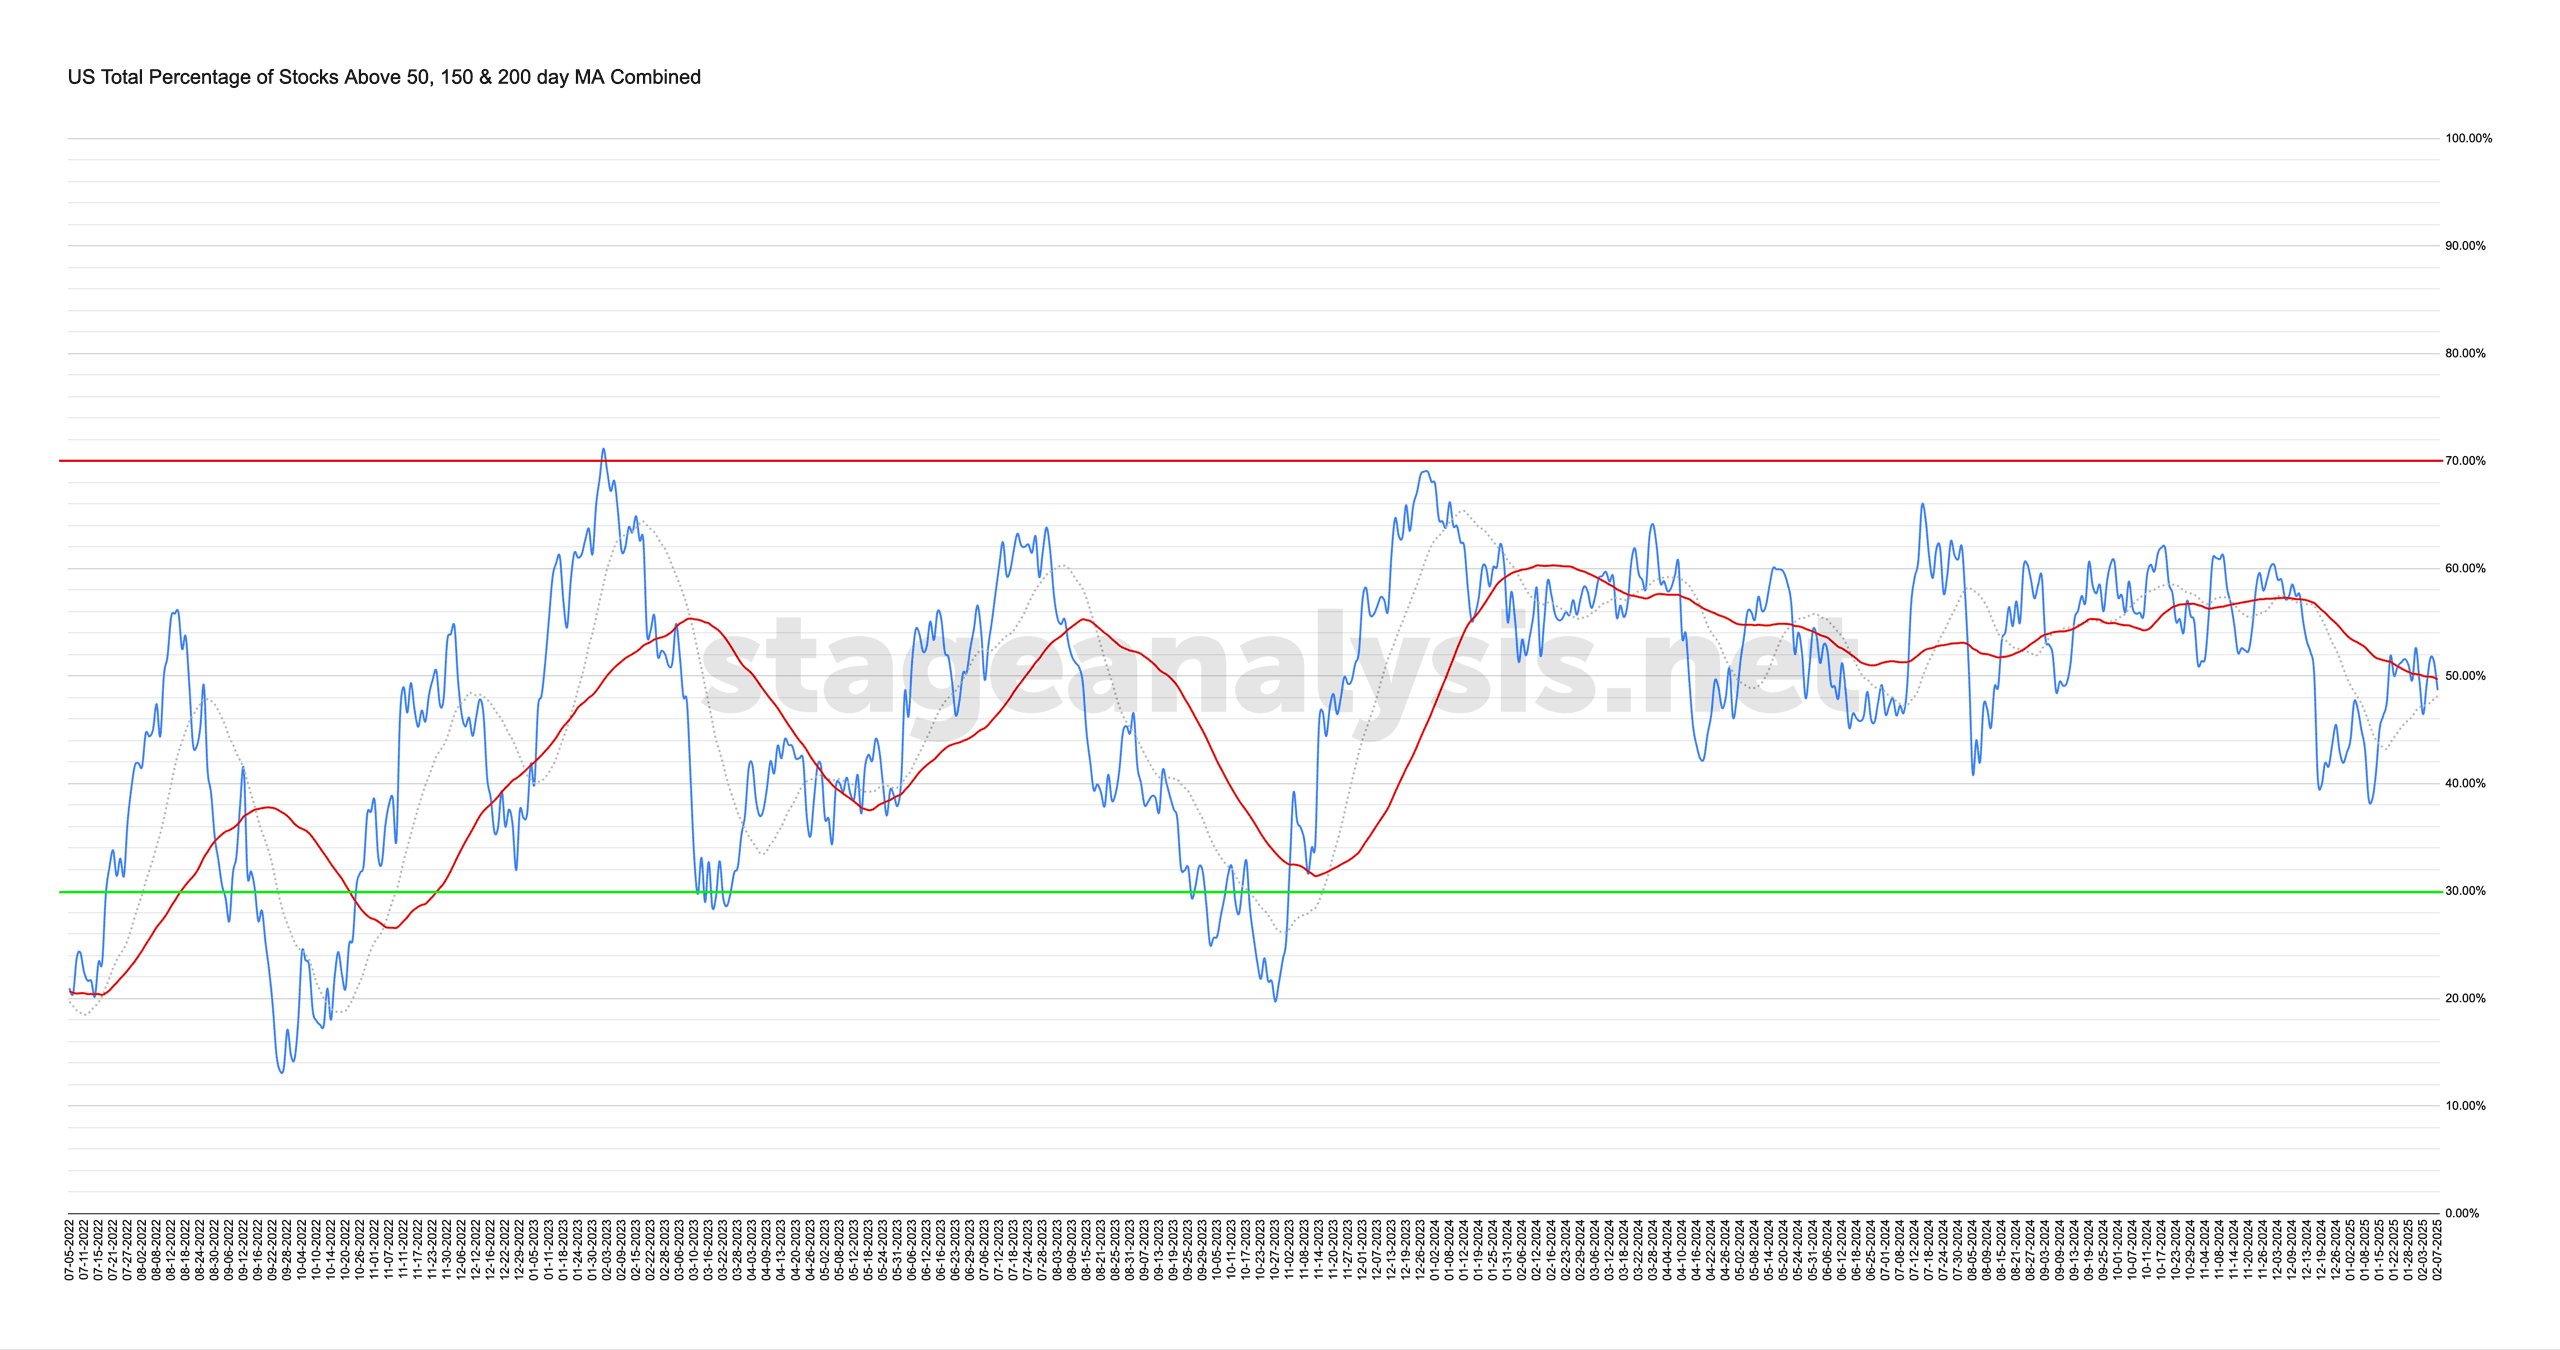
Market Breadth: Percentage of Stocks Above their 50 Day, 150 Day & 200 Day Moving Averages Combined
The US Total Percentage of Stocks above their 50 Day, 150 Day & 200 Day Moving Averages (shown above) decreased by -0.84% this week. Therefore, the overall combined average is at 48.68% in the US market (NYSE and Nasdaq markets combined) above their short, medium and long term moving averages.
Read More
06 February, 2025
US Stocks Watchlist – 6 February 2025
There were 14 stocks highlighted from the US stocks watchlist scans today...
Read More
04 February, 2025
US Stocks Watchlist – 4 February 2025
There were 17 stocks highlighted from the US stocks watchlist scans today...
Read More
02 February, 2025
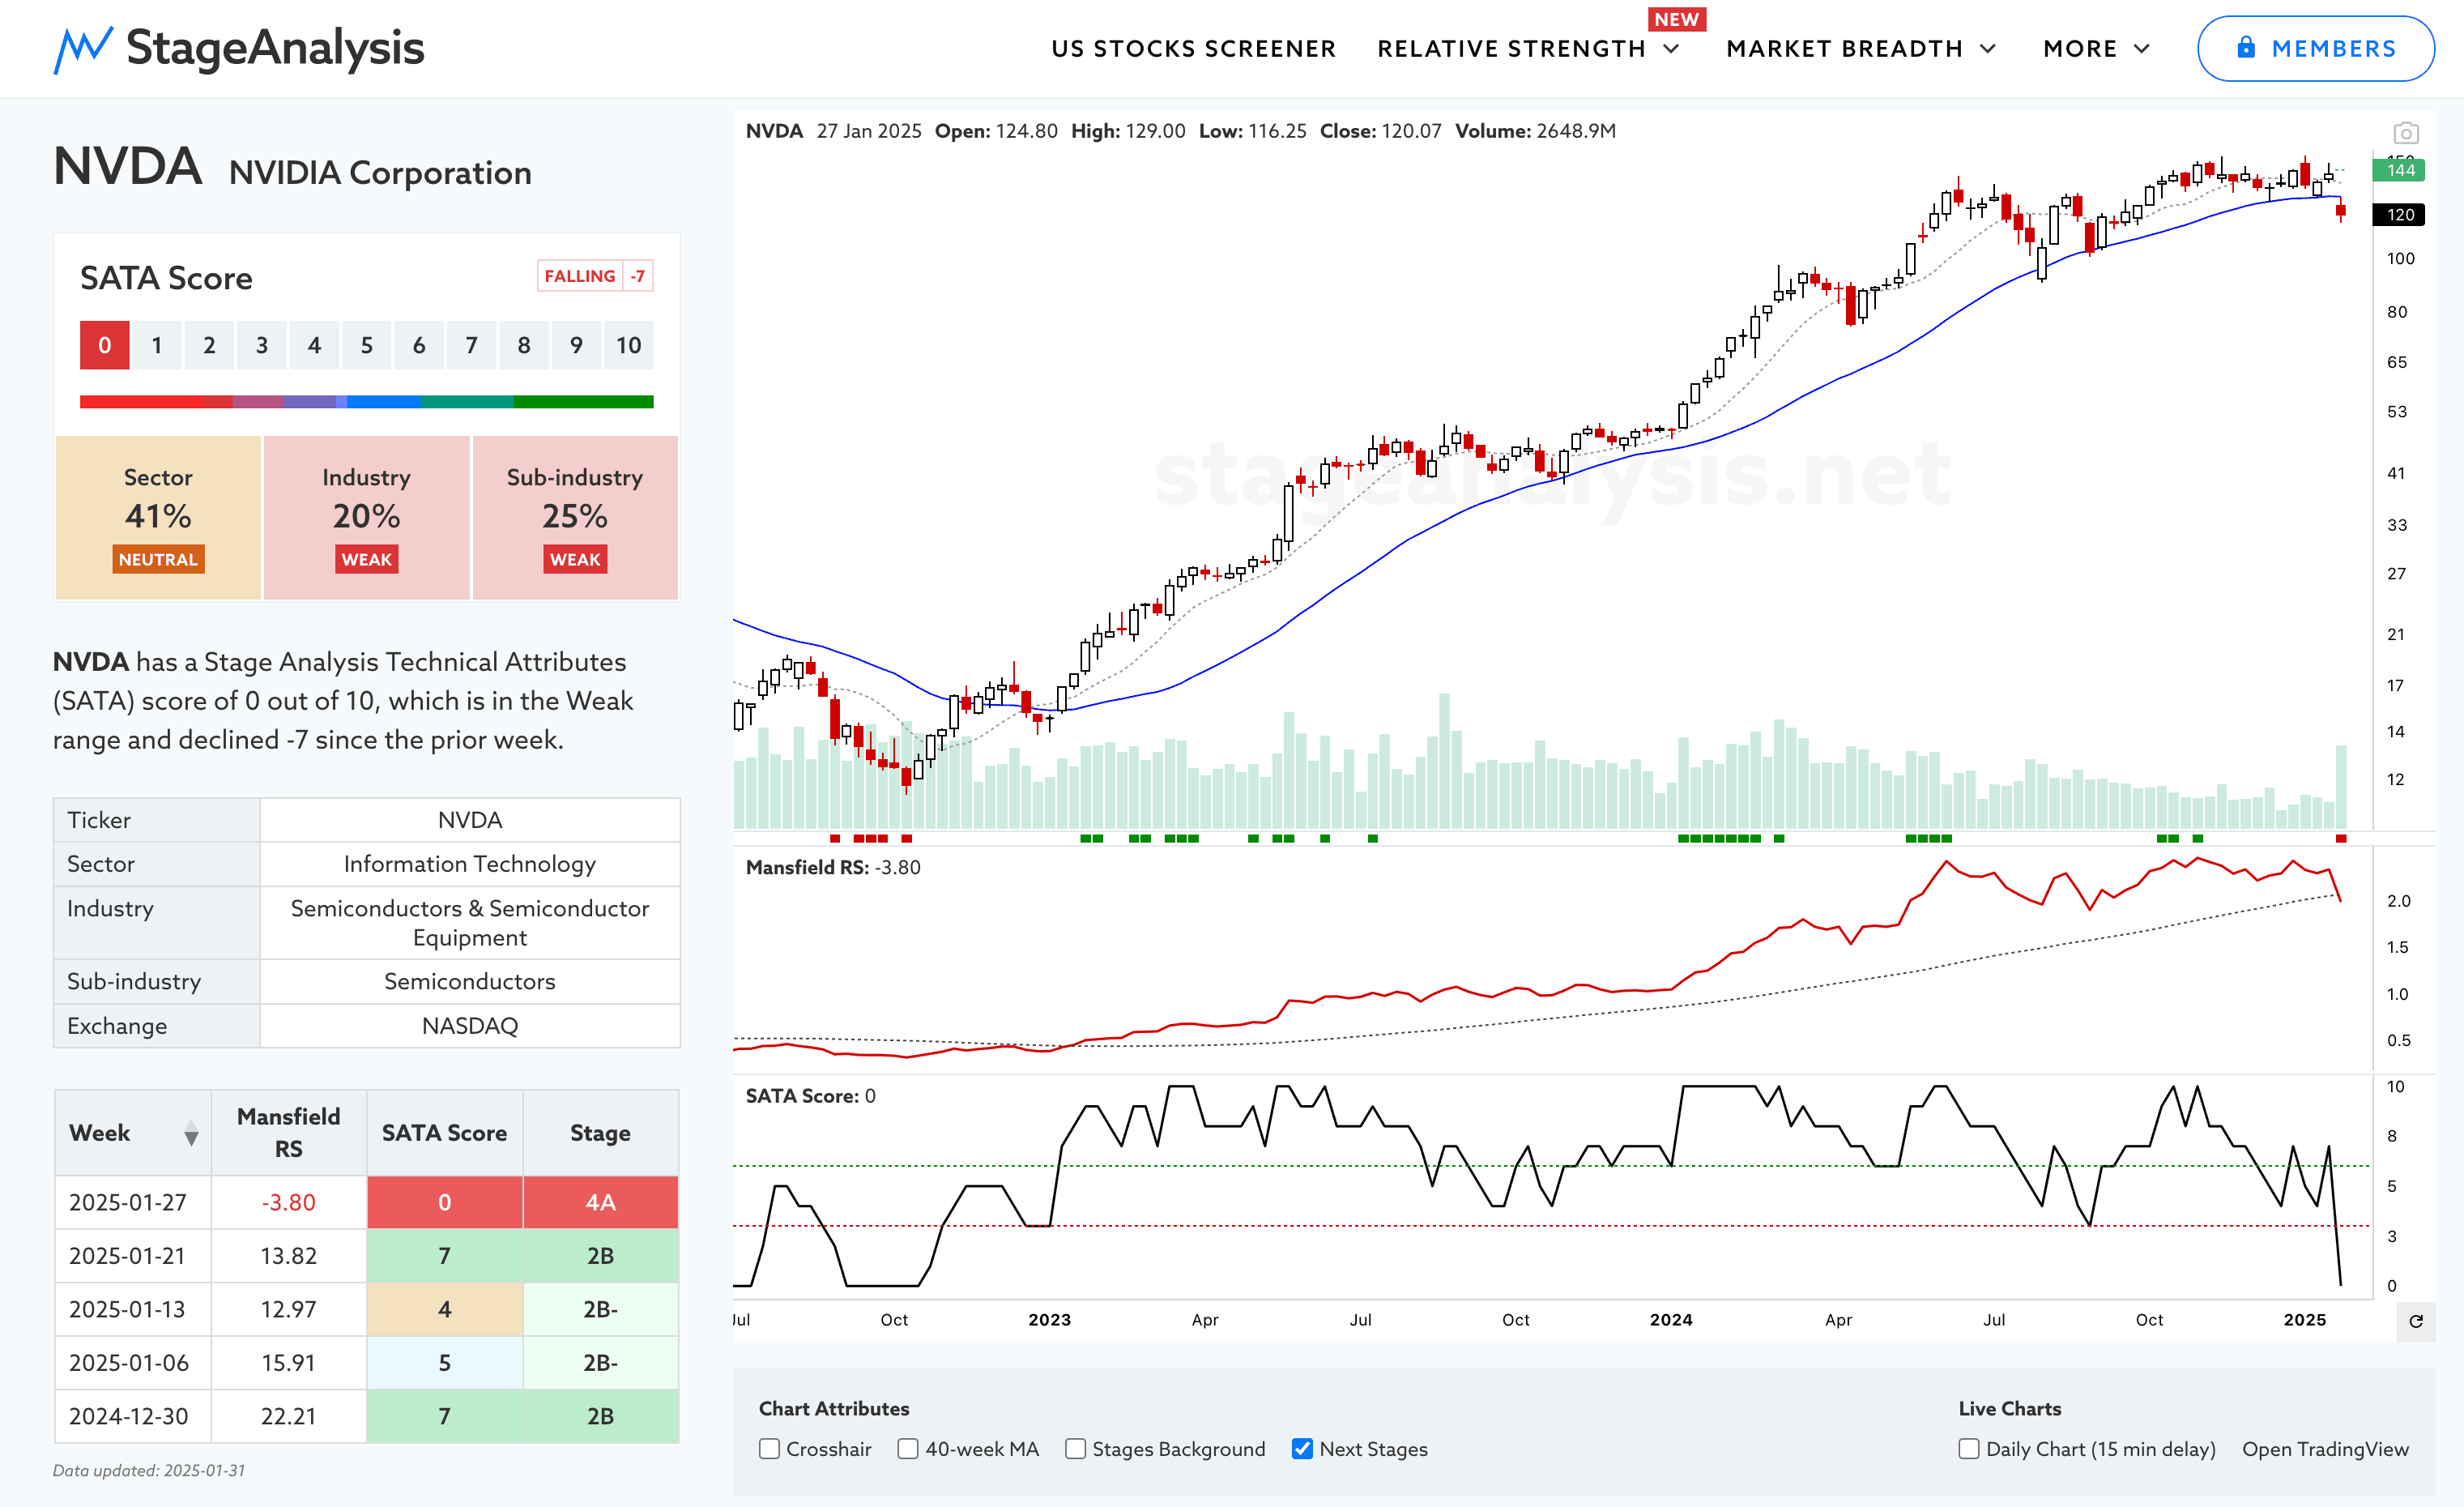
Stage Analysis Members Video – 2 February 2025 (1hr 13mins)
This weeks video starts with a discussion of NVDA, as it made its first Stage 4A breakdown attempt in multiple years. Followed by how to use the new screener filters to find stocks in similar positions to what I show in the US Watchlist Stocks posts each week...
Read More
02 February, 2025
US Stocks Watchlist – 2 February 2024
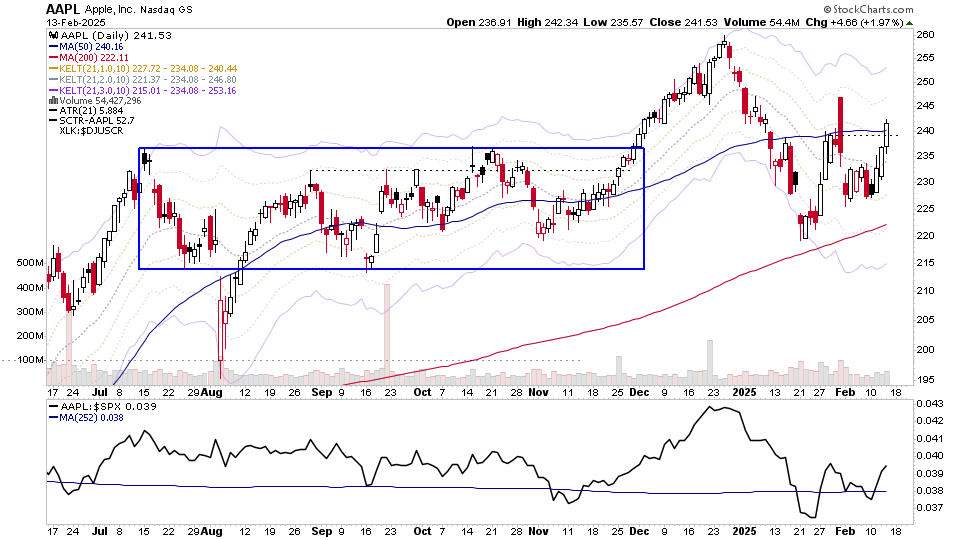
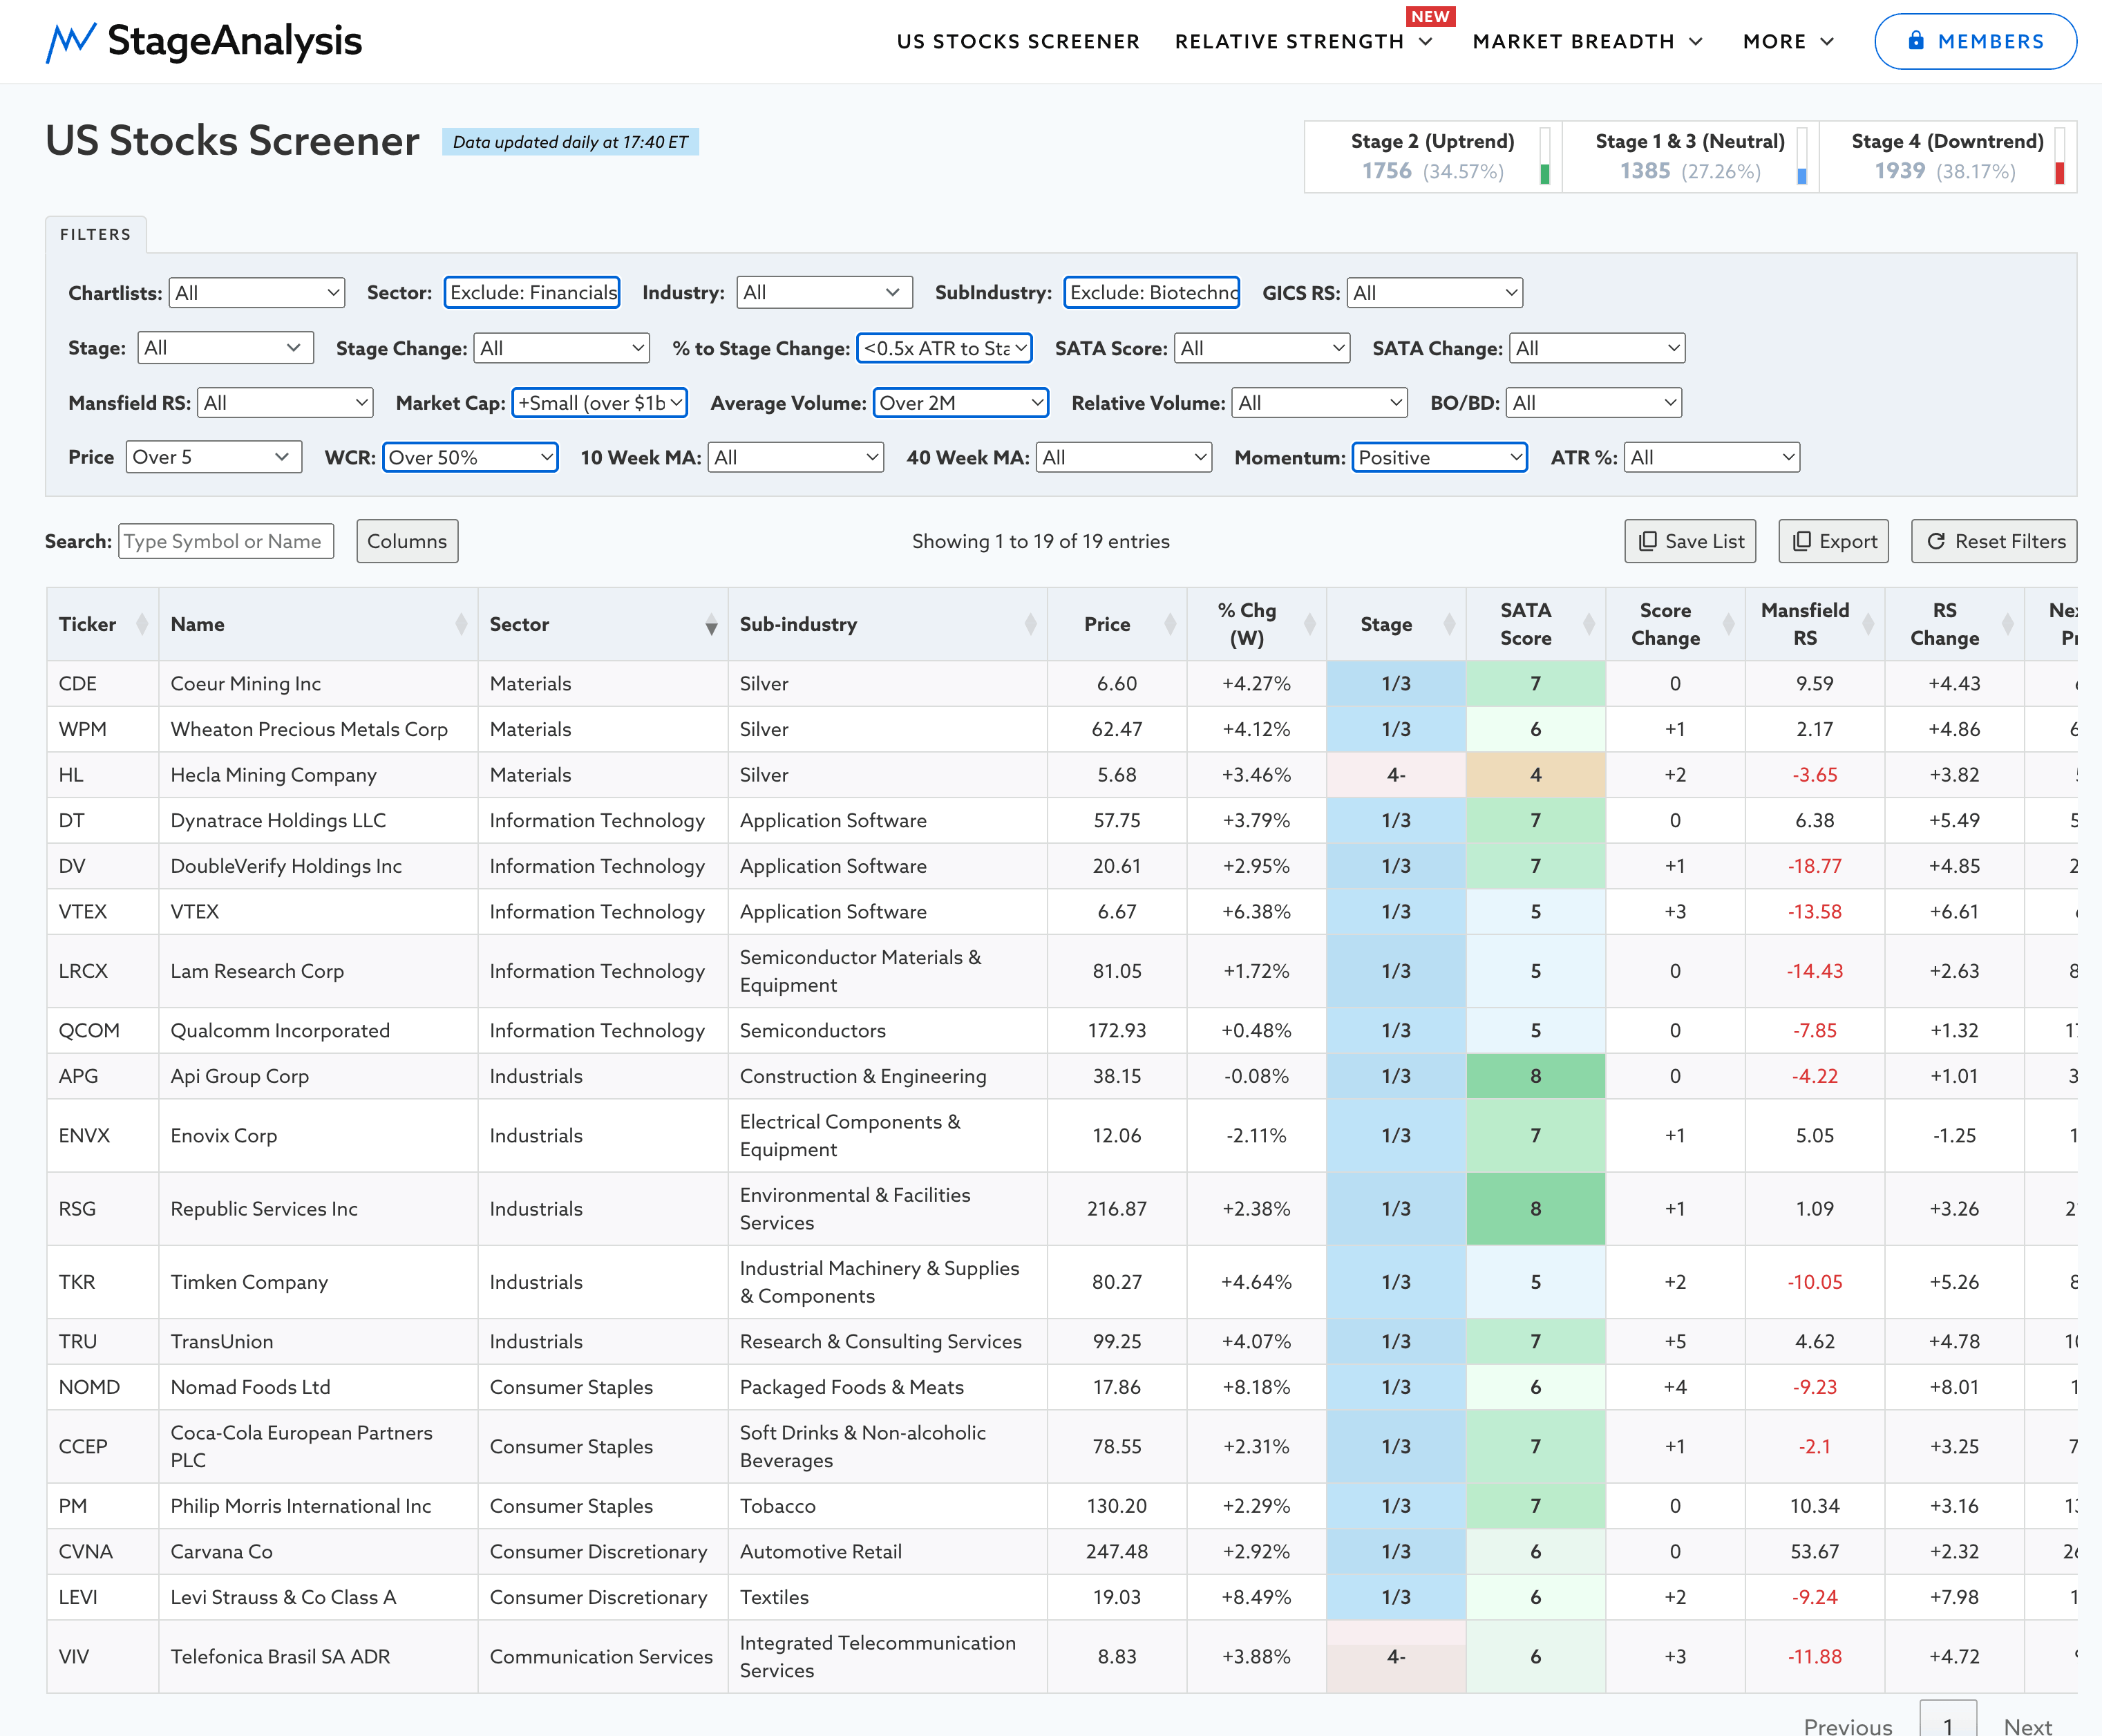
I thought I'd do something a little bit different today from the usual watchlist post, as I've added multiple new features in the last few weeks to the Stage Analysis Screener, Stage 2 and Stage 4 levels on the weekly stock charts (see AAPL for example and hover over the current weekly candlestick), and other areas of the website too, like the new Relative Strength pages – where you can see sub-industries and sectors etc ranked by strongest to weakest, and also their percentage changes for the current week and multiple other periods over the last year...
Read More