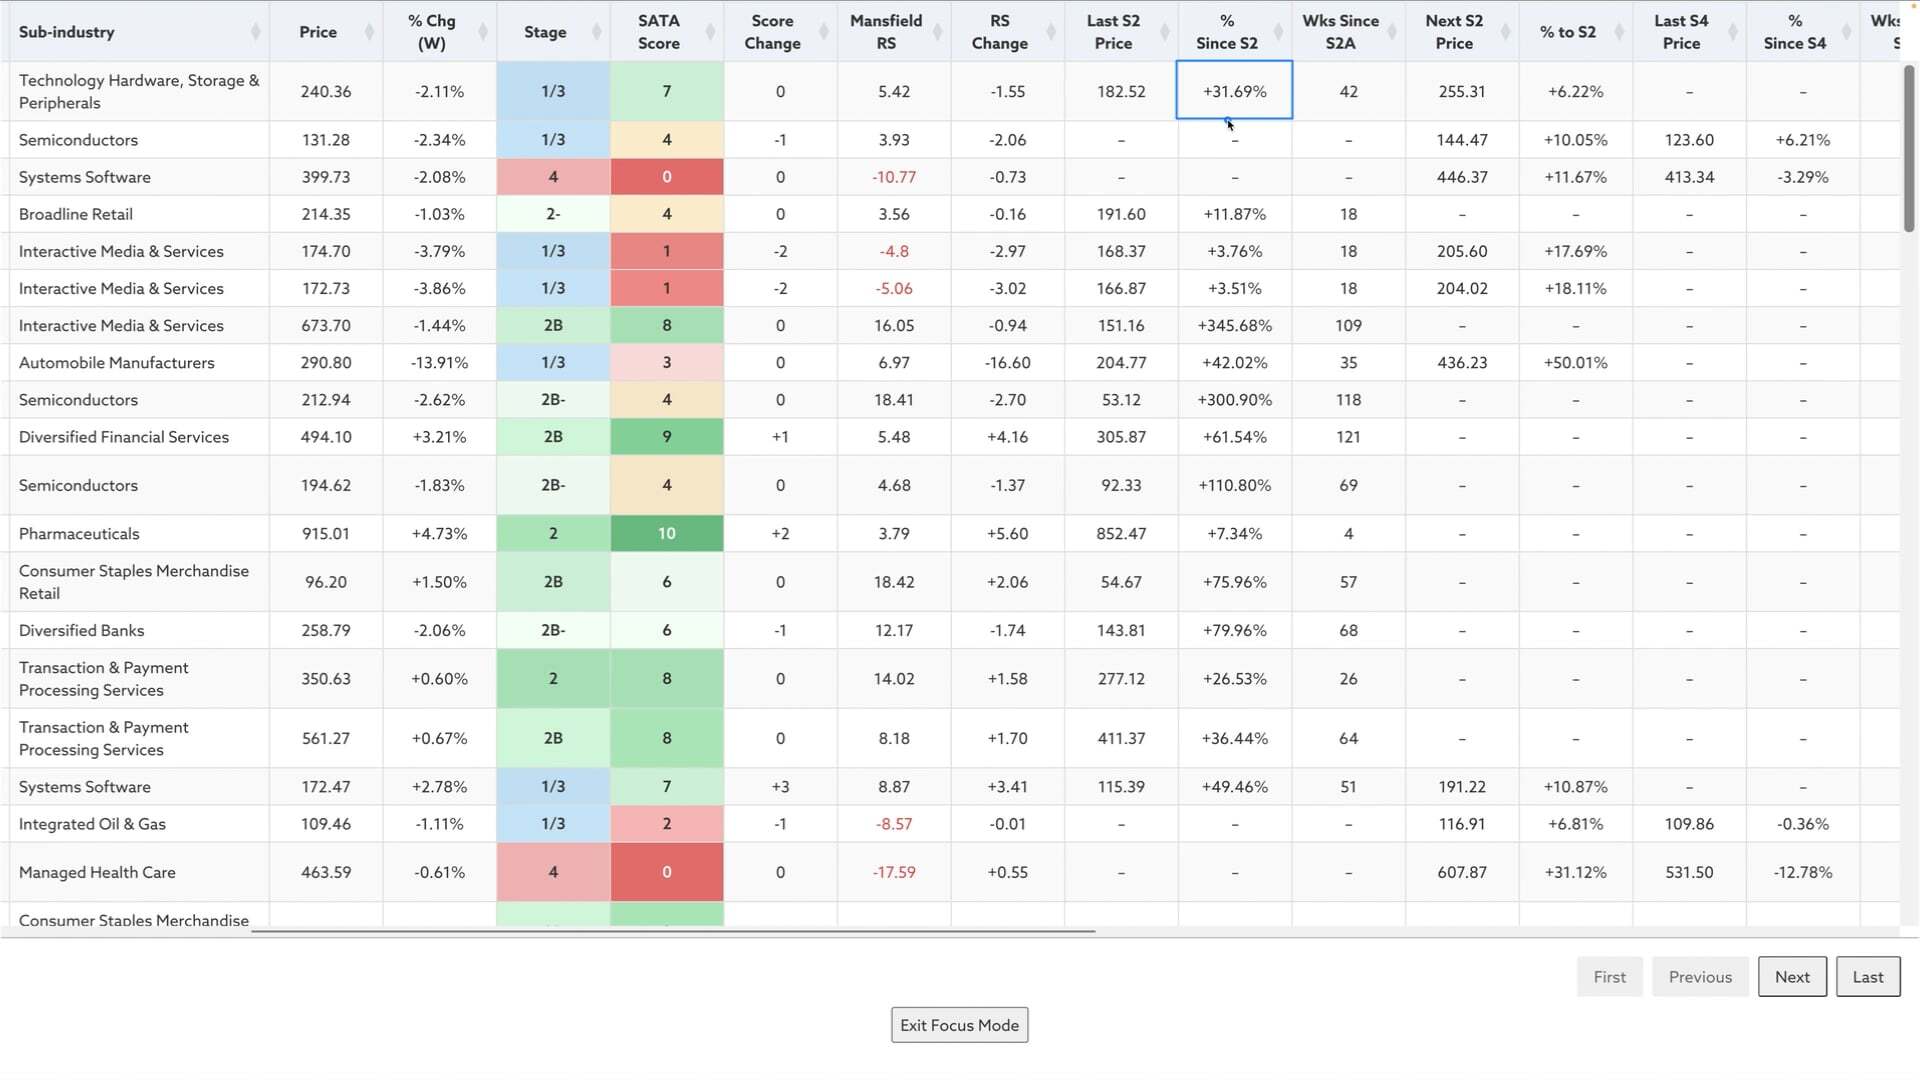
Four new data columns have been added to the Stage Analysis Screener – Last S2 Price. % Since S2. Last S4 Price. % Since S4...
Read More

Blog
25 February, 2025
US Stocks Watchlist – 25 February 2025
There were 17 stocks highlighted from the US stocks watchlist scans today...
Read More
23 February, 2025
Stage Analysis Members Video – 23 February 2025 (38mins)
The Stage Analysis members weekend video begins with a discussion of the major US stocks and how to use the Stage Analysis Screener to find weakness. Followed by the Stages Summary, Relative Strength Rankings, the Sector breadth and Sub-industries Bell Curves, the key Market Breadth Charts to determine the Weight of Evidence, Bitcoin & Ethereum and the Major US Stock Market Indexes Update and ETFs on the move.
Read More

22 February, 2025
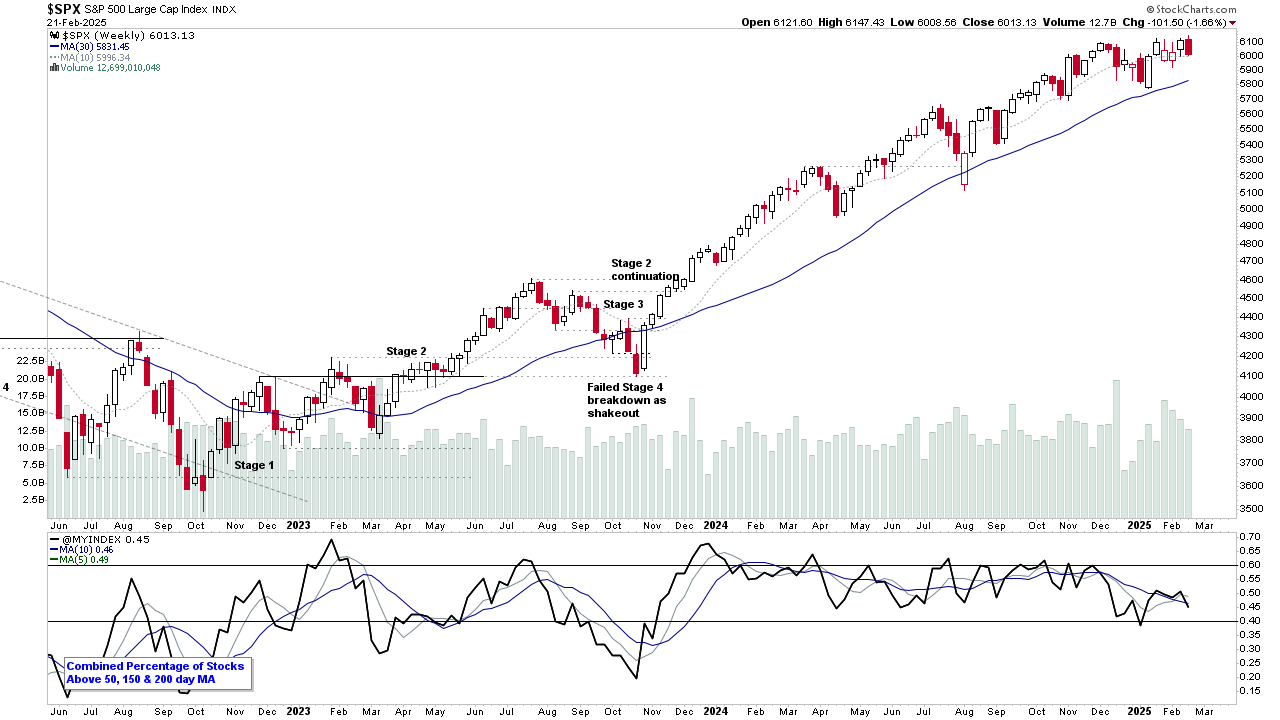
Market Breadth: Percentage of Stocks Above their 50 Day, 150 Day & 200 Day Moving Averages Combined
The US Total Percentage of Stocks above their 50 Day, 150 Day & 200 Day Moving Averages (shown above) decreased by -5.82% this week. Therefore, the overall combined average is at 45.09% in the US market (NYSE and Nasdaq markets combined) above their short, medium and long term moving averages.
Read More
20 February, 2025
US Stocks Watchlist – 20 February 2025
There were 15 stocks highlighted from the US stocks watchlist scans today...
Read More
18 February, 2025
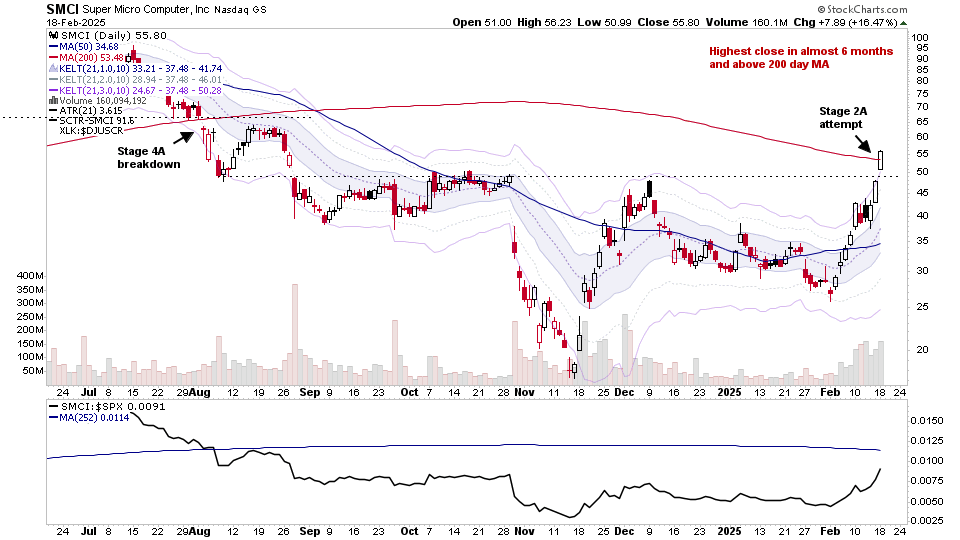
US Stocks Watchlist – 18 February 2025
There were 17 stocks highlighted from the US stocks watchlist scans today...
Read More
18 February, 2025
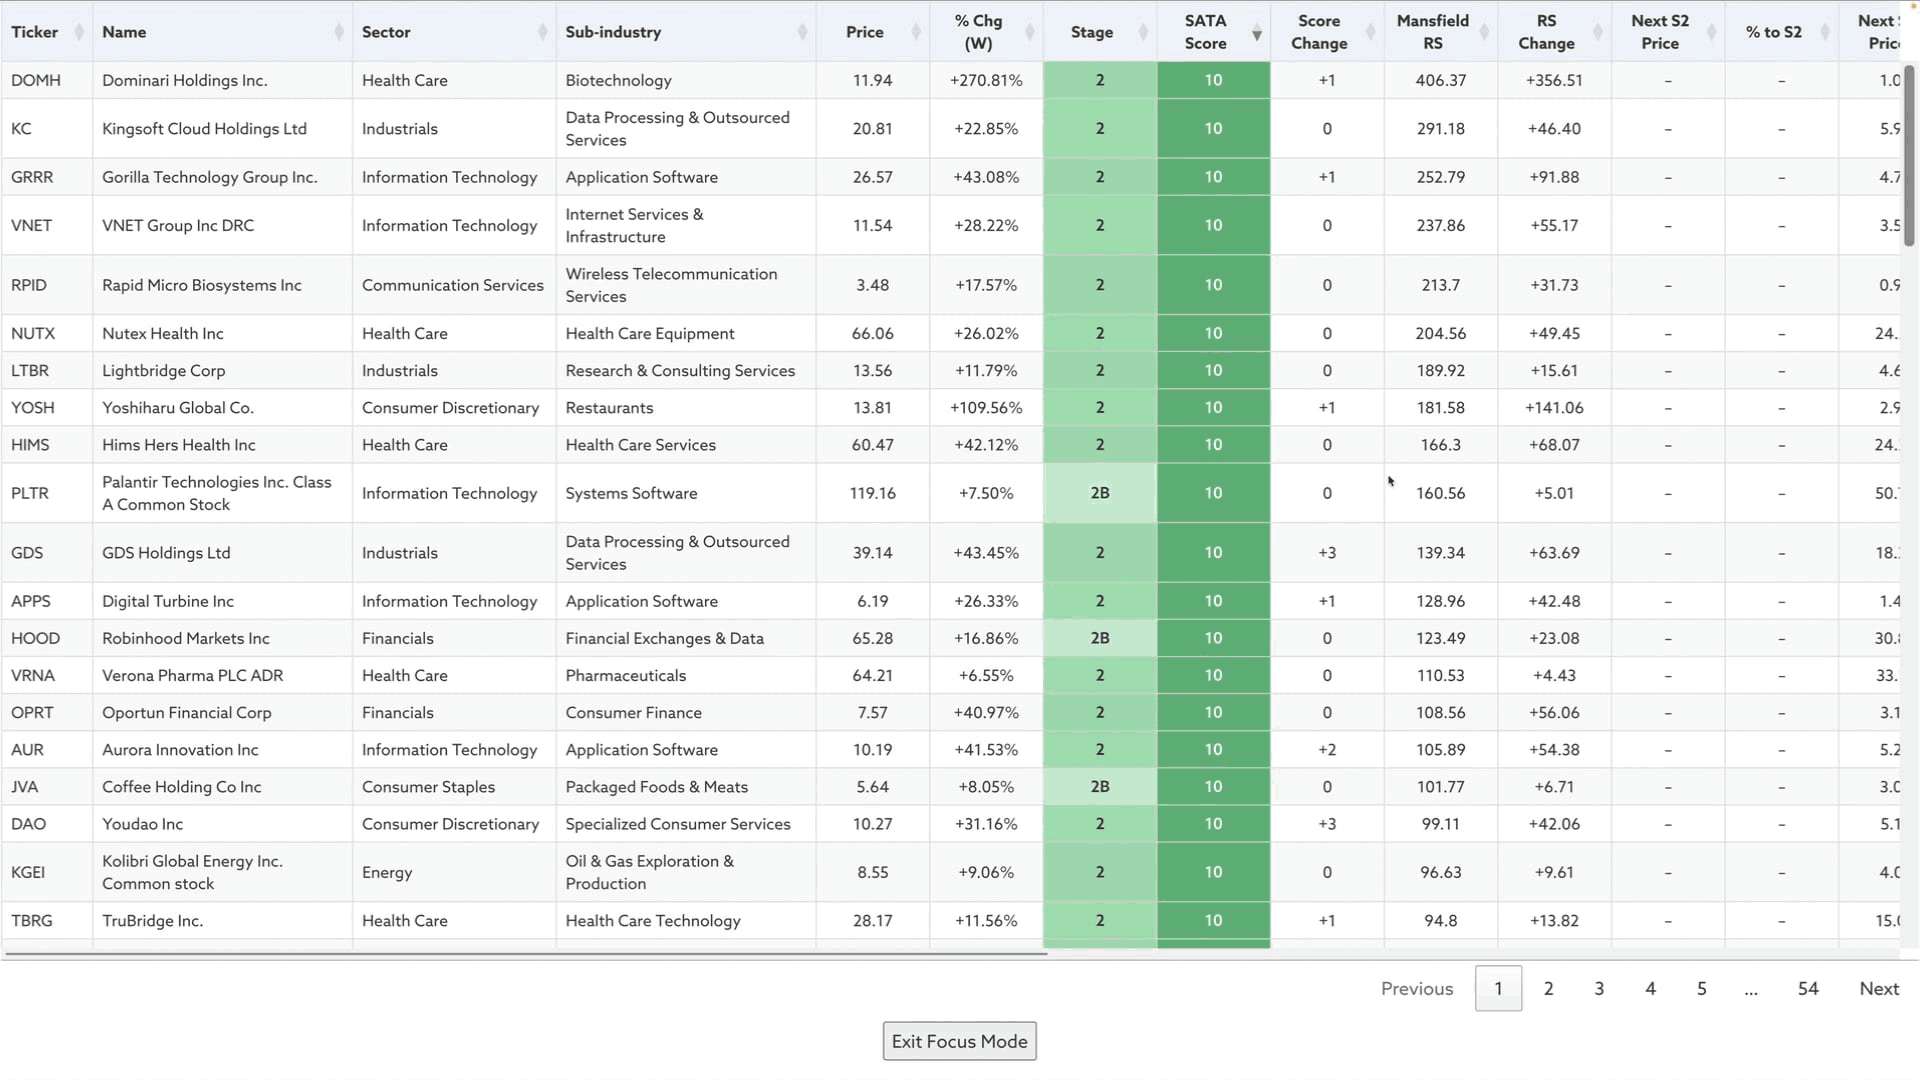
Video: New Features: Fixed Headings and Focus Mode – 18 February 2025
New Features added: Fixed Headings in the table and Focus Mode: Full screen table view
Read More
17 February, 2025
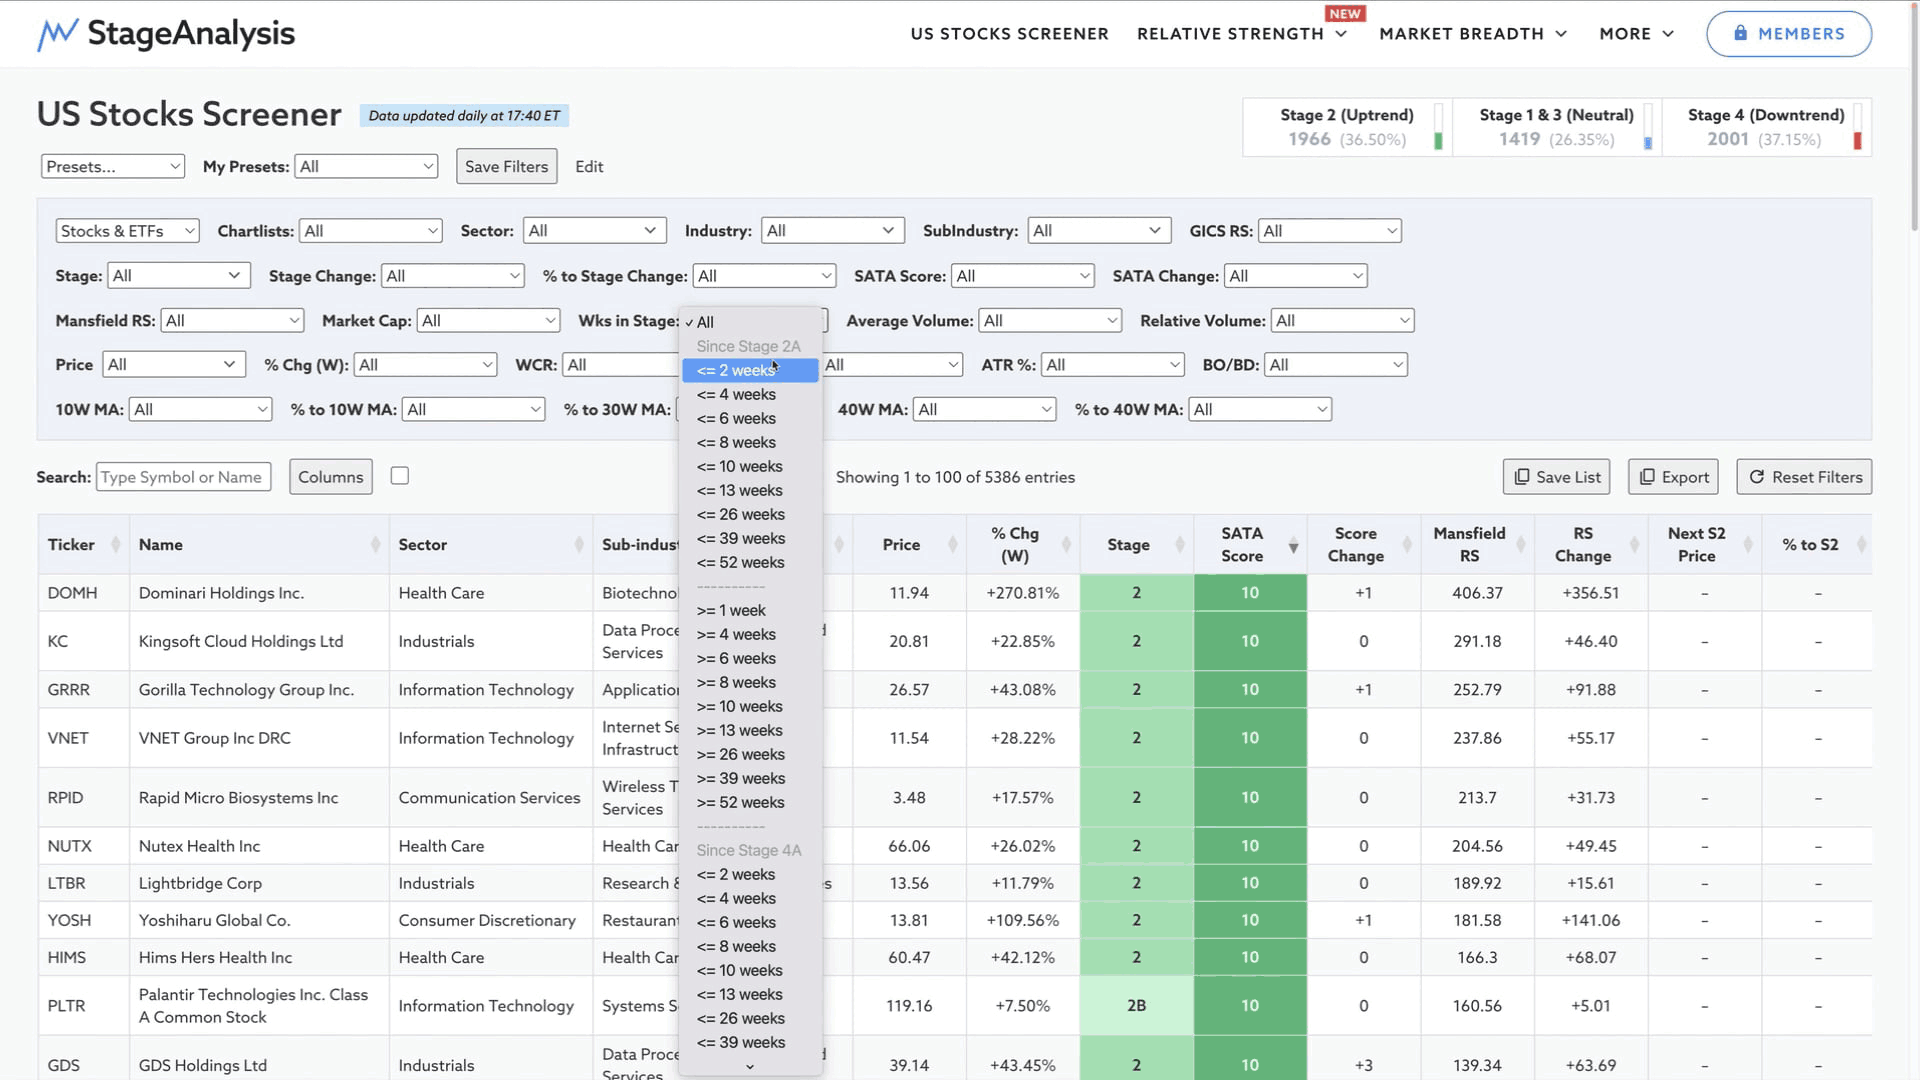
Video: Five New Filters Added to the Stage Analysis Screener – 17 February 2025
Another five additional filters were added to the Stage Analysis Screener today...
Read More
16 February, 2025
Stage Analysis Members Video – 16 February 2025 (58mins)
The Stage Analysis members weekend video begins with discussion of the the US Watchlist Stocks in detail on multiple timeframes, Stages Summary including the new Sub-stages summary added this week. Relative Strength Rankings, the Sector breadth and Sub-industries Bell Curves, the key Market Breadth Charts to determine the Weight of Evidence, Bitcoin & Ethereum and the Major US Stock Market Indexes Update and ETFs on the move.
Read More
16 February, 2025
US Stocks Watchlist – 16 February 2025
There were 22 stocks highlighted from the US stocks watchlist scans today...
Read More