There were 20 stocks highlighted from the US stocks watchlist scans today...
Read More

Blog
05 August, 2025
US Stocks Watchlist – 5 Aug 2025
03 August, 2025
Stage Analysis Members Video – 3 Aug 2025 (50mins)
The Stage Analysis members video highlighting the new mini charts added to the Relative Strength Rankings, the recent US Watchlist Stocks in detail on multiple timeframes, Stage 2 Breakout attempts, Stages Summary, the Sector breadth and Sub-industries Bell Curves, the key Market Breadth Charts to determine the Weight of Evidence, Bitcoin & Ethereum, the Major US Stock Market Indexes and ETF Summary.
Read More
03 August, 2025
US Stocks Watchlist – 3 Aug 2025
There were 18 stocks highlighted from the US stocks watchlist scans today...
Read More
02 August, 2025
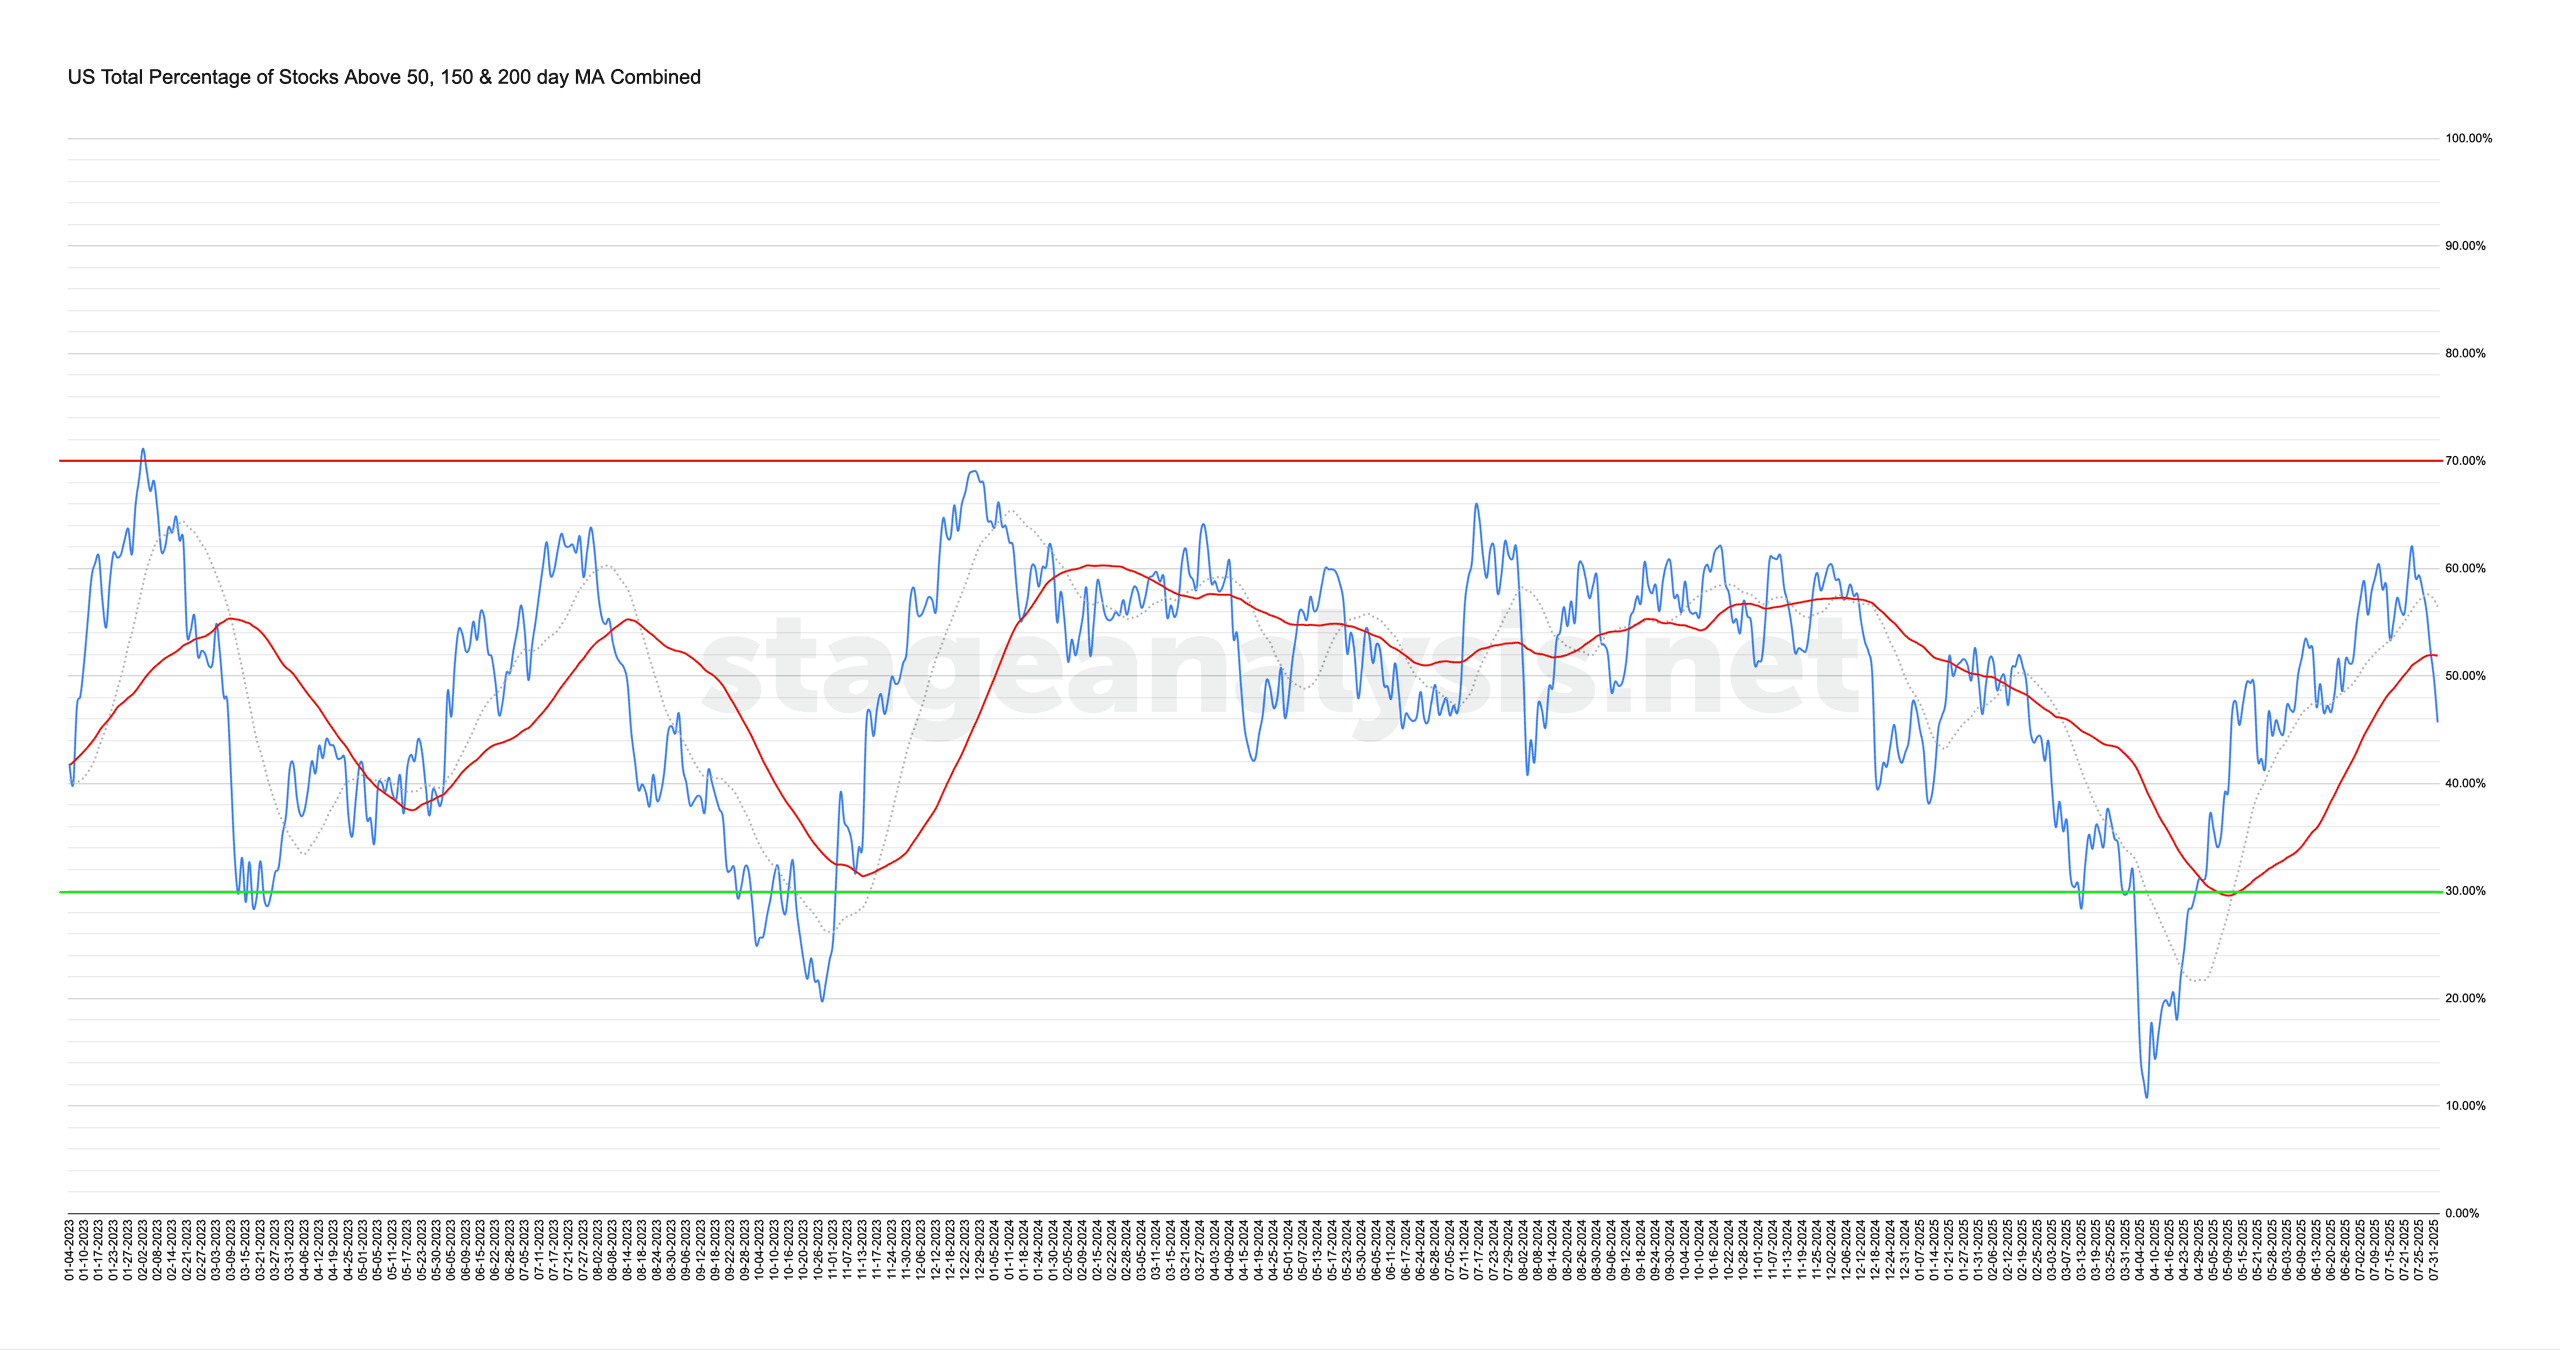
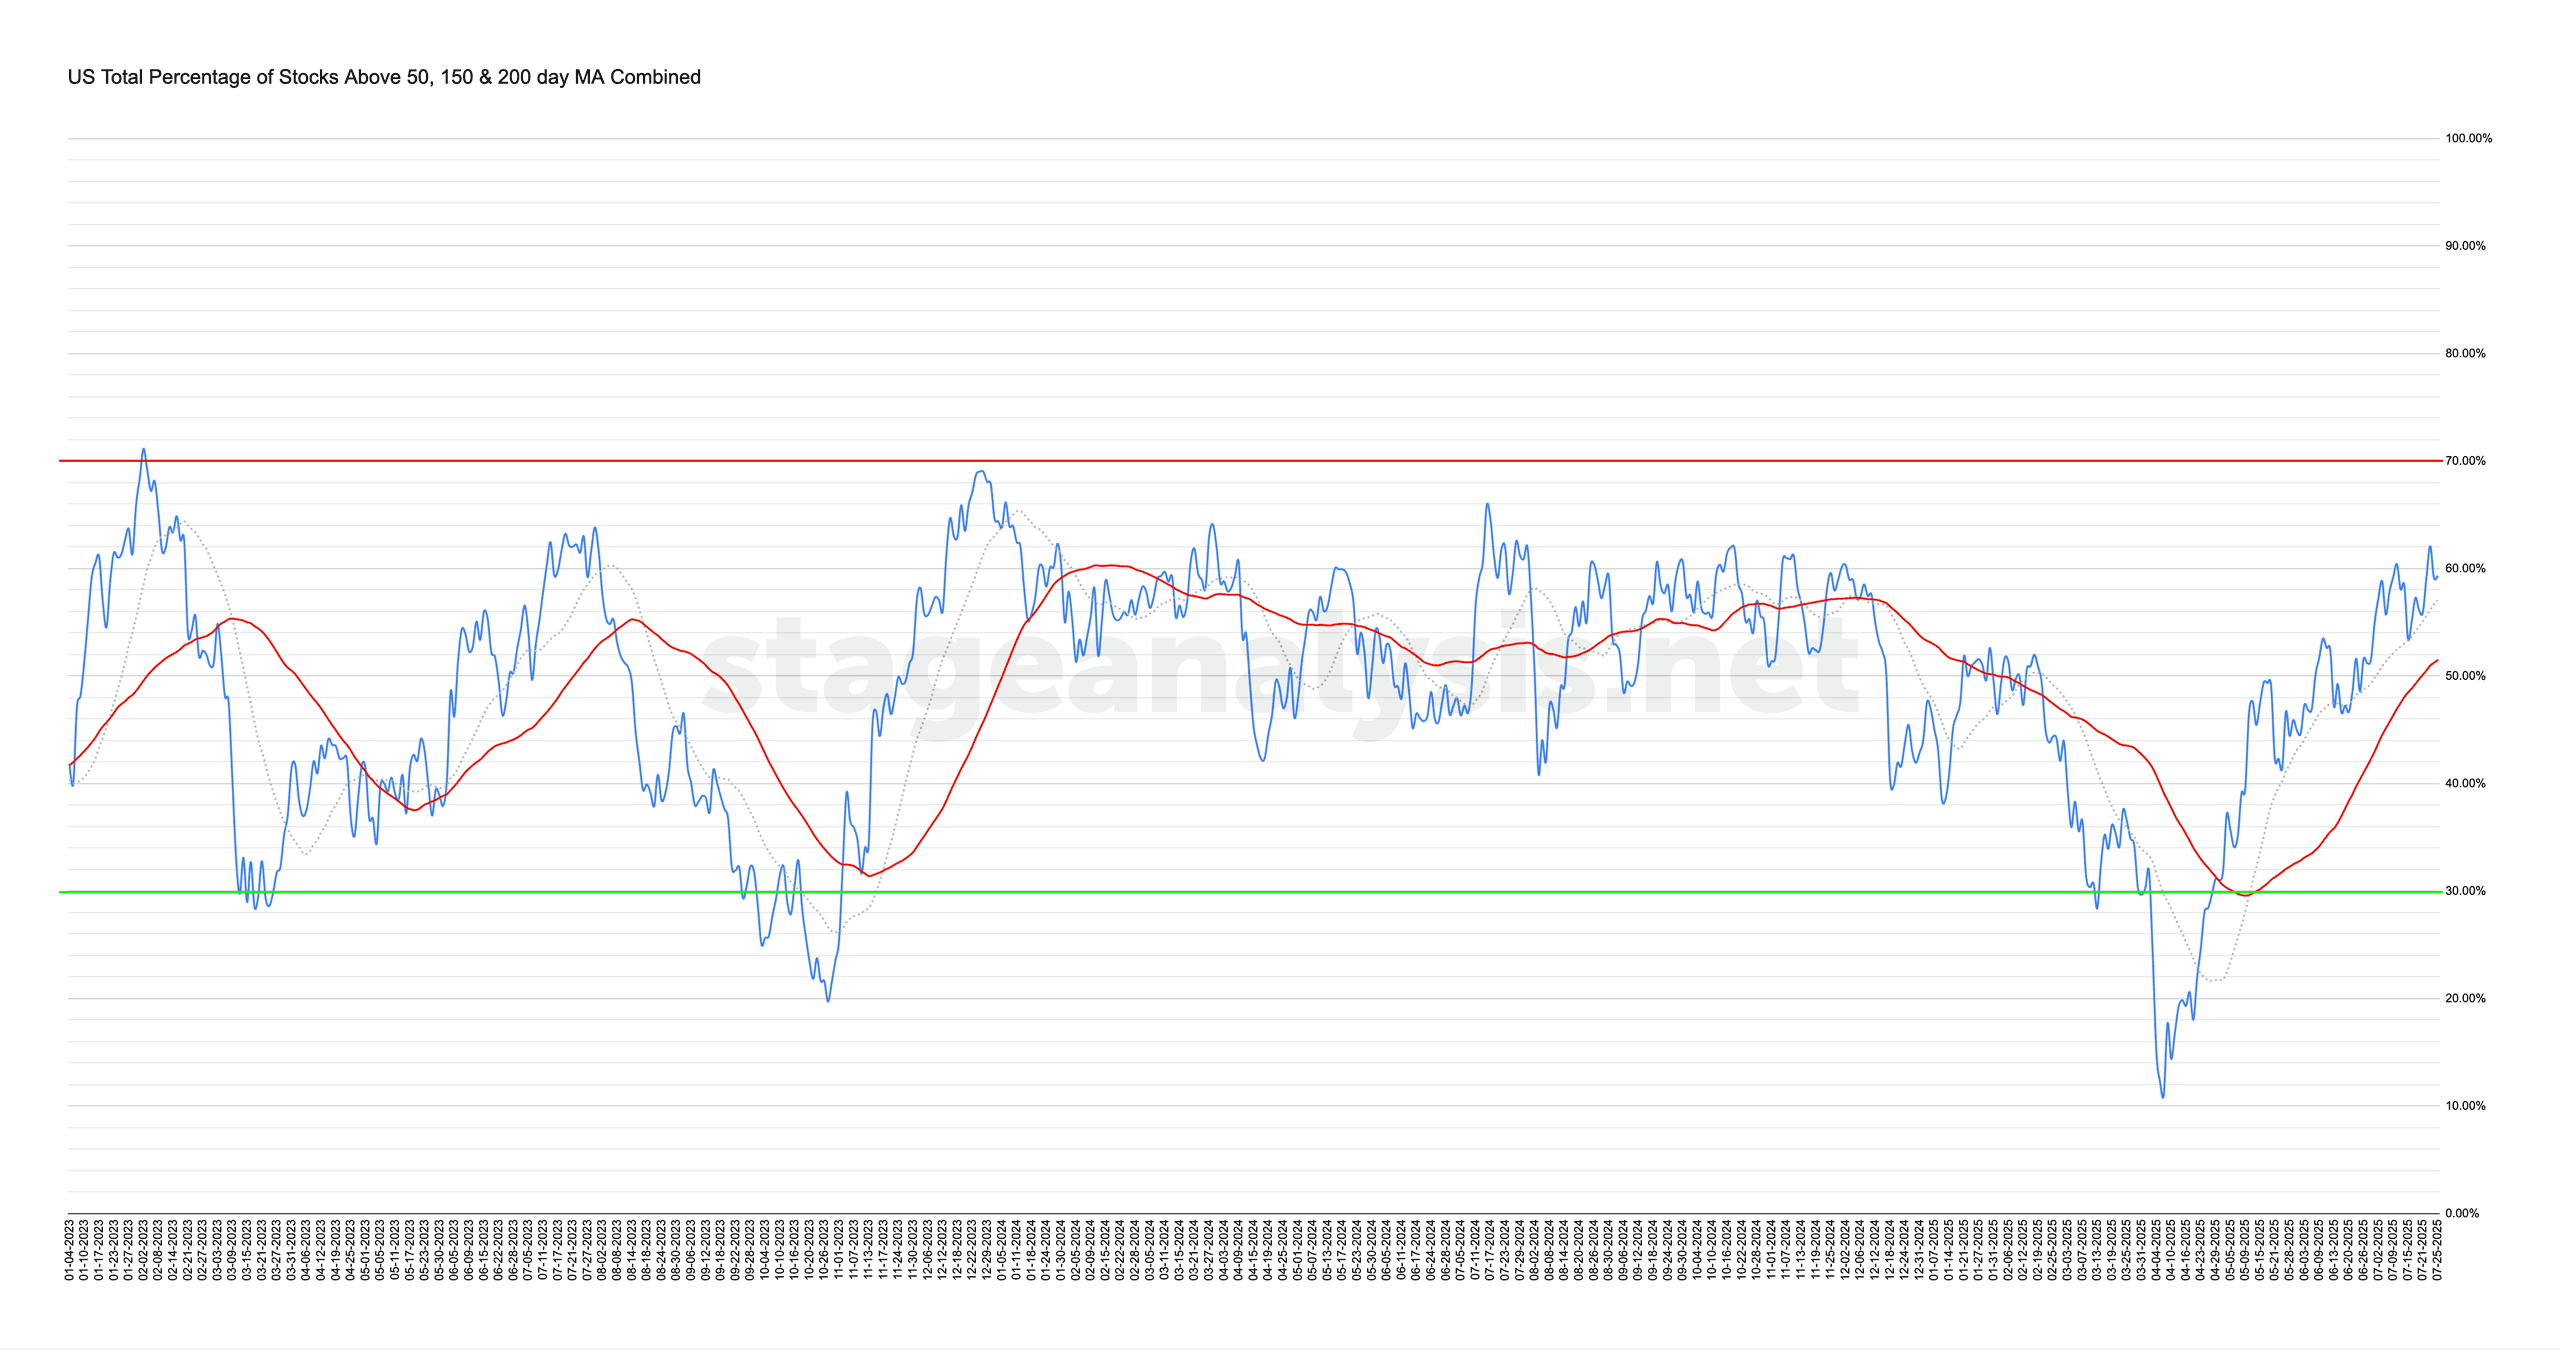
Market Breadth: Percentage of Stocks Above their 50 Day, 150 Day & 200 Day Moving Averages Combined
The US Total Percentage of Stocks above their 50 Day, 150 Day & 200 Day Moving Averages (shown above) decreased by -13.67% this week. Therefore, the overall combined average is at 45.68% in the US market (NYSE and Nasdaq markets combined) above their short, medium and long term moving averages.
Read More
29 July, 2025
US Stocks Watchlist – 29 July 2025
There were 15 stocks highlighted from the US stocks watchlist scans today...
Read More
27 July, 2025
Stage Analysis Members Video – 27 July 2025 (1hr 5mins)
The Stage Analysis members weekend video discussing the recent US Watchlist Stocks in detail on multiple timeframes, Stage 2 Breakout attempts, Stages Summary, Relative Strength Rankings, the Sector breadth and Sub-industries Bell Curves, the key Market Breadth Charts to determine the Weight of Evidence, Bitcoin & Ethereum, the Major US Stock Market Indexes and ETF Summary.
Read More
26 July, 2025
US Stocks Watchlist – 26 July 2025
There were 26 stocks highlighted from the US stocks watchlist scans today...
Read More
26 July, 2025
Market Breadth: Percentage of Stocks Above their 50 Day, 150 Day & 200 Day Moving Averages Combined
The US Total Percentage of Stocks above their 50 Day, 150 Day & 200 Day Moving Averages (shown above) increased by +3.22% this week. Therefore, the overall combined average is at 59.34% in the US market (NYSE and Nasdaq markets combined) above their short, medium and long term moving averages.
Read More
24 July, 2025
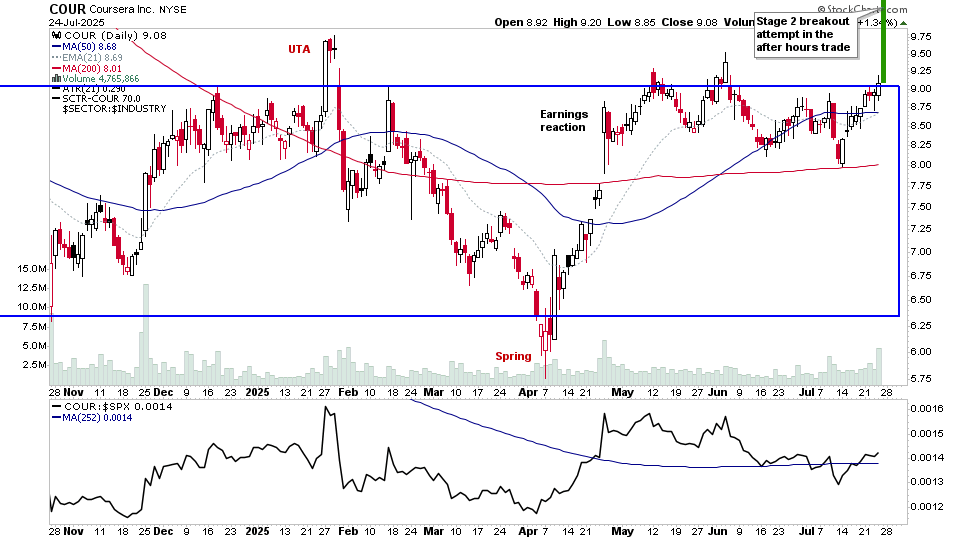
US Stocks Watchlist – 24 July 2025
There were 12 stocks highlighted from the US stocks watchlist scans today...
Read More
22 July, 2025
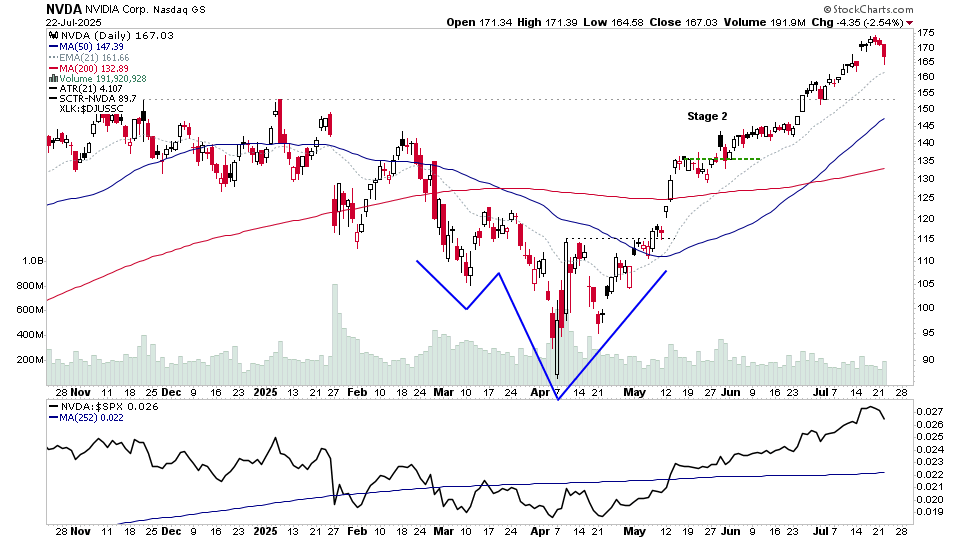
US Stocks Watchlist – 22 July 2025
There were 21 stocks highlighted from the US stocks watchlist scans today...
Read More