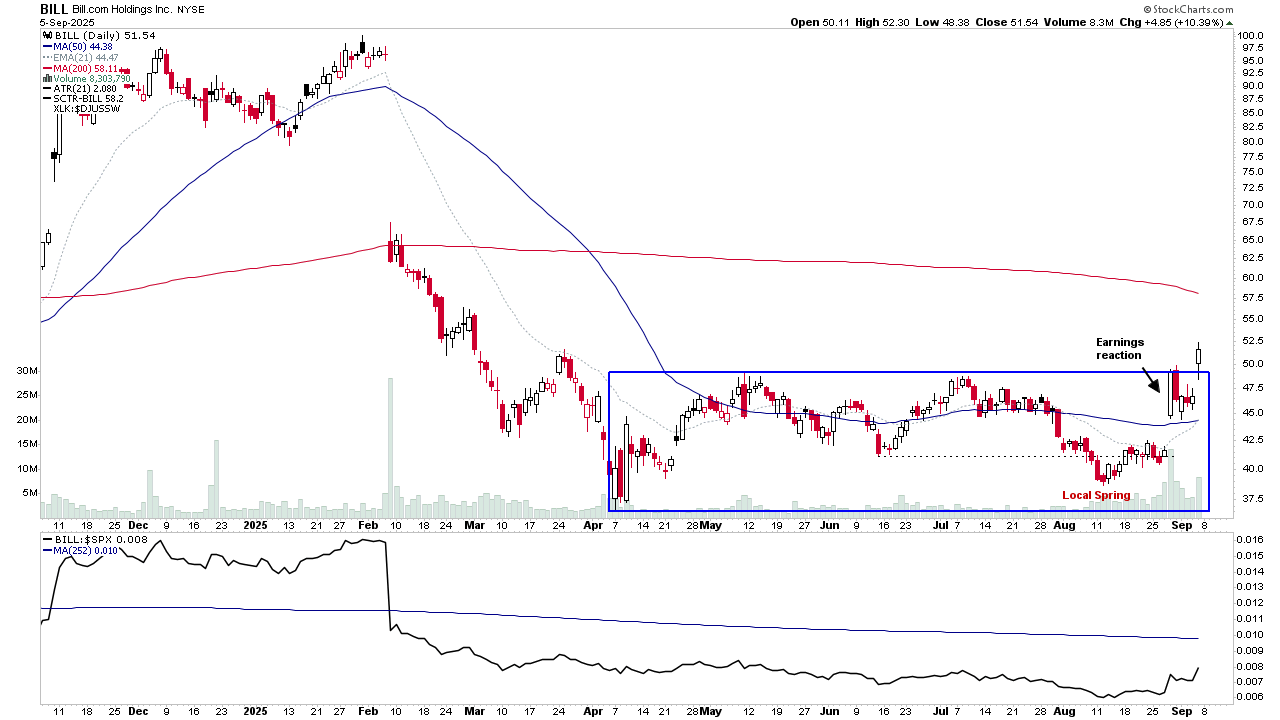
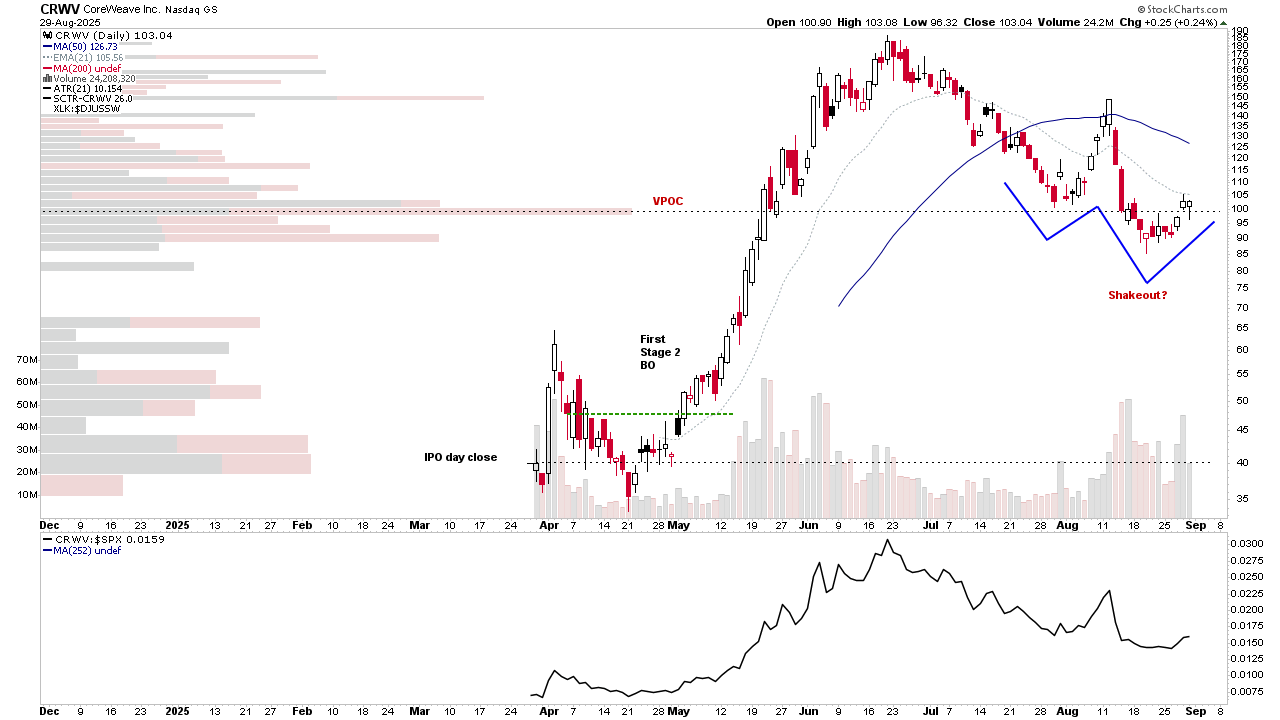
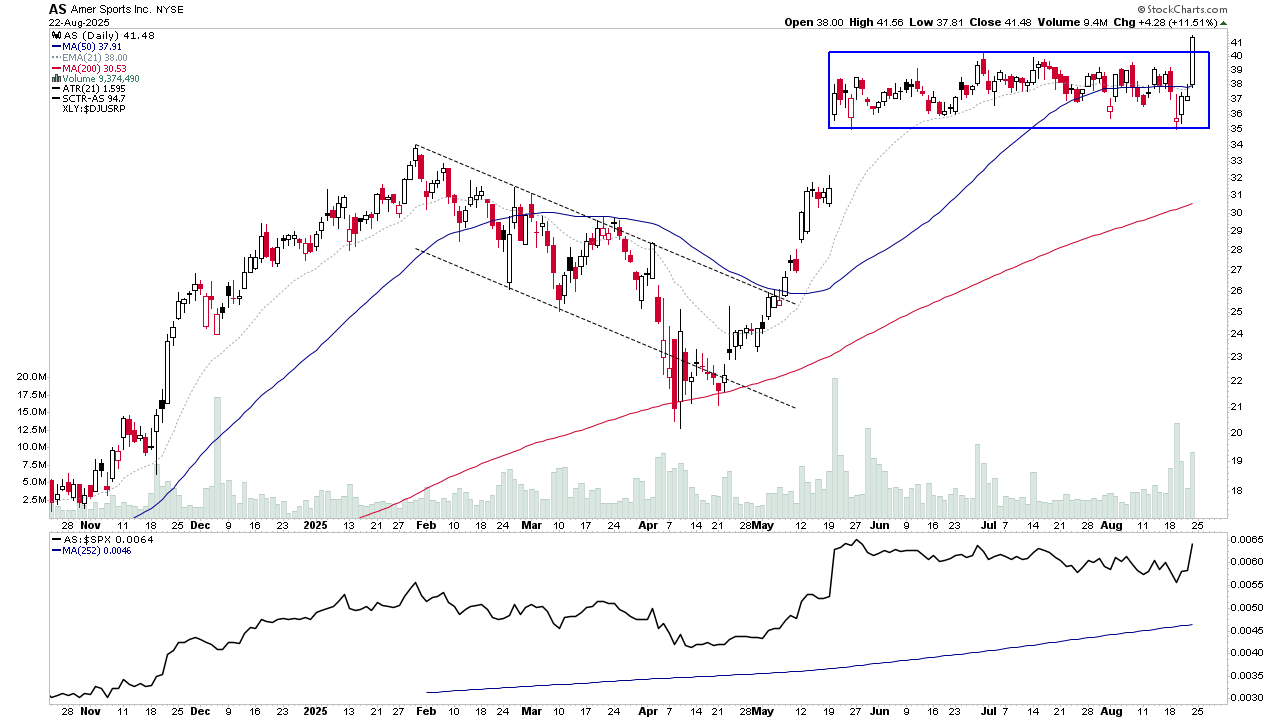
The Stage Analysis members video beginning by discussing the latest US Watchlist Stocks in detail on multiple timeframes, a look at new features in the Stage Analysis Screener, Stage 2 Breakout attempts, Stages Summary, the Sector breadth and Sub-industries Bell Curves, Relative Strength Rankings, the key Market Breadth Charts to determine the Weight of Evidence, Bitcoin & Ethereum, the Major US Stock Market Indexes and ETF Summary.
Read More

Blog
07 September, 2025
Stage Analysis Members Video – 7 September 2025 (1hr 13mins)
31 August, 2025
Stage Analysis Members Video – 31 August 2025 (1hr 3mins)
The Stage Analysis members video featuring the latest US Watchlist Stocks in detail on multiple timeframes, Stage 2 Breakout attempts, Stages Summary, the Sector breadth and Sub-industries Bell Curves, Relative Strength Rankings, the key Market Breadth Charts to determine the Weight of Evidence, Bitcoin & Ethereum, the Major US Stock Market Indexes and ETF Summary.
Read More
24 August, 2025
Stage Analysis Members Video – 24 August 2025 (1hr 3mins)
The Stage Analysis members video discussing the weekends US Watchlist Stocks in detail on multiple timeframes, Stage 2 Breakout attempts, Stages Summary, the Sector breadth and Sub-industries Bell Curves, Relative Strength Rankings, the key Market Breadth Charts to determine the Weight of Evidence, Bitcoin & Ethereum, the Major US Stock Market Indexes and ETF Summary. Plus finishing with a discussion of further improvements to the Chartlist features and ideas for upcoming features.
Read More
17 August, 2025
Stage Analysis Members Video – 17 Aug 2025 (1hr 16mins)
The Stage Analysis members video starts with a discussion of multiple new features added last week, then the regular content of the recent US Watchlist Stocks in detail on multiple timeframes, Stage 2 Breakout attempts, Stages Summary, the Sector breadth and Sub-industries Bell Curves, Relative Strength Rankings, the key Market Breadth Charts to determine the Weight of Evidence, Bitcoin & Ethereum, the Major US Stock Market Indexes and ETF Summary.
Read More
03 August, 2025
Stage Analysis Members Video – 3 Aug 2025 (50mins)
The Stage Analysis members video highlighting the new mini charts added to the Relative Strength Rankings, the recent US Watchlist Stocks in detail on multiple timeframes, Stage 2 Breakout attempts, Stages Summary, the Sector breadth and Sub-industries Bell Curves, the key Market Breadth Charts to determine the Weight of Evidence, Bitcoin & Ethereum, the Major US Stock Market Indexes and ETF Summary.
Read More
27 July, 2025
Stage Analysis Members Video – 27 July 2025 (1hr 5mins)
The Stage Analysis members weekend video discussing the recent US Watchlist Stocks in detail on multiple timeframes, Stage 2 Breakout attempts, Stages Summary, Relative Strength Rankings, the Sector breadth and Sub-industries Bell Curves, the key Market Breadth Charts to determine the Weight of Evidence, Bitcoin & Ethereum, the Major US Stock Market Indexes and ETF Summary.
Read More
13 July, 2025
Stage Analysis Members Video – 13 July 2025 (1hr 9mins)
The Stage Analysis members weekend video discussing the US Watchlist Stocks in detail on multiple timeframes, Stage 2 Breakout attempts, Stages Summary, Relative Strength Rankings, the Sector breadth and Sub-industries Bell Curves, the key Market Breadth Charts to determine the Weight of Evidence, Bitcoin & Ethereum, the Major US Stock Market Indexes and ETF Summary.
Read More
06 July, 2025
Stage Analysis Members Video – 6 July 2025 (1hr 19mins)
The Stage Analysis members weekend video begins with a discussion of the US Watchlist Stocks in detail on multiple timeframes, Stage 2 Breakout attempts, Stages Summary, Relative Strength Rankings, the Sector breadth and Sub-industries Bell Curves, the key Market Breadth Charts to determine the Weight of Evidence, Bitcoin & Ethereum and the Major US Stock Market Indexes.
Read More
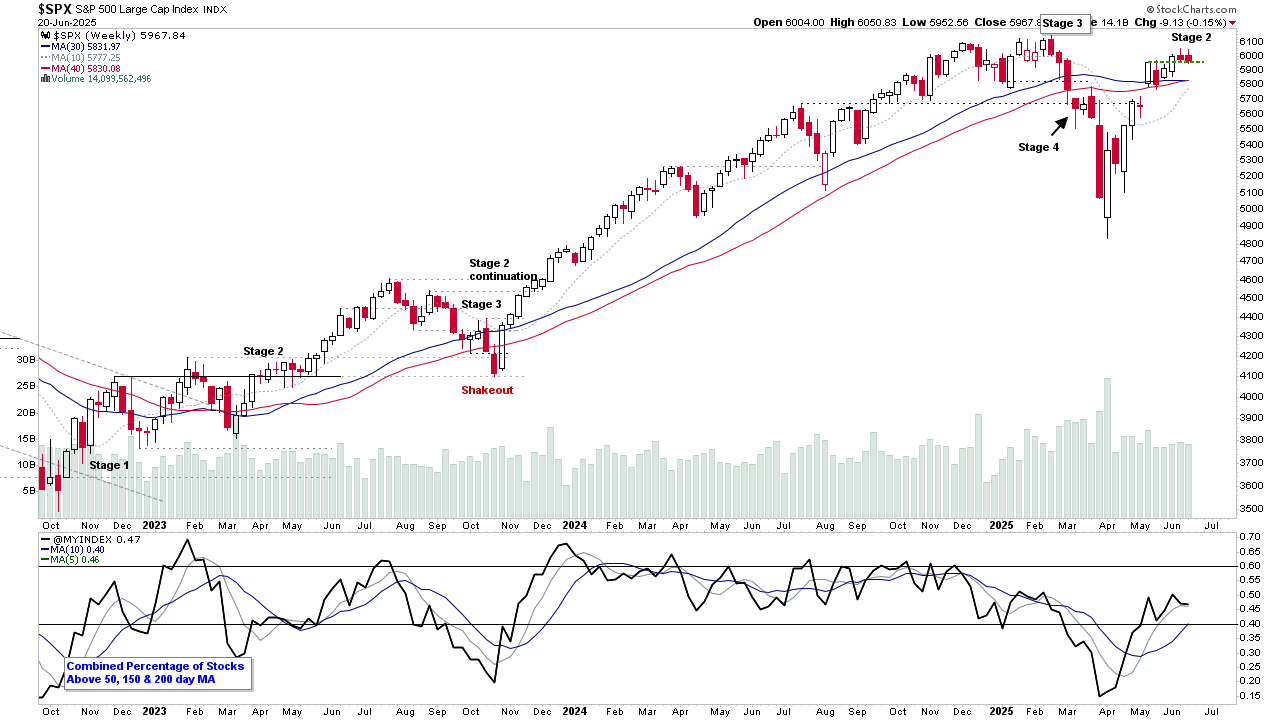
22 June, 2025
Stage Analysis Members Video – 22 June 2025 (1h 11mins)
The Stage Analysis members weekend video starts with a discussion of the Major US Stock Market Indexes, followed by more NEW Filters added to the Stage Analysis Screener, then the US Watchlist Stocks in detail on multiple timeframes, Stage 2 Breakout attempts, Stages Summary, Relative Strength Rankings, the Sector breadth and Sub-industries Bell Curves, the key Market Breadth Charts to determine the Weight of Evidence, Bitcoin & Ethereum.
Read More

15 June, 2025
Stage Analysis Members Video – 15 June 2025 (57mins)
The Stage Analysis members weekend video begins with a discussion of the US Watchlist Stocks in detail on multiple timeframes, NEW Filters added, Stage 2 Breakout attempts, Stages Summary, Relative Strength Rankings, the Sector breadth and Sub-industries Bell Curves, the key Market Breadth Charts to determine the Weight of Evidence, Bitcoin & Ethereum and the Major US Stock Market Indexes Update.
Read More