Stage Analysis members weekend video discussing the Major US Stock Market Indexes, Futures charts, Industry Groups Relative Strength (RS) Rankings, IBD Industry Group Bell Curve – Bullish Percent, the key Market Breadth Charts to determine the Weight of Evidence, Group Focus on the Gold and Silver Miners, Significant Weekly Bars, and the US watchlist stocks in detail on multiple timeframes.
Read More

Blog
17 December, 2023
Stage Analysis Members Video – 17 December 2023 (1hr 24mins)
16 December, 2023
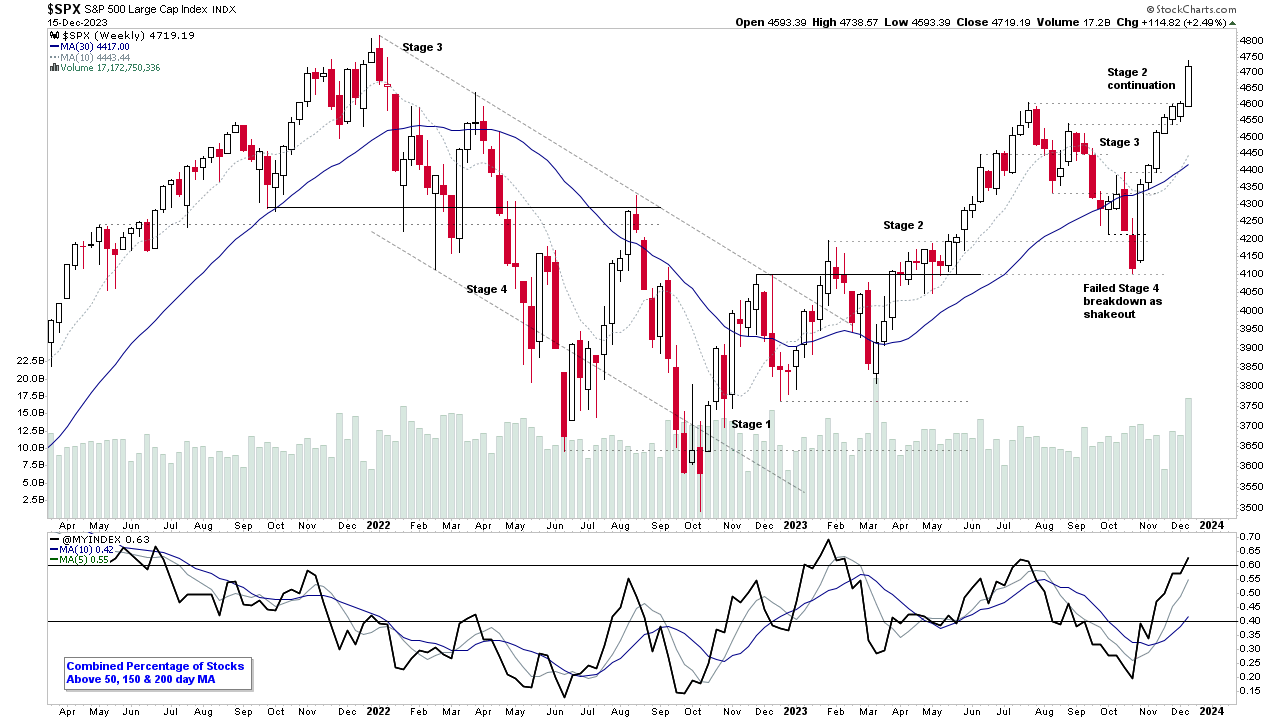
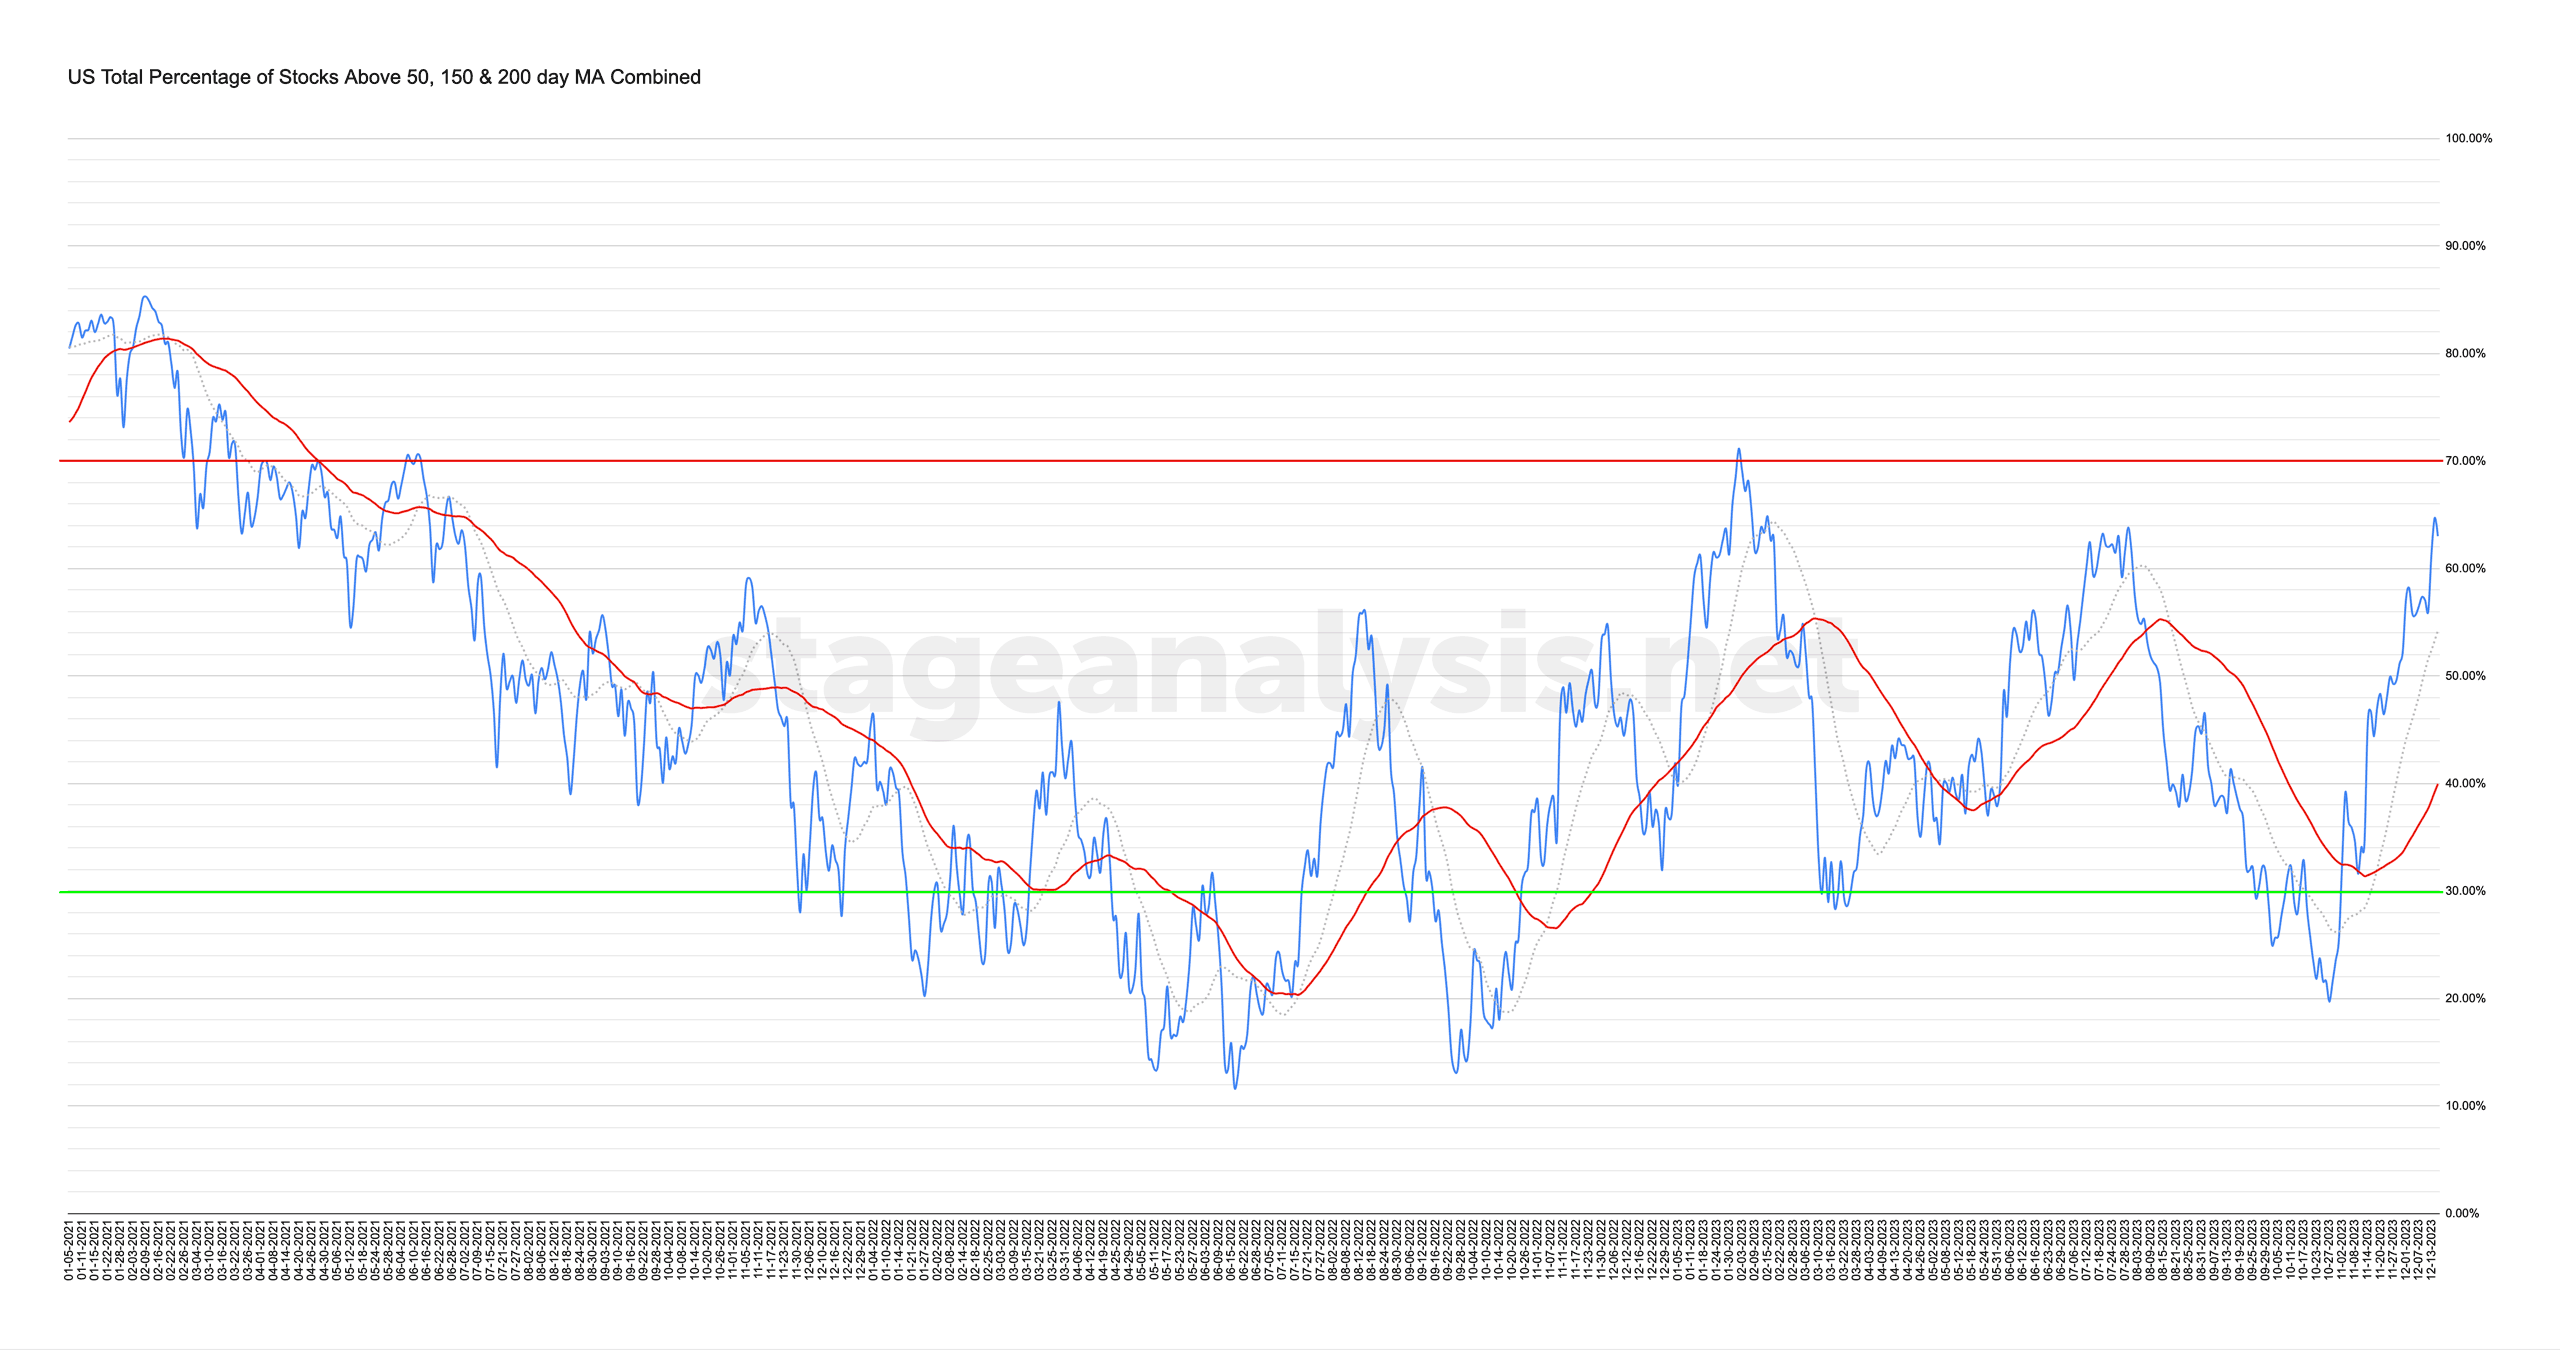
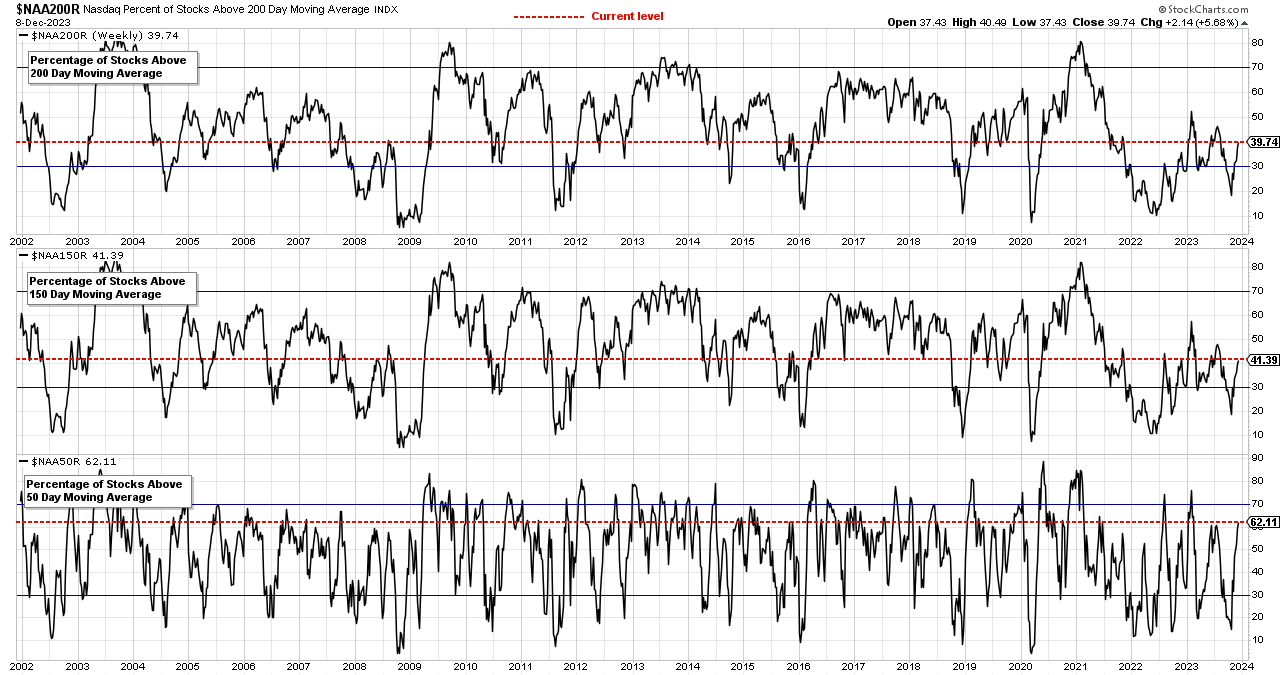
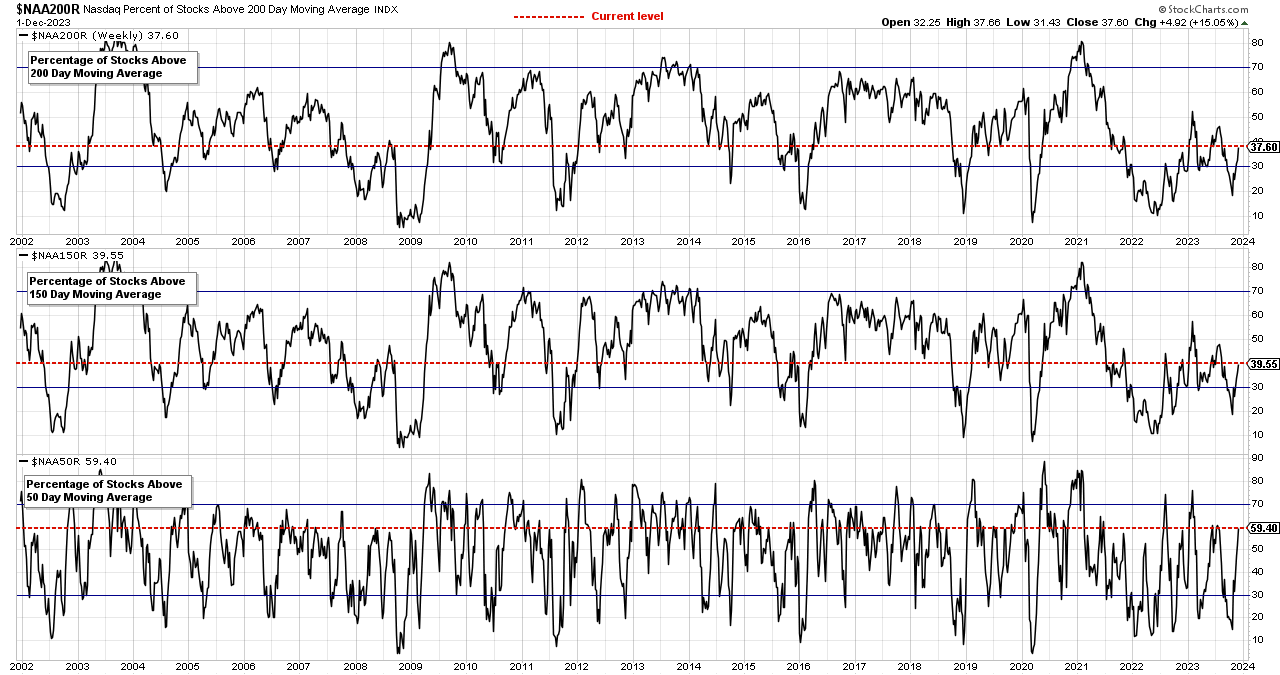
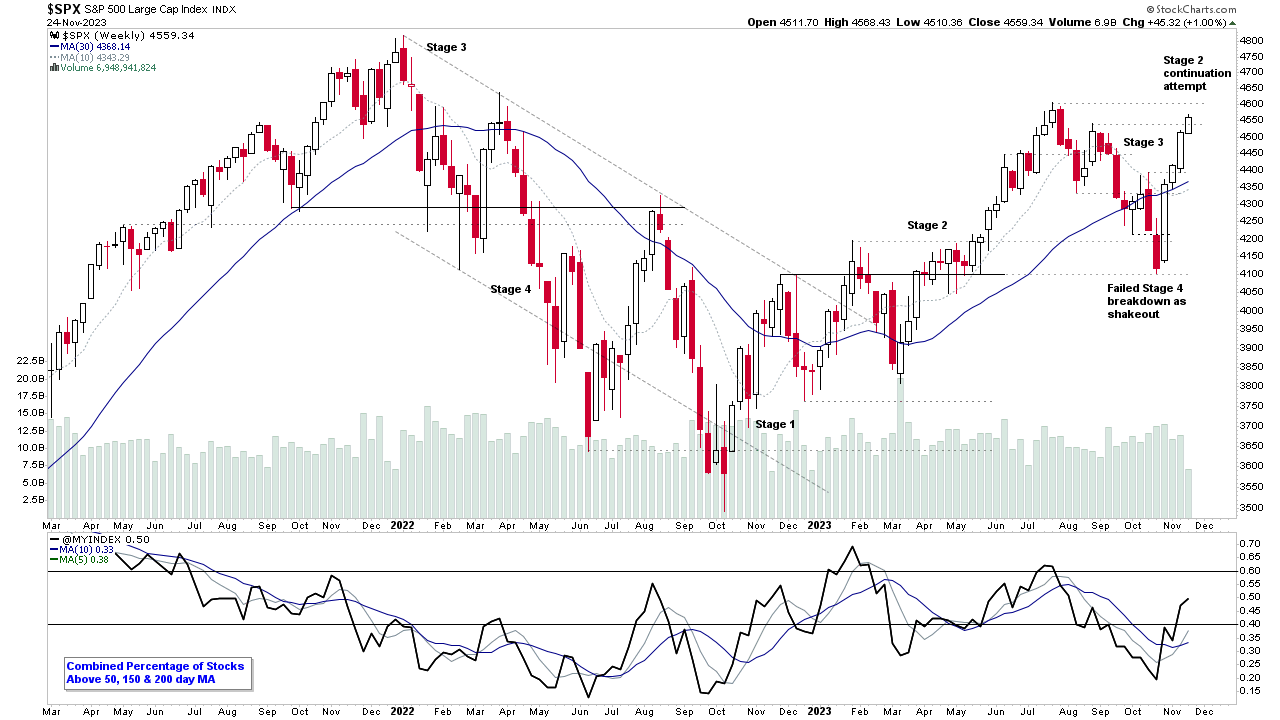
Market Breadth: Percentage of Stocks Above their 50 Day, 150 Day & 200 Day Moving Averages Combined
Custom Percentage of Stocks Above Their 50 Day, 150 Day & 200 Day Moving Averages Combined Market Breadth Charts for the Overall US Market, NYSE and Nasdaq for Market Timing and Strategy.
Read More
13 December, 2023
Stage Analysis Members Video – 13 December 2023 (42mins)
Stage Analysis midweek video discussing of the major US stock market indexes following todays Fed rate decision, short-term market breadth measures, and the recent watchlist stocks on multiple timeframes.
Read More
10 December, 2023
Stage Analysis Members Video – 10 December 2023 (1hr 8mins)
Stage Analysis members weekend video starting this with a look at some of the significant weekly bars of stocks in Stage 2, followed by the regular members content on the Major US Stock Market Indexes, Industry Groups Relative Strength (RS) Rankings, IBD Industry Group Bell Curve – Bullish Percent, the key Market Breadth Charts to determine the Weight of Evidence, Bitcoin & Ethereum Update, and the US watchlist stocks in detail on multiple timeframes.
Read More
09 December, 2023
Market Breadth: Percentage of Stocks Above their 50 Day, 150 Day & 200 Day Moving Averages Combined
Custom Percentage of Stocks Above Their 50 Day, 150 Day & 200 Day Moving Averages Combined Market Breadth Charts for the Overall US Market, NYSE and Nasdaq for Market Timing and Strategy.
Read More
07 December, 2023
US Stocks Watchlist – 7 December 2023
There were 26 stocks highlighted from the US stocks watchlist scans today...
Read More
04 December, 2023
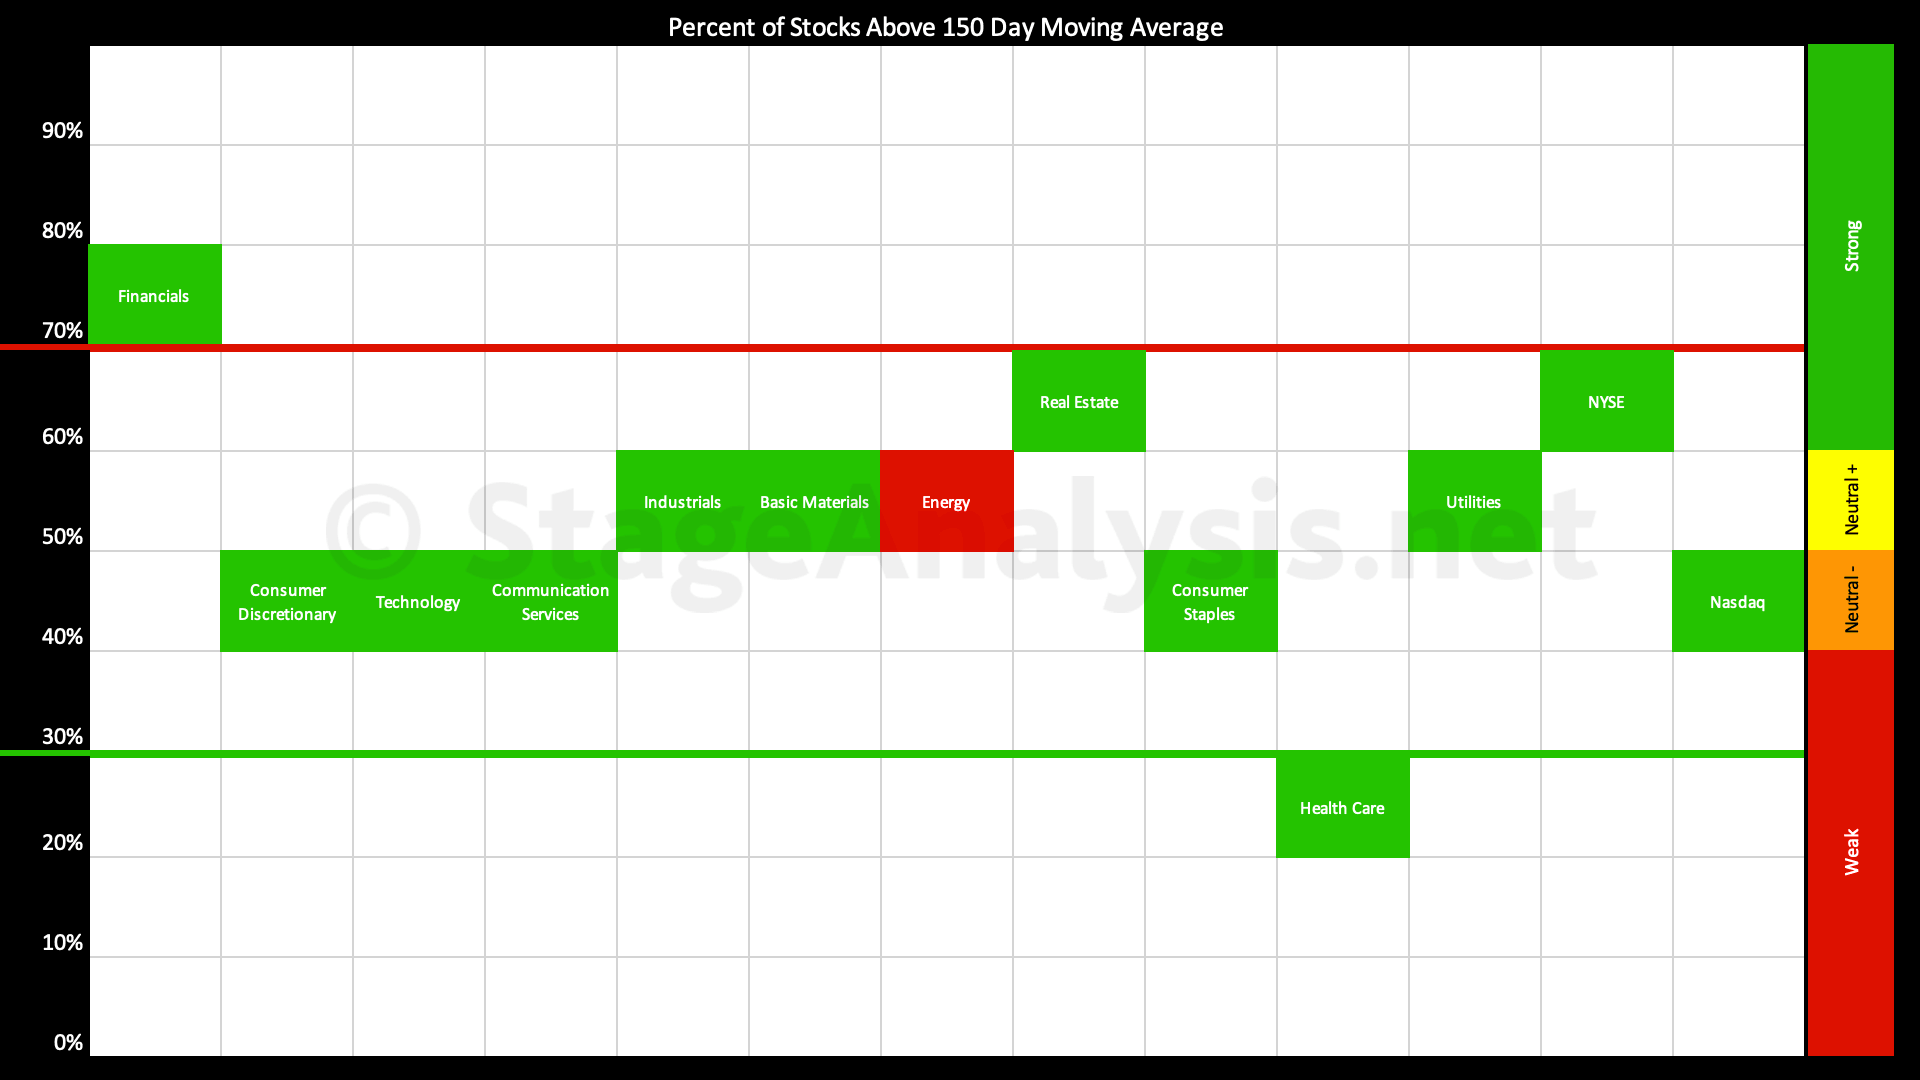
Sector Breadth: Percentage of US Stocks Above Their 150 day (30 Week) Moving Averages
The percentage of US stocks above their 150 day moving averages in the 11 major sectors increased by +9.41% since the previous post on the 20th November 2023, moving the overall average into the middle of the chart at 51.65%, which is a very neutral position.
Read More
03 December, 2023
Stage Analysis Members Video – 3 December 2023 (1hr 18mins)
Stage Analysis members weekend video beginning with a discussion of some of strongest moving stocks in Stage 2, followed by the regular members content on the Major US Stock Market Indexes, Industry Groups Relative Strength (RS) Rankings, IBD Industry Group Bell Curve – Bullish Percent, the key Market Breadth Charts to determine the Weight of Evidence, Bitcoin & Ethereum Update, and the US watchlist stocks in detail on multiple timeframes.
Read More
02 December, 2023
Market Breadth: Percentage of Stocks Above their 50 Day, 150 Day & 200 Day Moving Averages Combined
Custom Percentage of Stocks Above Their 50 Day, 150 Day & 200 Day Moving Averages Combined Market Breadth Charts for the Overall US Market, NYSE and Nasdaq for Market Timing and Strategy.
Read More
26 November, 2023
Stage Analysis Members Video – 26 November 2023 (1hr 19mins)
Stage Analysis members weekend video discussing the Major US Stock Market Indexes, Industry Groups Relative Strength (RS) Rankings, IBD Industry Group Bell Curve – Bullish Percent, the key Market Breadth Charts to determine the Weight of Evidence, Significant Weekly Bars and the US watchlist stocks in detail on multiple timeframes.
Read More