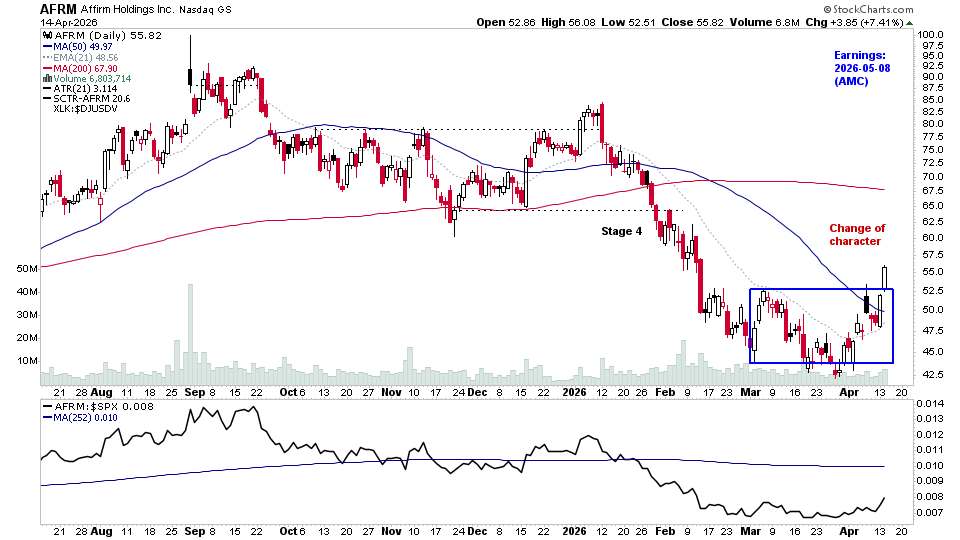
There were 21 stocks highlighted from the US stocks watchlist scans today...
Read More

Blog
15 April, 2026
US Stocks Watchlist – 15 April 2026

12 April, 2026
Stage Analysis Members Video – 12 April 2026 (1hr 2mins)
The Stage Analysis members video begins with a look at the current US Watchlist Stocks on multiple timeframes, Stage 2 Breakout & Stage 4 Breakdown attempts, Stages Summary, the Sector breadth and Sub-industries Bell Curves, Relative Strength Rankings, the key Market Breadth Charts to determine the Weight of Evidence, Bitcoin & Ethereum, the Major US Stock Market Indexes, ETF Summary and brief look at the NEW UK Stage Analysis website, which is due to launch in the next few weeks.
Read More
12 April, 2026
US Stocks Watchlist – 13 April 2026
There are 18 stocks highlighted from the weekends US stocks watchlist scans...
Read More
11 April, 2026
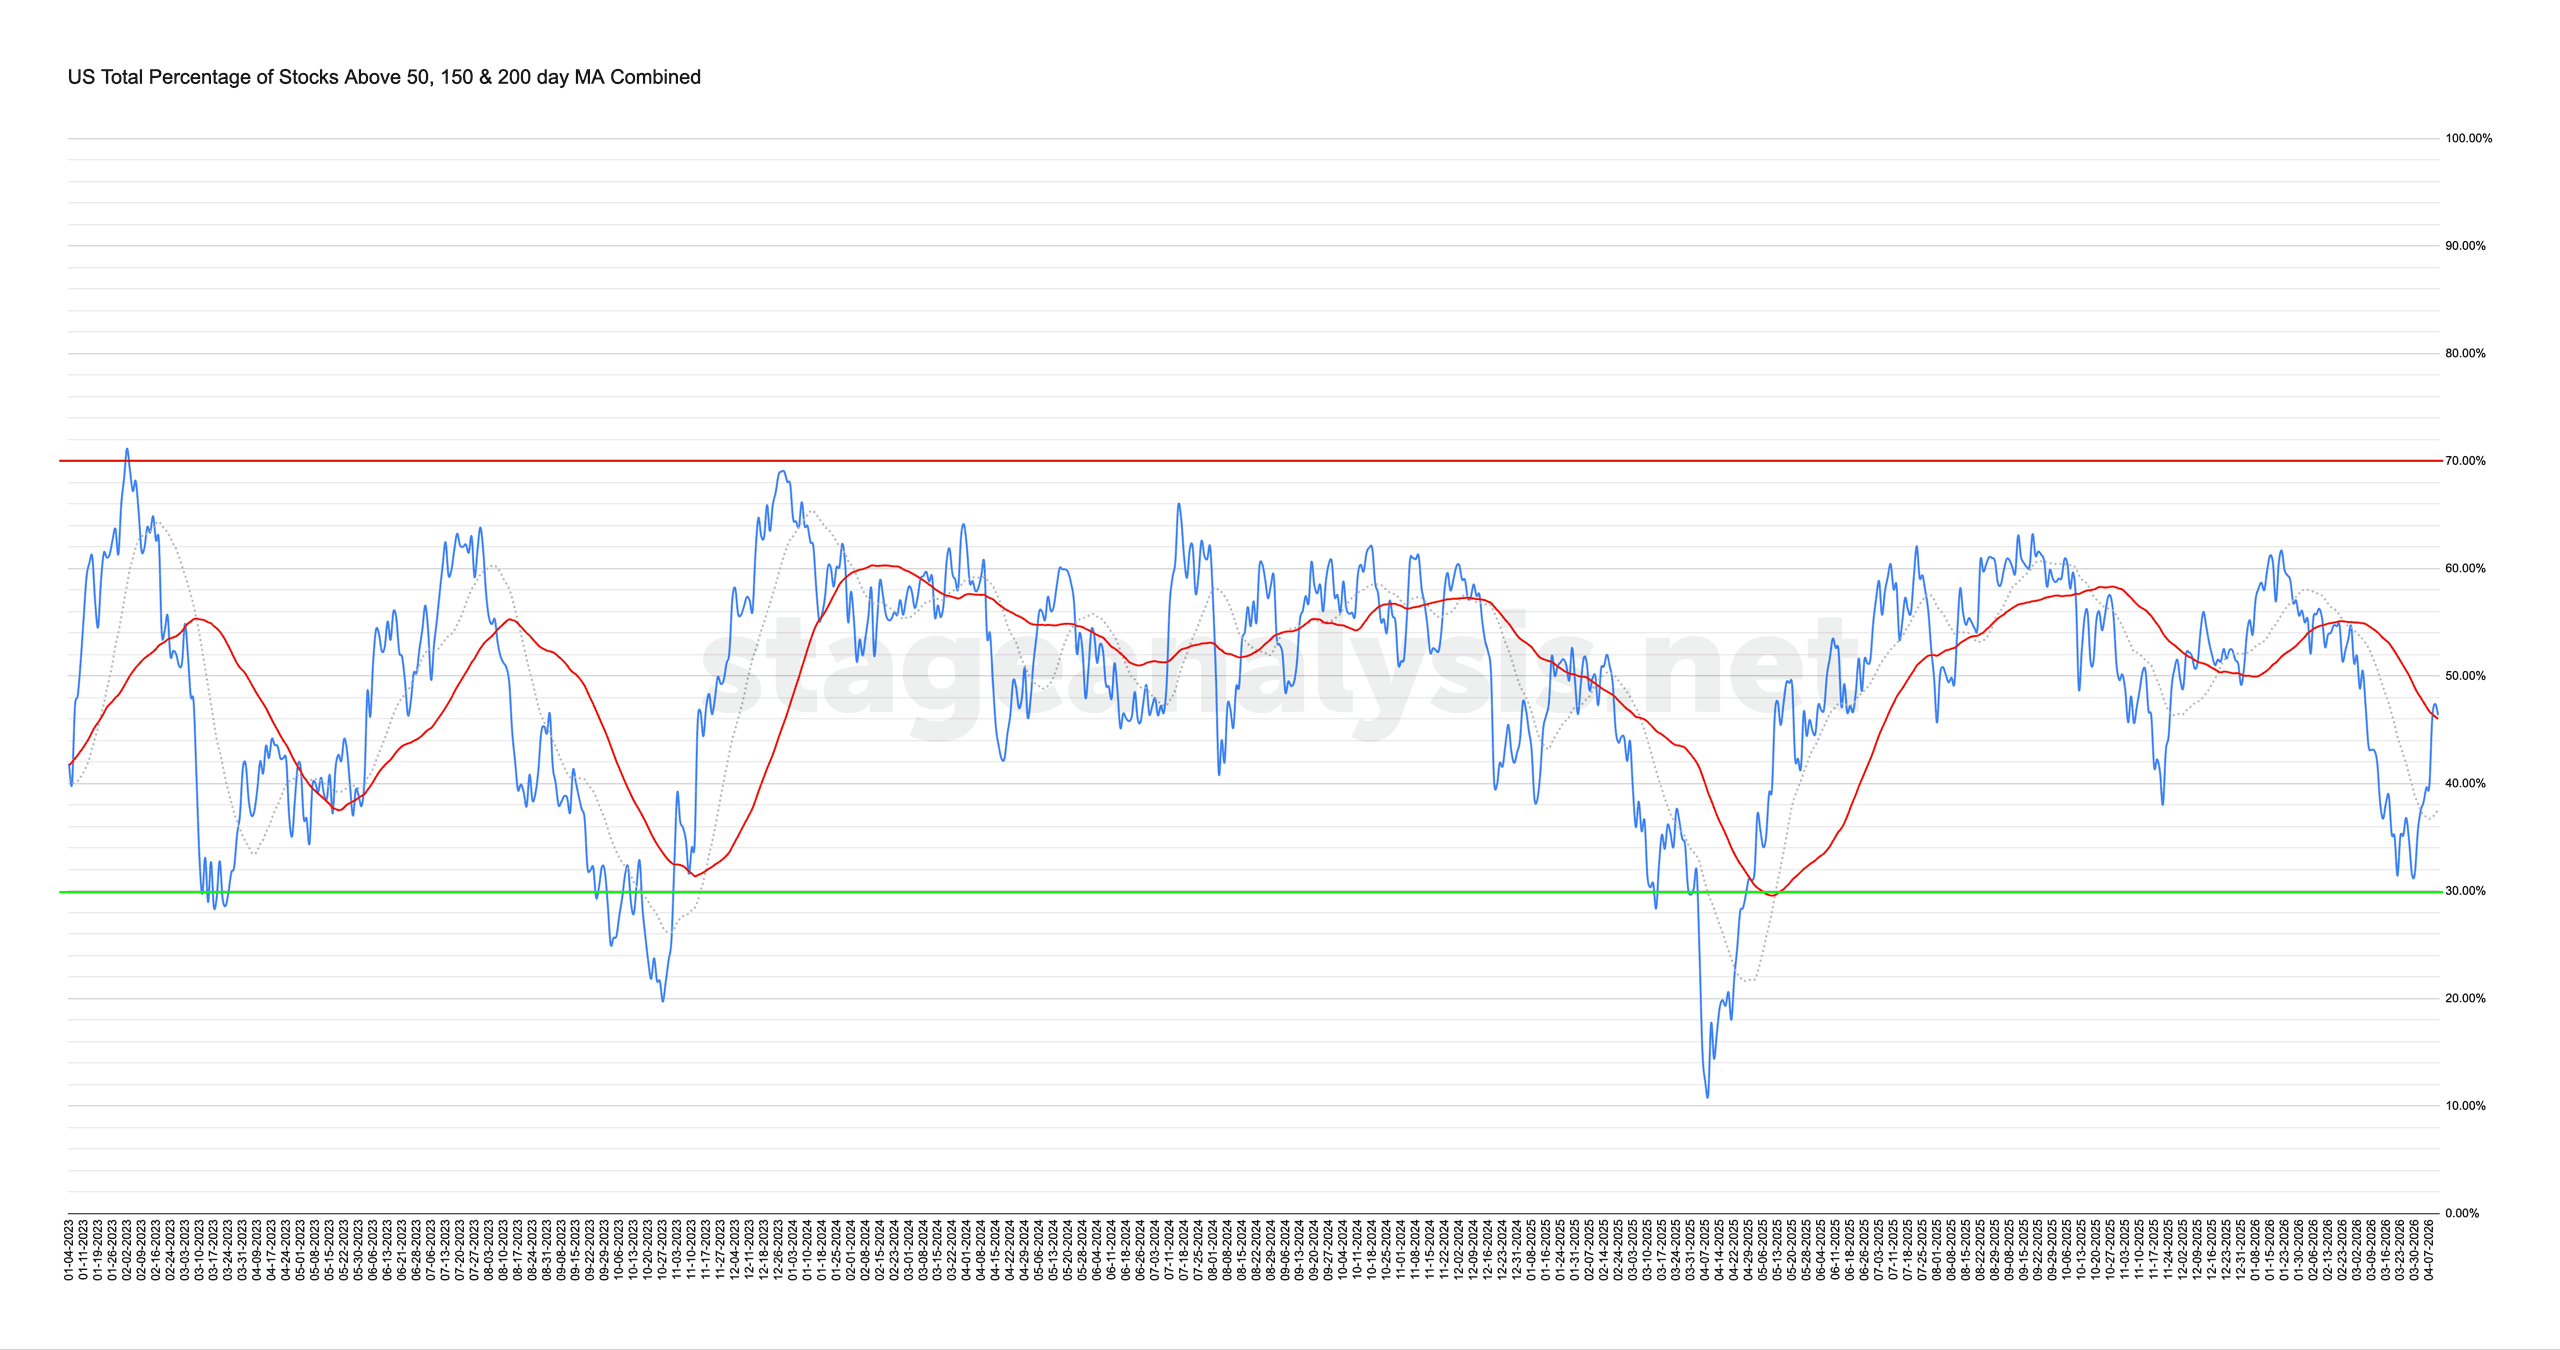
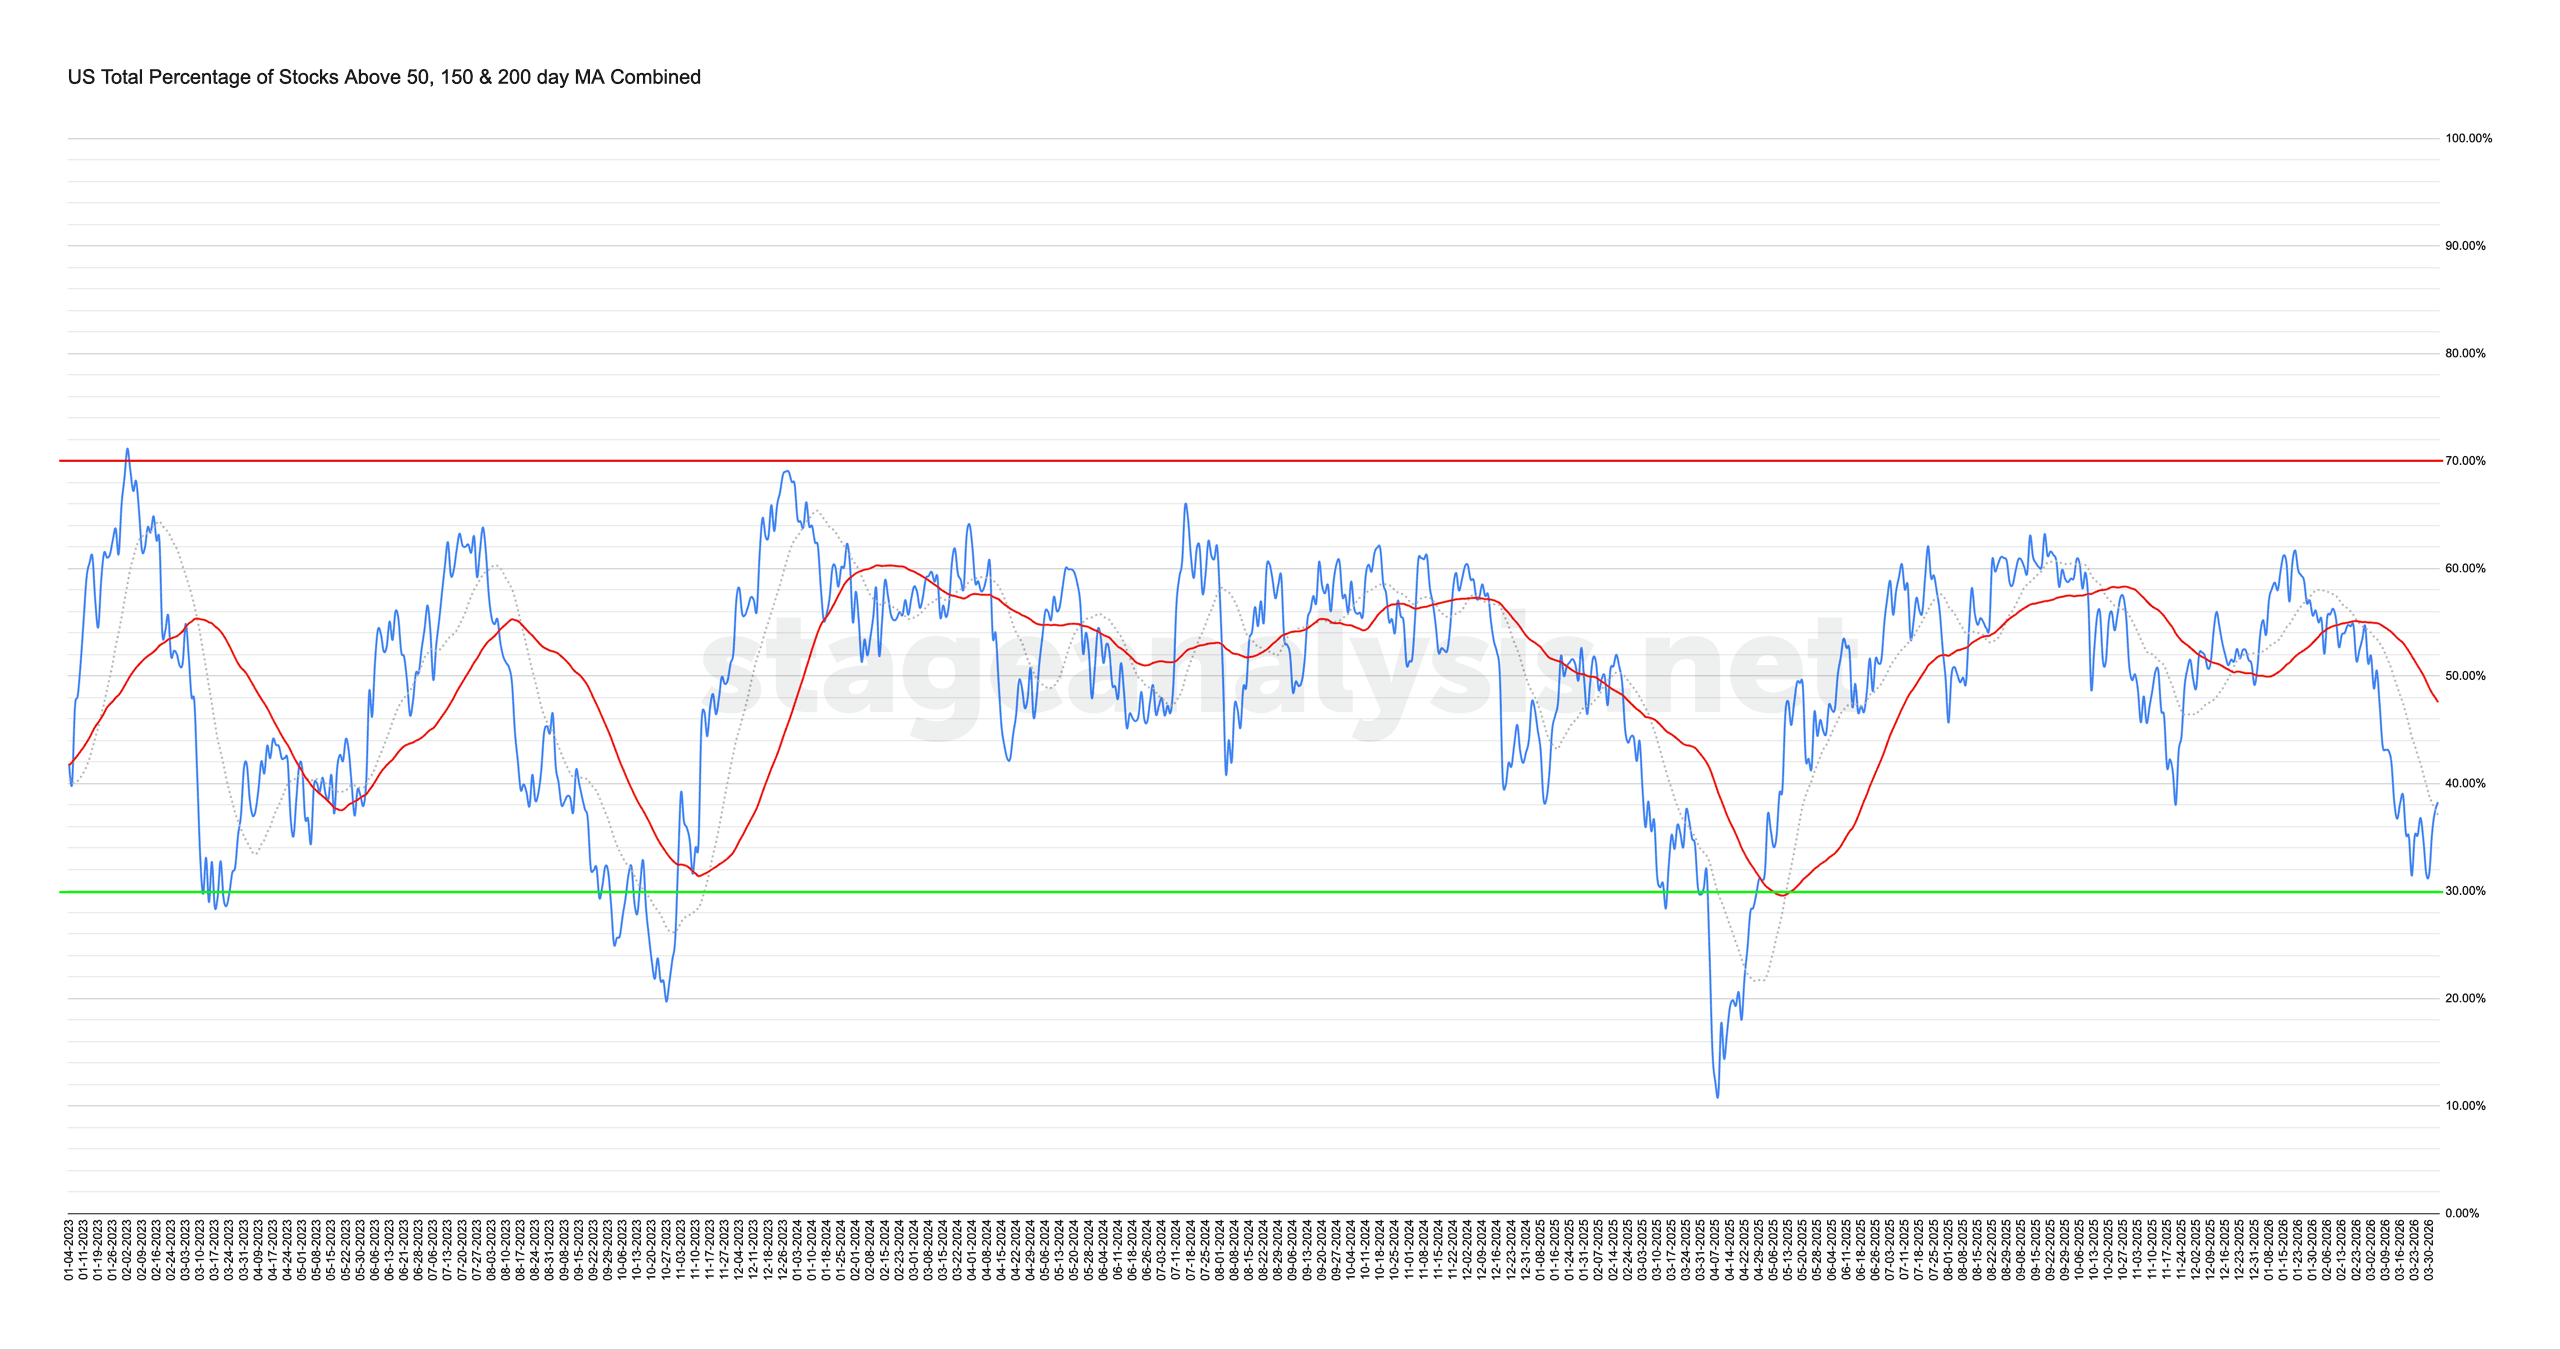
Market Breadth: Percentage of Stocks Above their 50 Day, 150 Day & 200 Day Moving Averages Combined
The US Total Percentage of Stocks above their 50 Day, 150 Day & 200 Day Moving Averages (shown above) increased by +8.10% this week. Therefore, the overall combined average is at 46.37% in the US market (NYSE and Nasdaq markets combined) above their short, medium and long term moving averages.
Read More
10 April, 2026
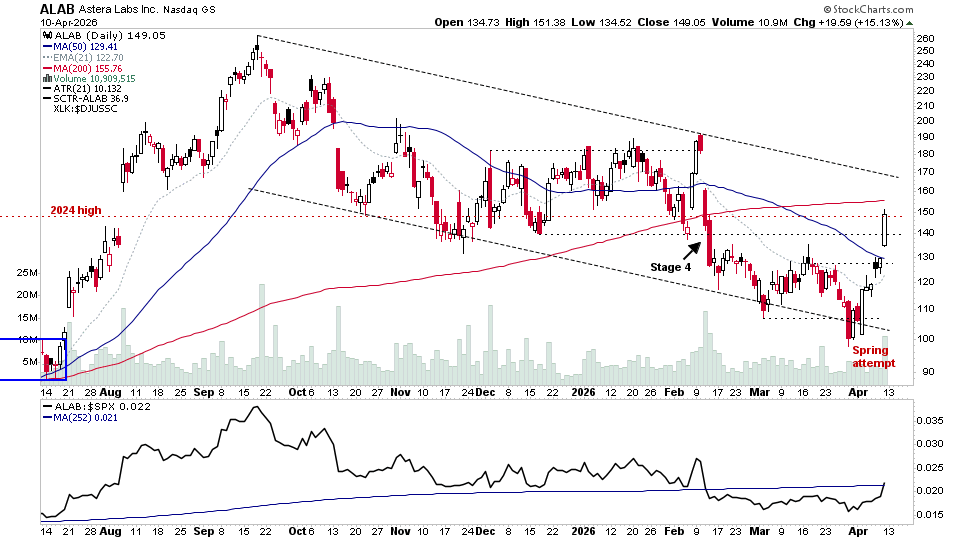
US Stocks Watchlist – 10 April 2026
There were 20 stocks highlighted from the US stocks watchlist scans today...
Read More

05 April, 2026
Stage Analysis Members Video – 5 April 2026 (54mins)
The Stage Analysis members video begins with a discussion of US Watchlist Stocks on multiple timeframes, Stage 2 Breakout & Stage 4 Breakdown attempts, Stages Summary, the Sector breadth and Sub-industries Bell Curves, Relative Strength Rankings, the key Market Breadth Charts to determine the Weight of Evidence, Bitcoin & Ethereum, the Major US Stock Market Indexes and ETF Summary.
Read More
05 April, 2026
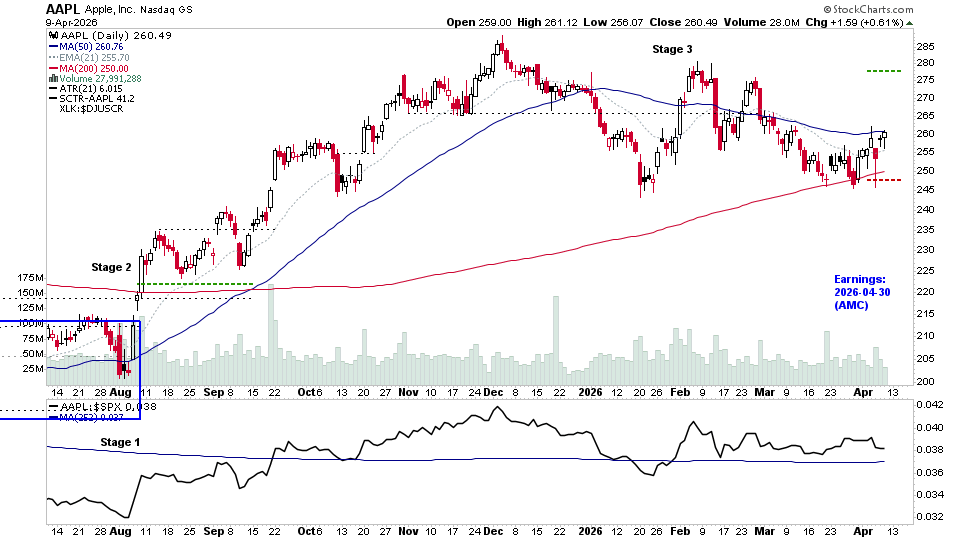
US Stocks Watchlist – 6 April 2026
There are 20 stocks highlighted from the weekends US stocks watchlist scans...
Read More
04 April, 2026
Market Breadth: Percentage of Stocks Above their 50 Day, 150 Day & 200 Day Moving Averages Combined
The US Total Percentage of Stocks above their 50 Day, 150 Day & 200 Day Moving Averages (shown above) increased by +6.70% this week. Therefore, the overall combined average is at 38.27% in the US market (NYSE and Nasdaq markets combined) above their short, medium and long term moving averages.
Read More
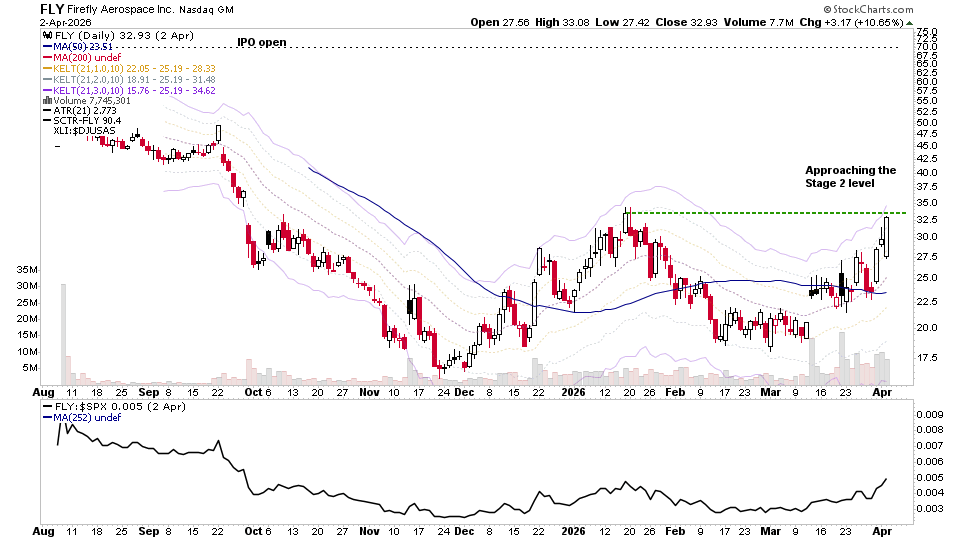
01 April, 2026
US Stocks Watchlist – 1 April 2026
There were 21 stocks highlighted from the US stocks watchlist scans today...
Read More
29 March, 2026
Stage Analysis Members Video – 29 March 2026 (52mins)
The Stage Analysis members video begins this week with a discussion of the Major US Stock Market Indexes on multiple timeframes, Stage 2 Breakout & Stage 4 Breakdown attempts, Stages Summary, the Sector breadth and Sub-industries Bell Curves, Relative Strength Rankings, the key Market Breadth Charts to determine the Weight of Evidence, Bitcoin & Ethereum and ETF Summary.
Read More