
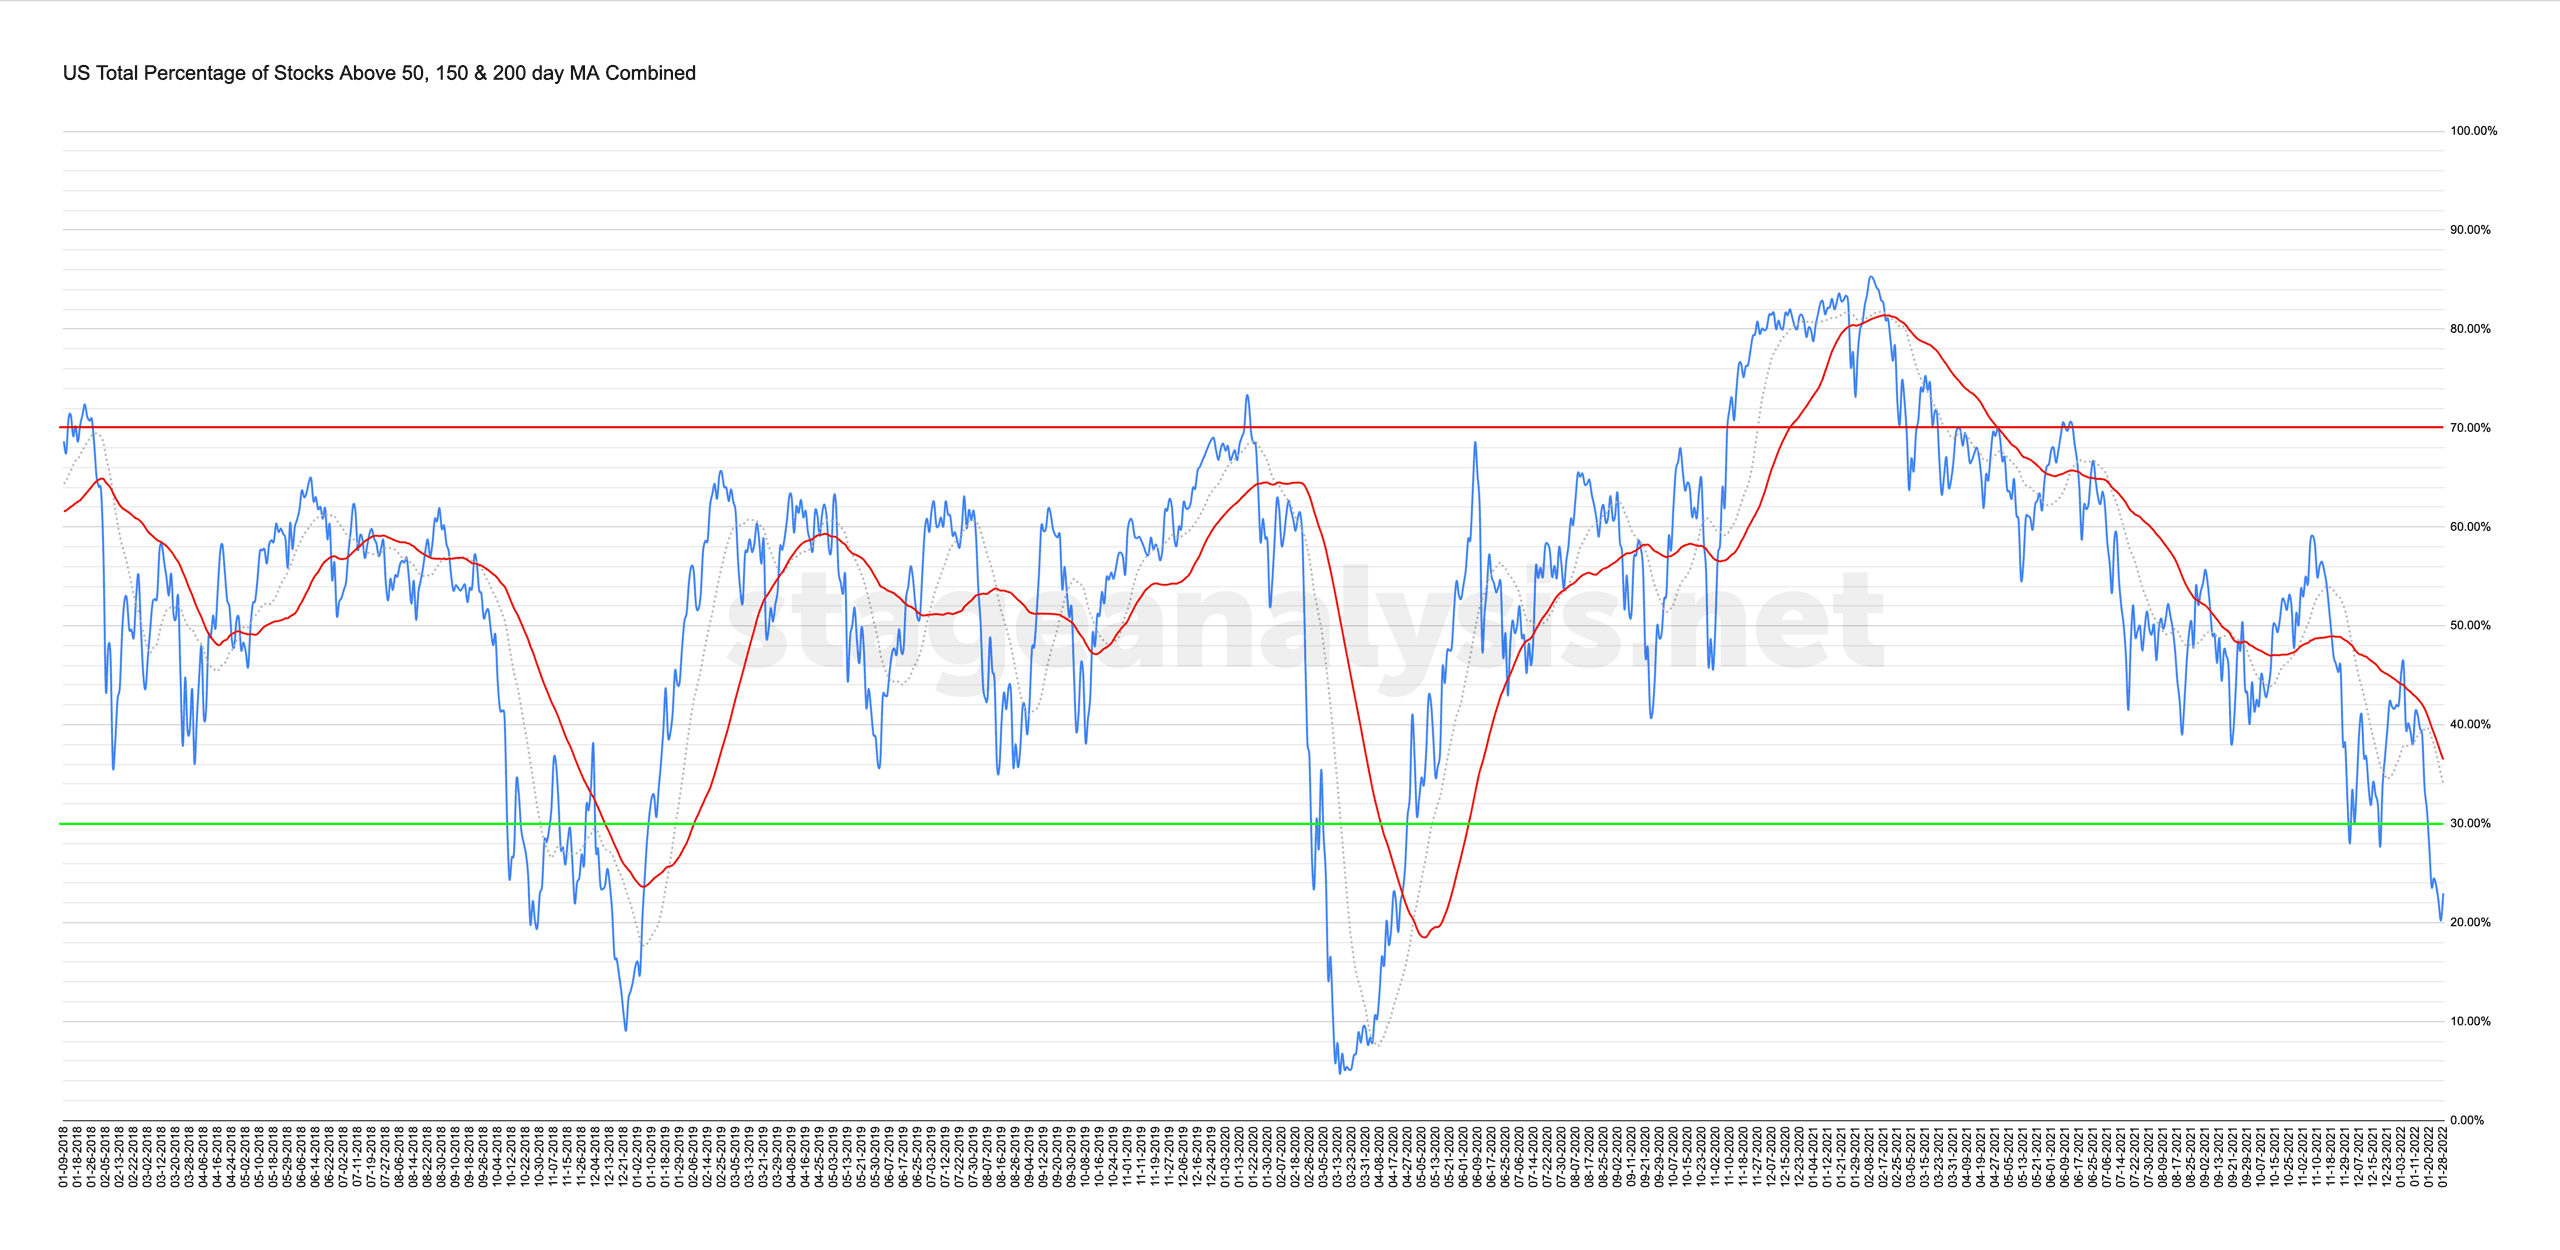
US Total % Stocks Above their 50 Day, 150 Day & 200 Day Moving Averages
22.97% (-0.68% 1wk)
Status: Very Difficult Environment (Lower Zone)
Become a Stage Analysis Member:
To see more like this – US Stocks watchlist posts, detailed videos each weekend, use our unique Stage Analysis tools, such as the US Stocks & ETFs Screener, Charts, Market Breadth, Group Relative Strength and more...
Join Today
Disclaimer: For educational purpose only. Not investment advice. Seek professional advice from a financial advisor before making any investing decisions.