
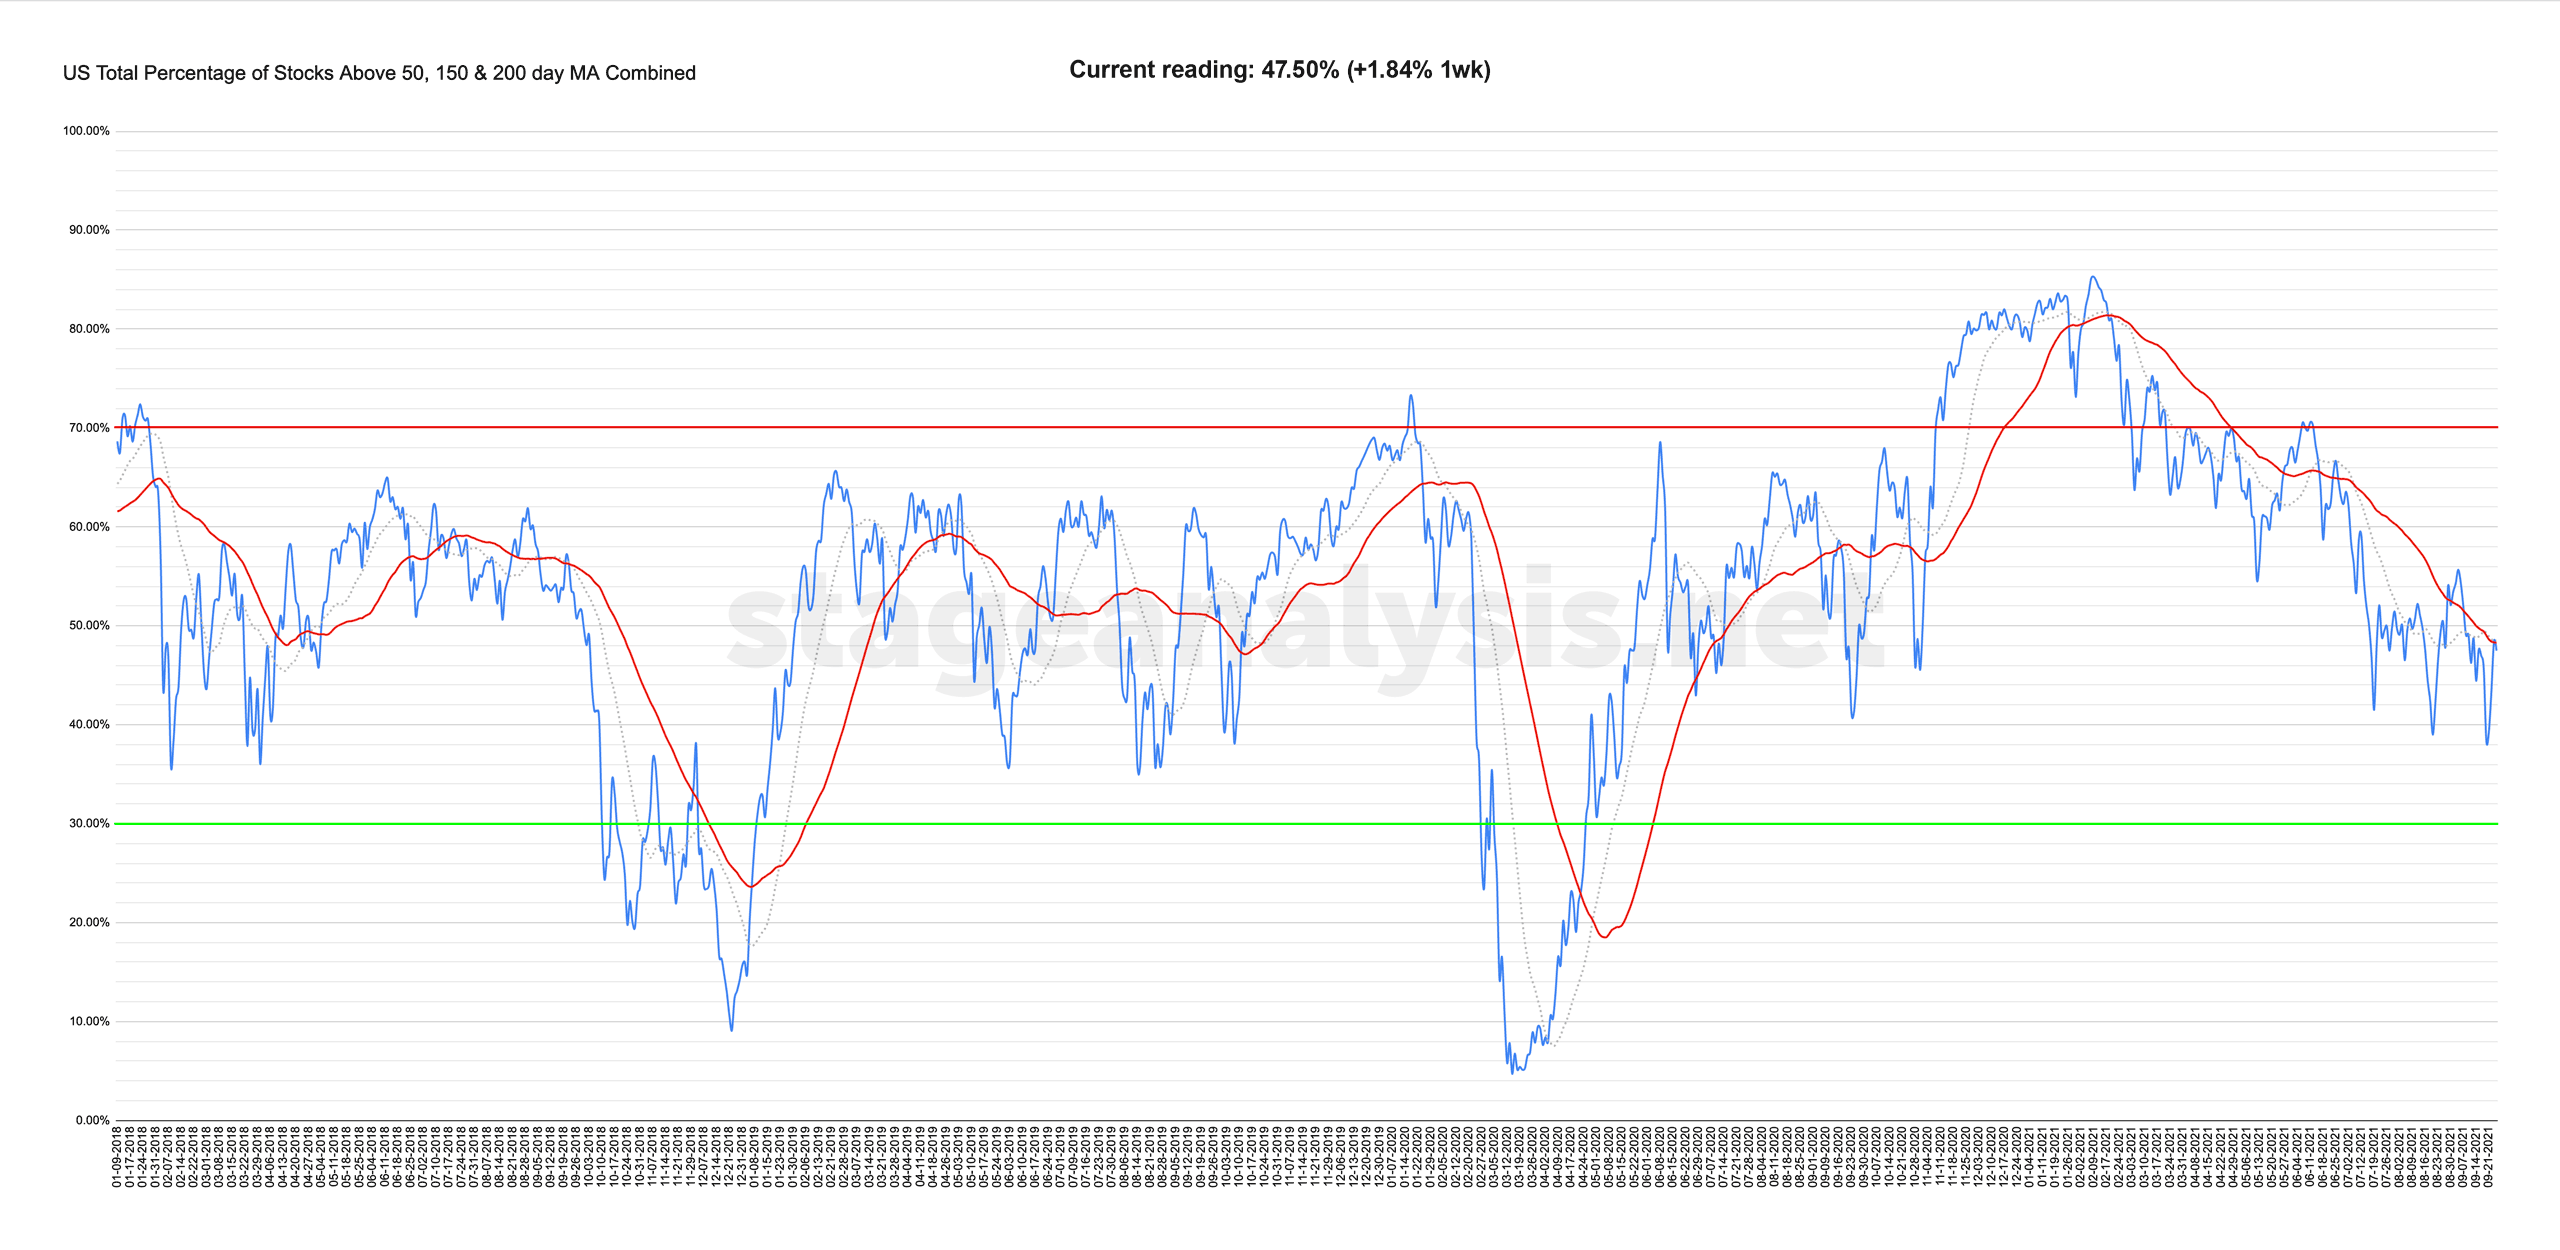
US Total Percentage of Stocks Above Their 50 Day, 150 Day & 200 Day Moving Averages Combined
47.50% (+1.84% 1wk)
Closed just under its own 50 day MA and so I'm giving it a neutral status. It needs a strong close above the 50 day MA to change it to a positive environment.
I believe in a Weight of Evidence approach. But if I could only look at one breadth chart then it would be the US Total % Stocks Above their 50, 150 & 200 Day Moving Averages Combined Chart which gives a snapshot of whether it's a postive or difficult environment and field position.
Become a Stage Analysis Member:
To see more like this – US Stocks watchlist posts, detailed videos each weekend, use our unique Stage Analysis tools, such as the US Stocks & ETFs Screener, Charts, Market Breadth, Group Relative Strength and more...
Join Today
Disclaimer: For educational purpose only. Not investment advice. Seek professional advice from a financial advisor before making any investing decisions.