
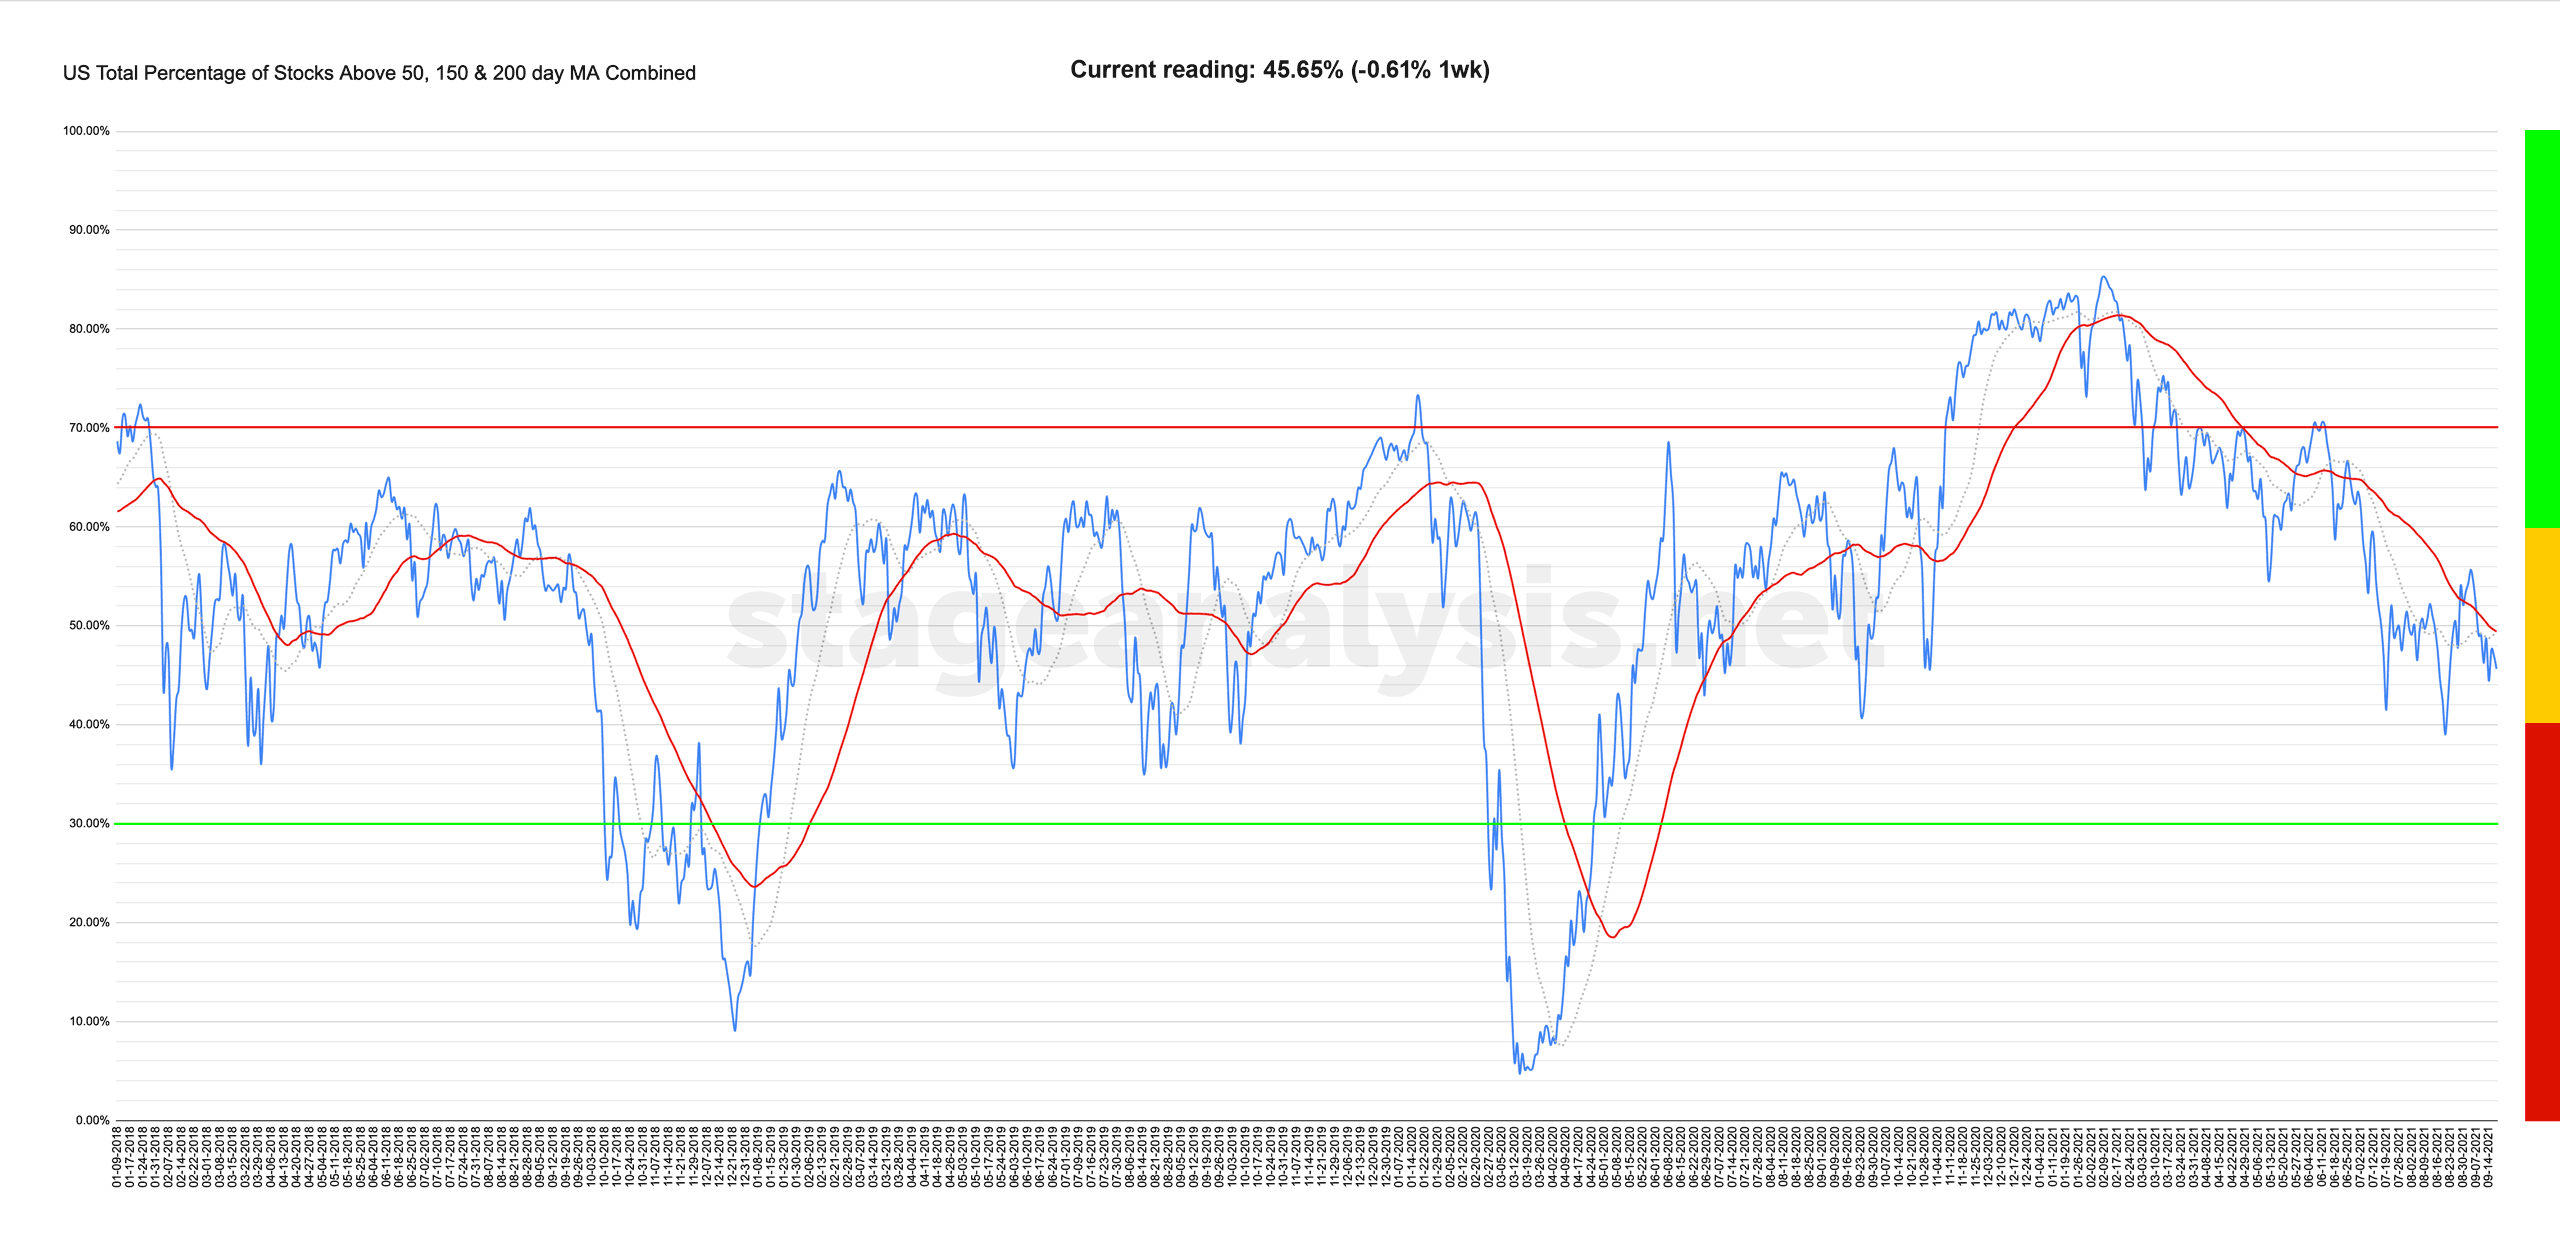
US Total Percentage of Stocks Above Their 50 Day, 150 Day & 200 Day Moving Averages Combined
45.65% (-0.61% 1 week)
Status: Difficult Environment (still below its own declining 50 day MA)
Only a minor change this week, with the Nasdaq outperforming the NYSE and in a better field position
➜ Individual charts for the Nasdaq & NYSE + more custom market breadth charts are available to Stage Analysis - Members channel.
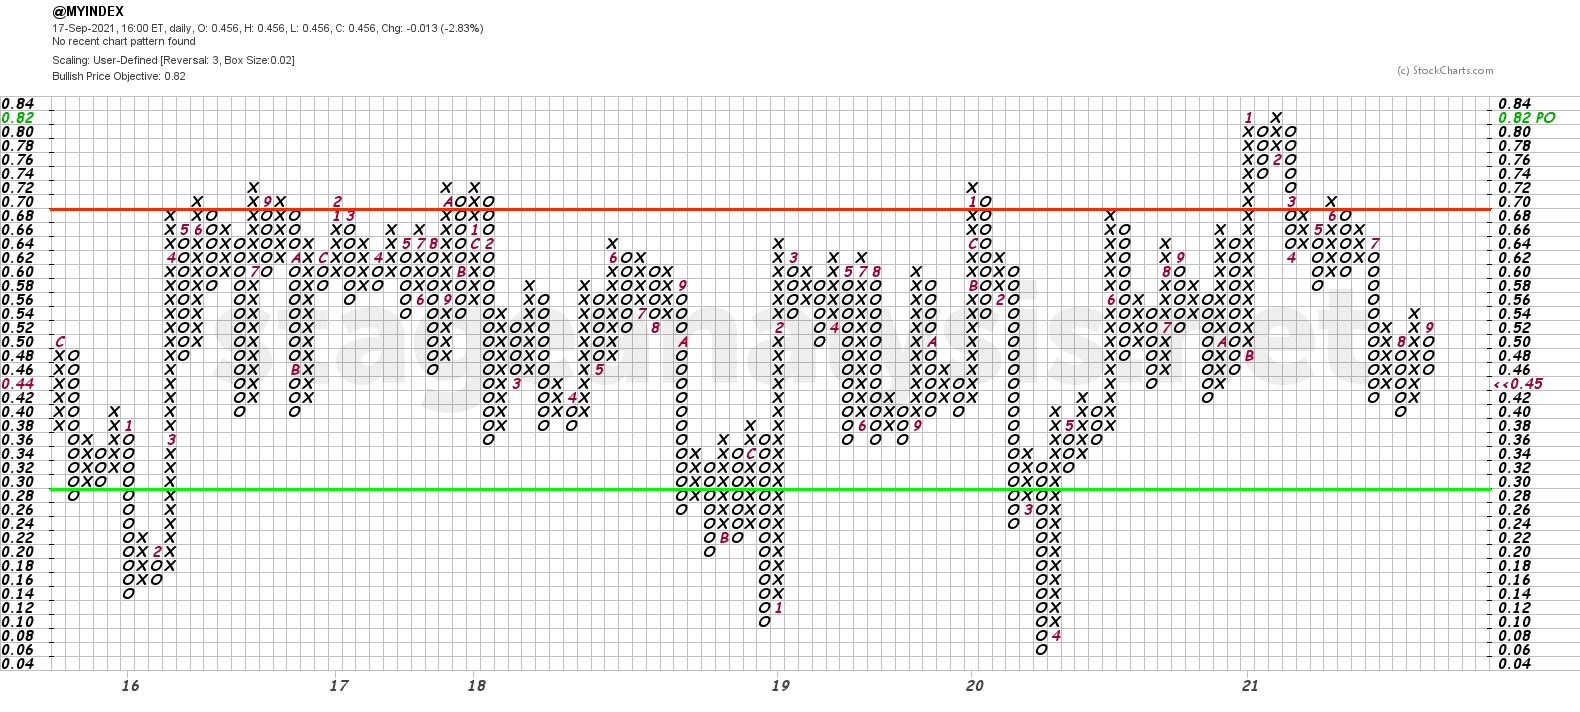
US Total % Stocks Above their 50 Day, 150 Day & 200 Day Moving Averages Combined Point & Figure Chart*
*This chart is completely unique. Not available anywhere else
Become a Stage Analysis Member:
To see more like this – US Stocks watchlist posts, detailed videos each weekend, use our unique Stage Analysis tools, such as the US Stocks & ETFs Screener, Charts, Market Breadth, Group Relative Strength and more...
Join Today
Disclaimer: For educational purpose only. Not investment advice. Seek professional advice from a financial advisor before making any investing decisions.