Stage Analysis Video Training Course

US Stocks Watchlist - 10 January 2021

For the watchlist from the weekend scans in addition to the other stocks that I mentioned in the previous blog post yesterday

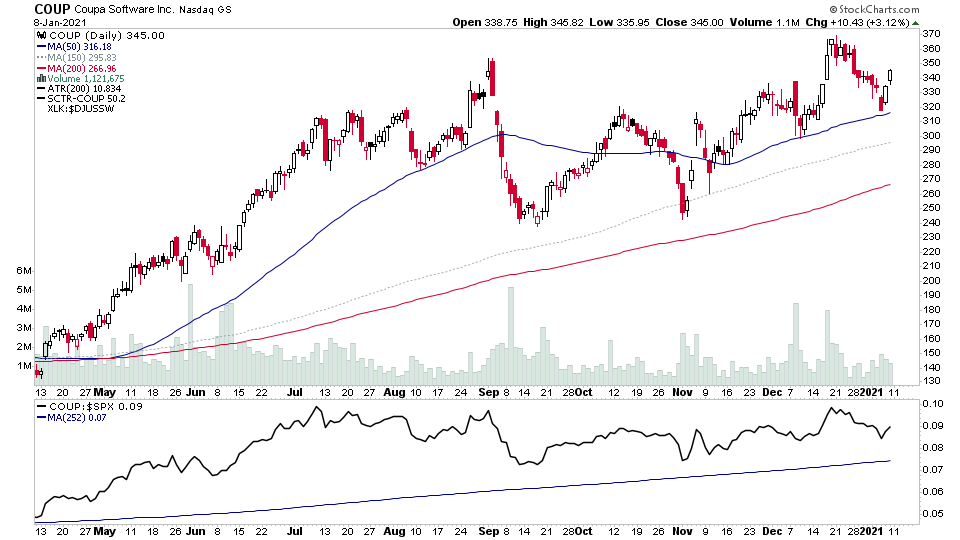
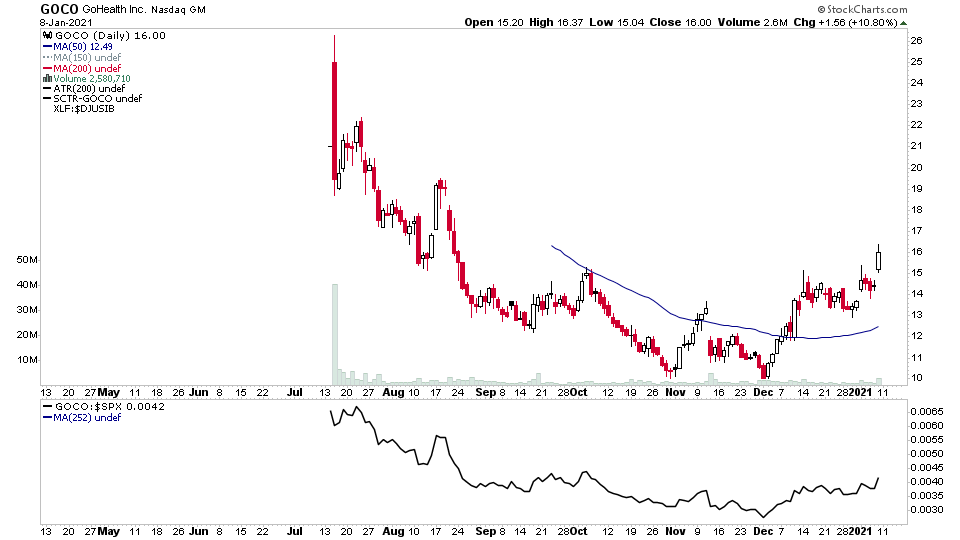
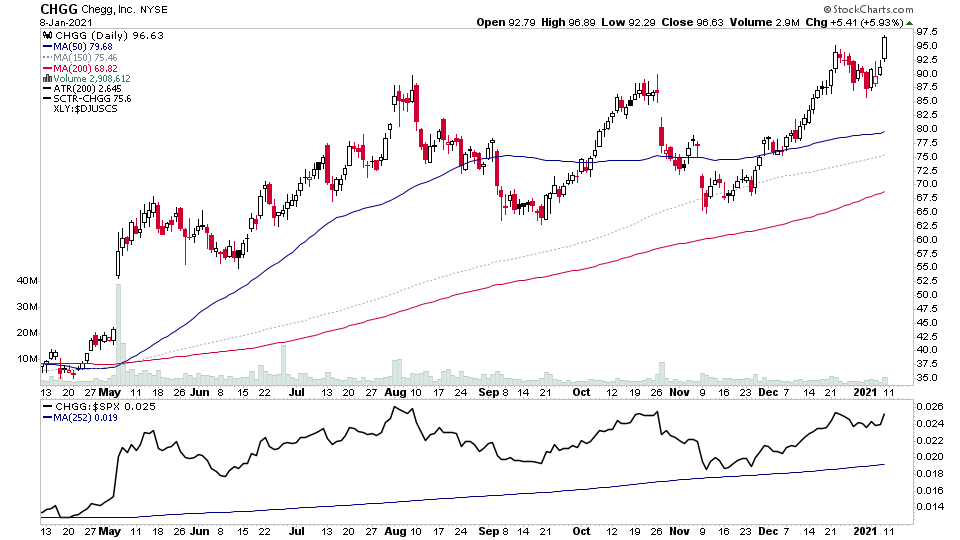
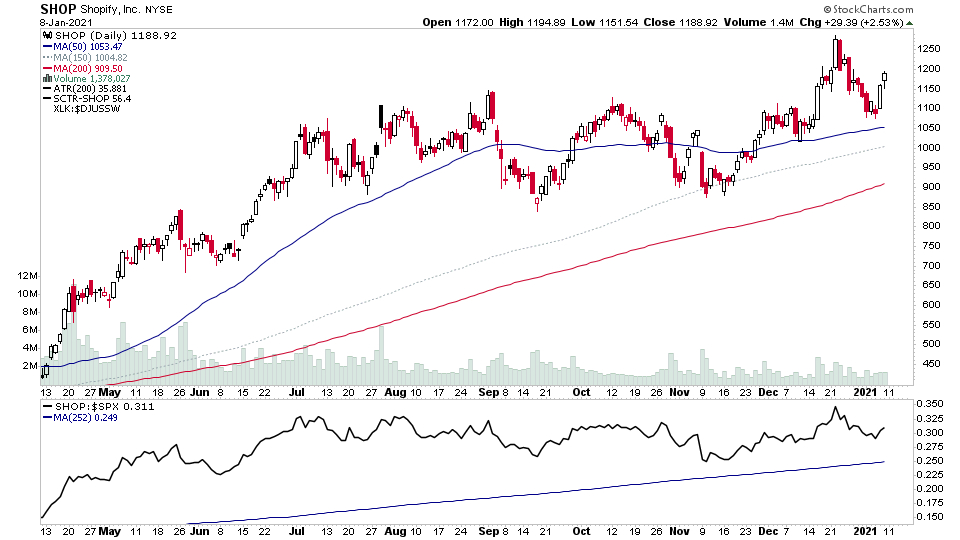
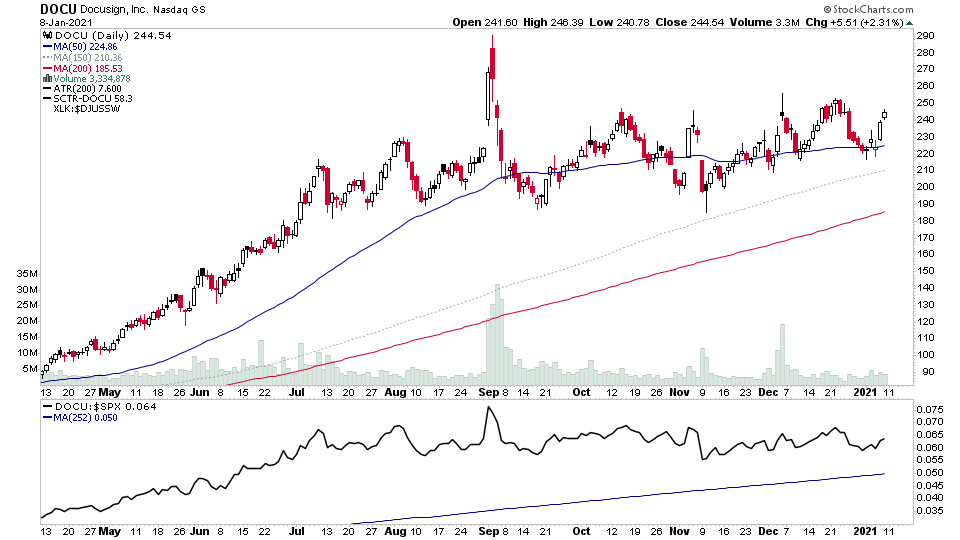
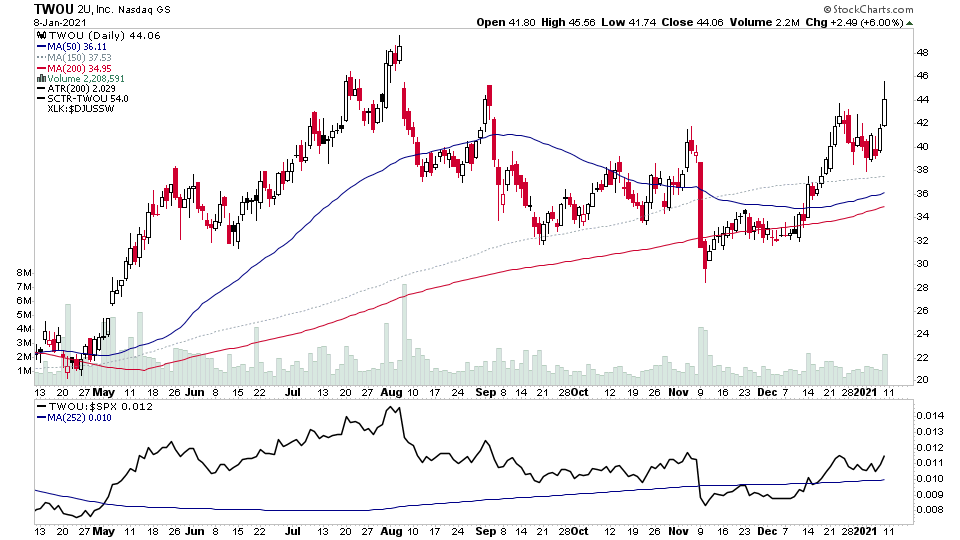
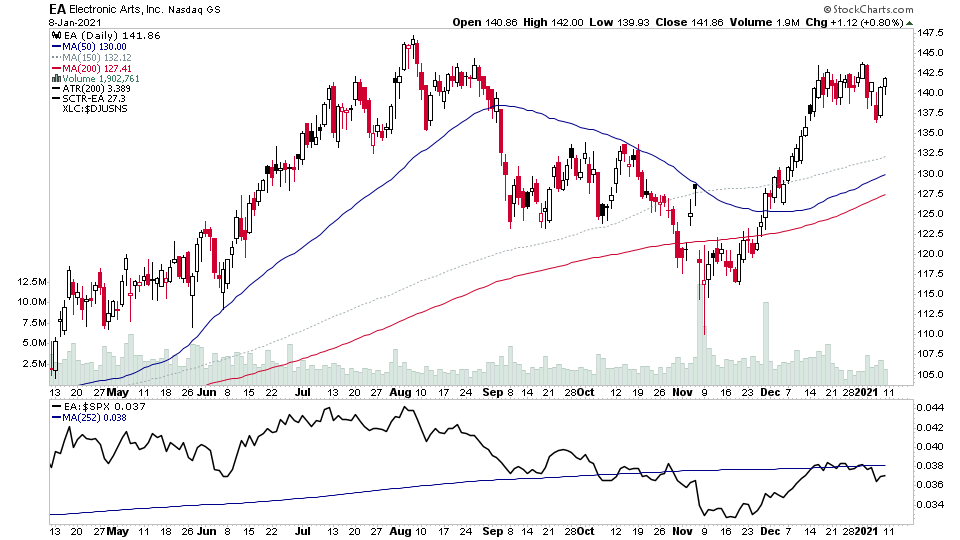
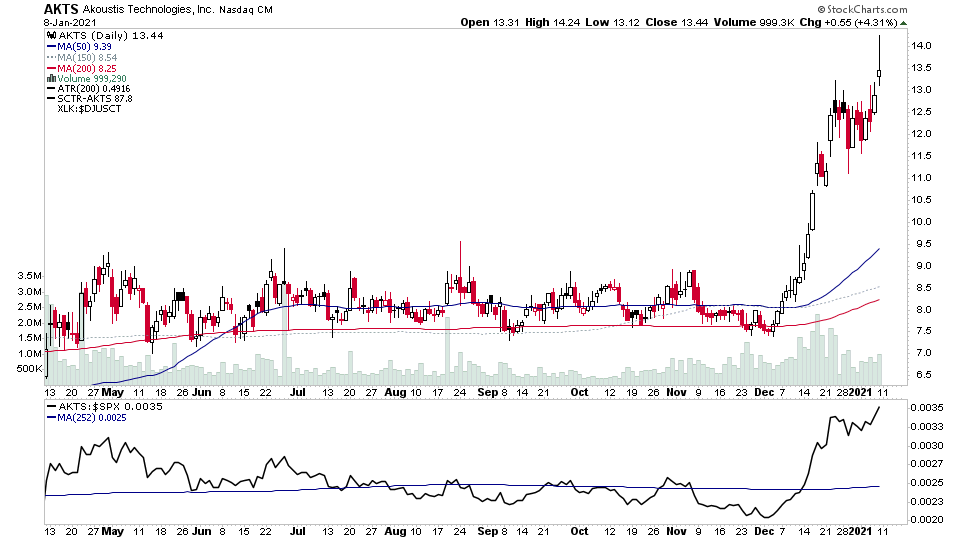
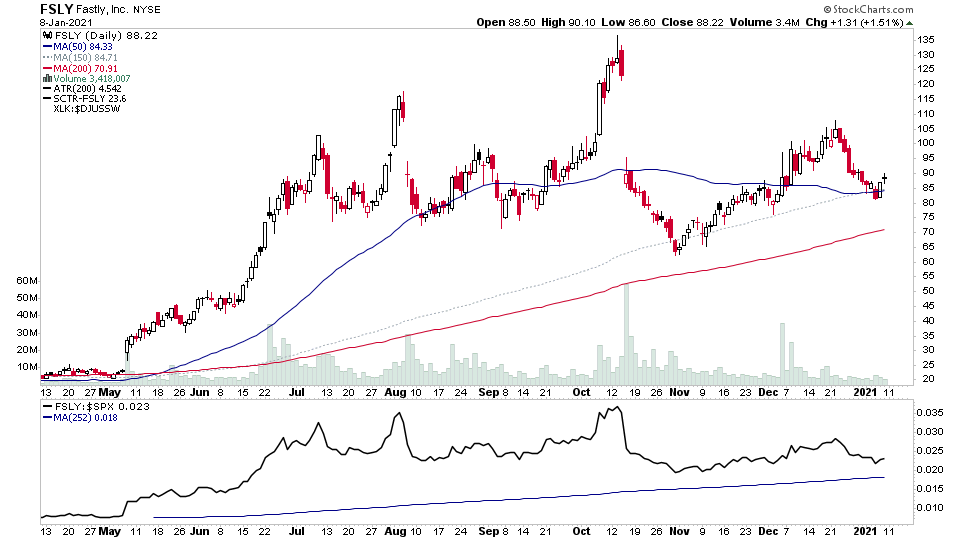
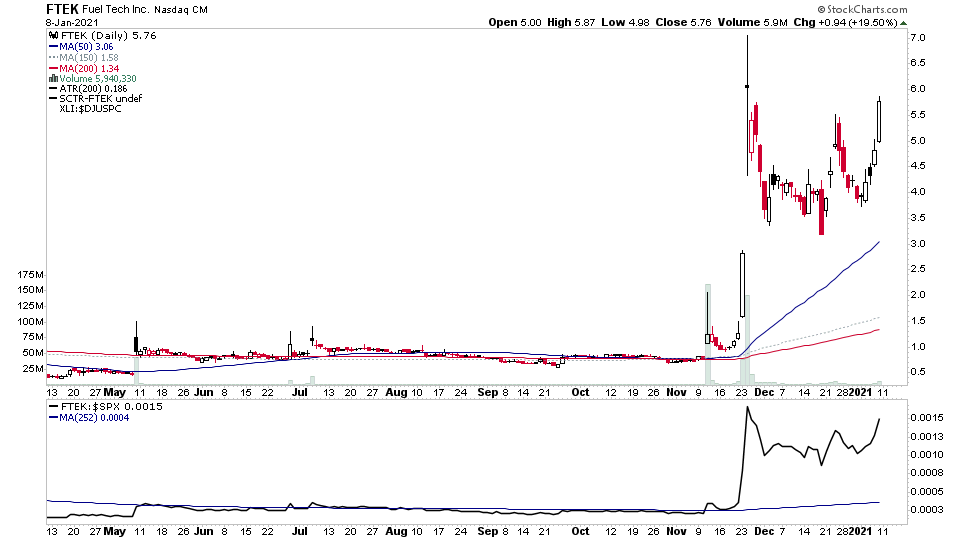
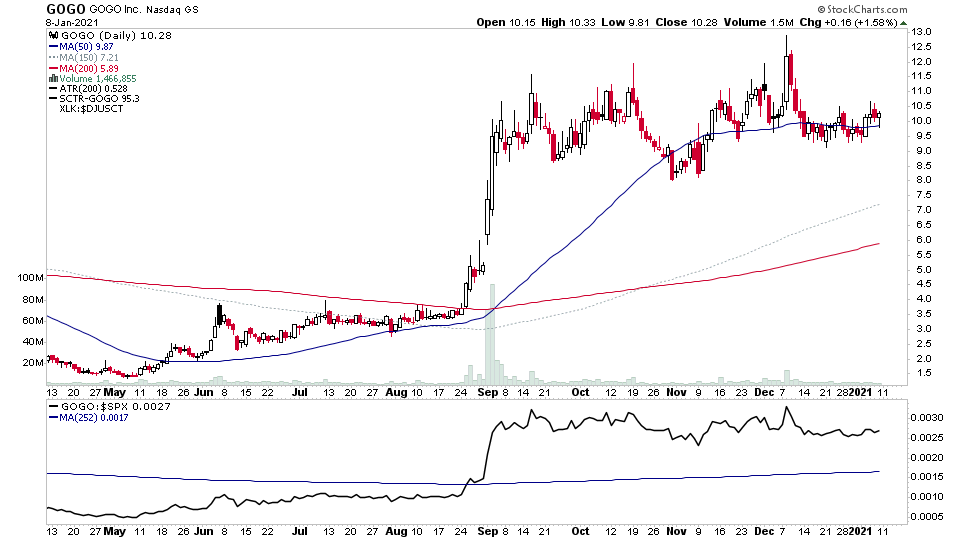
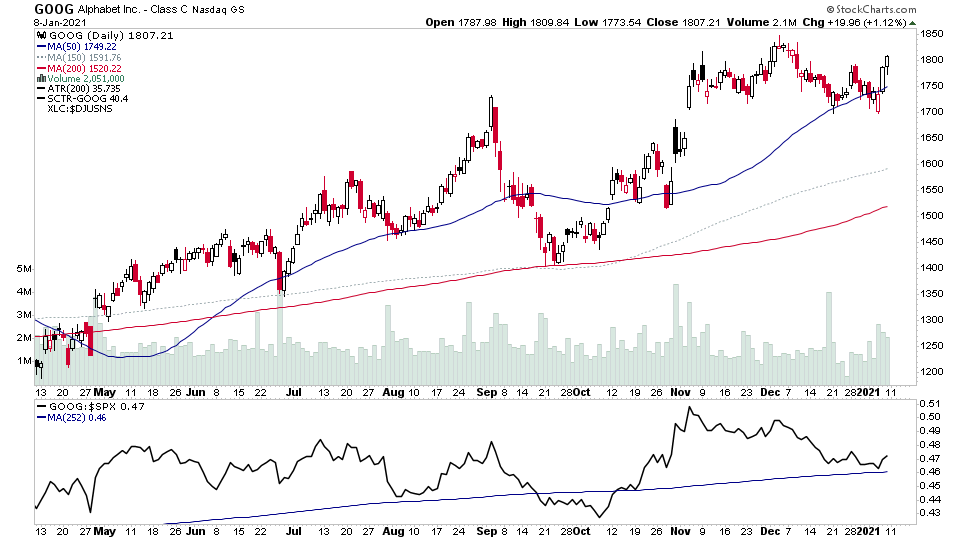
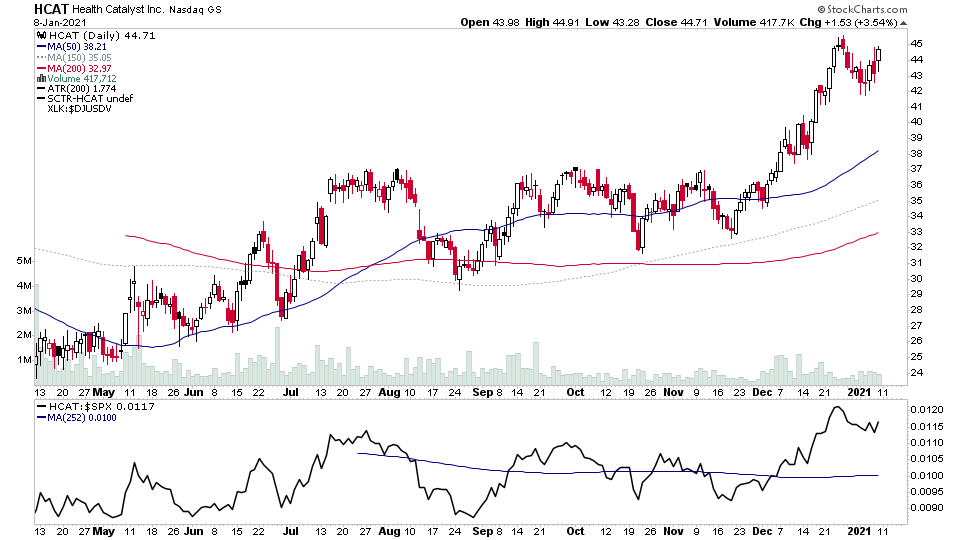
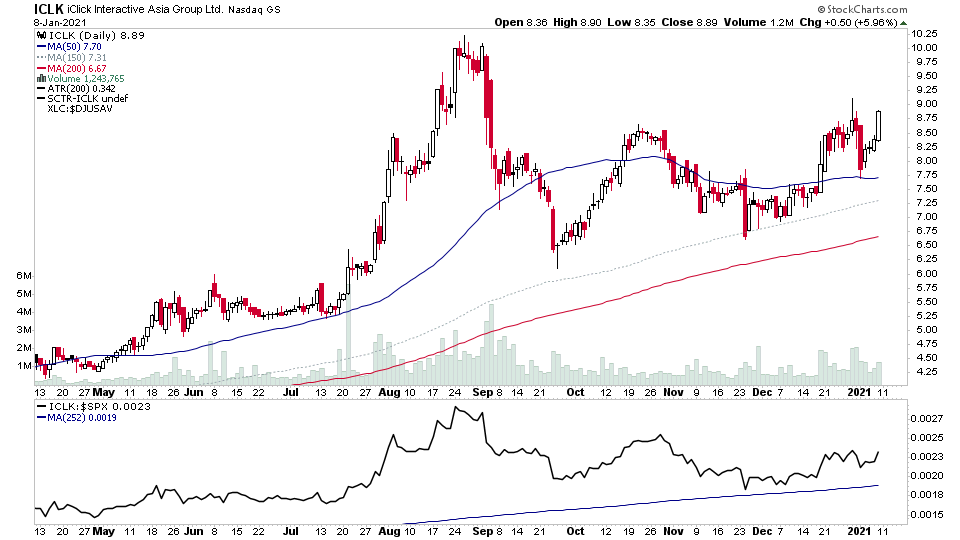
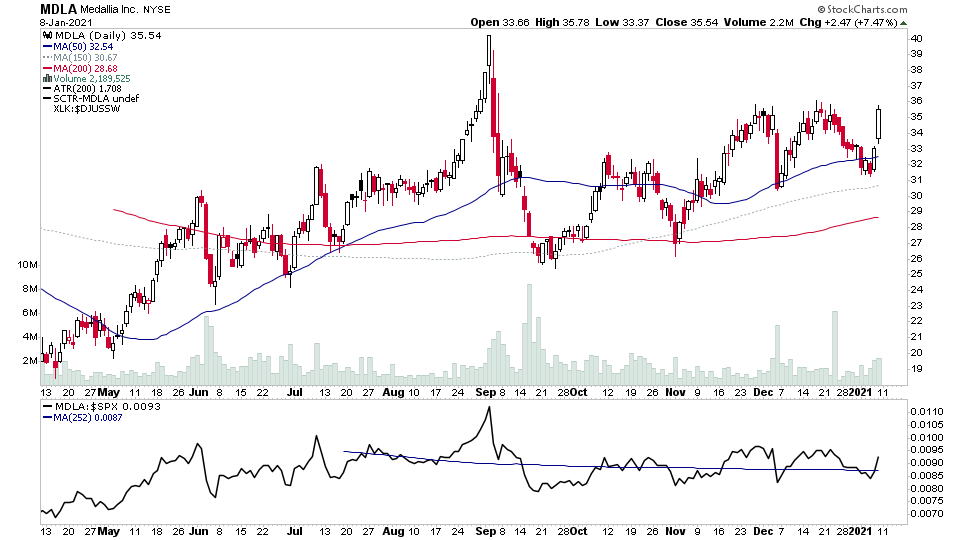
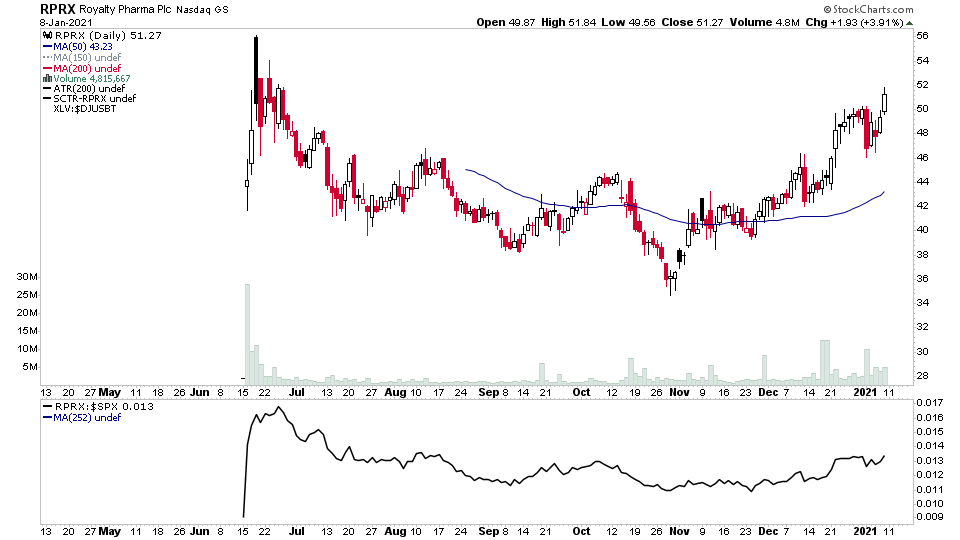
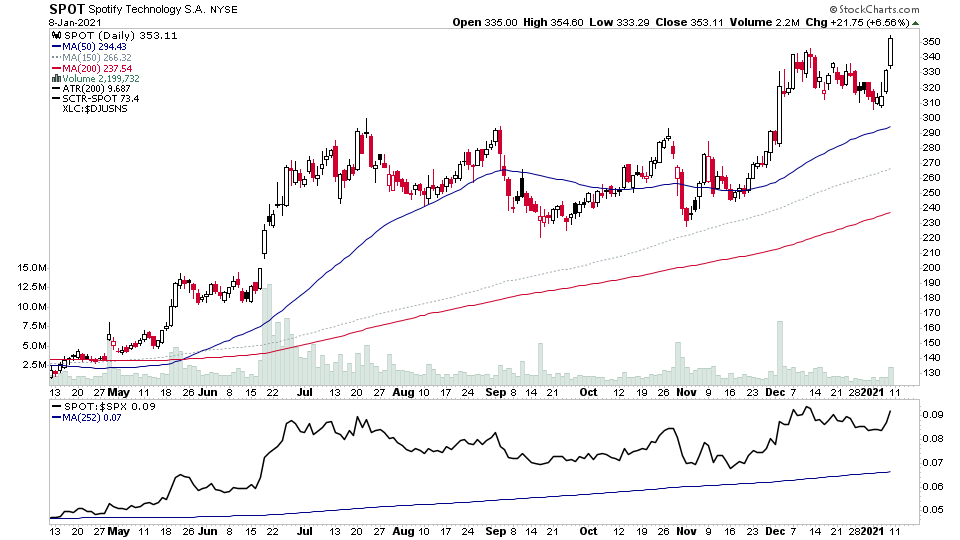
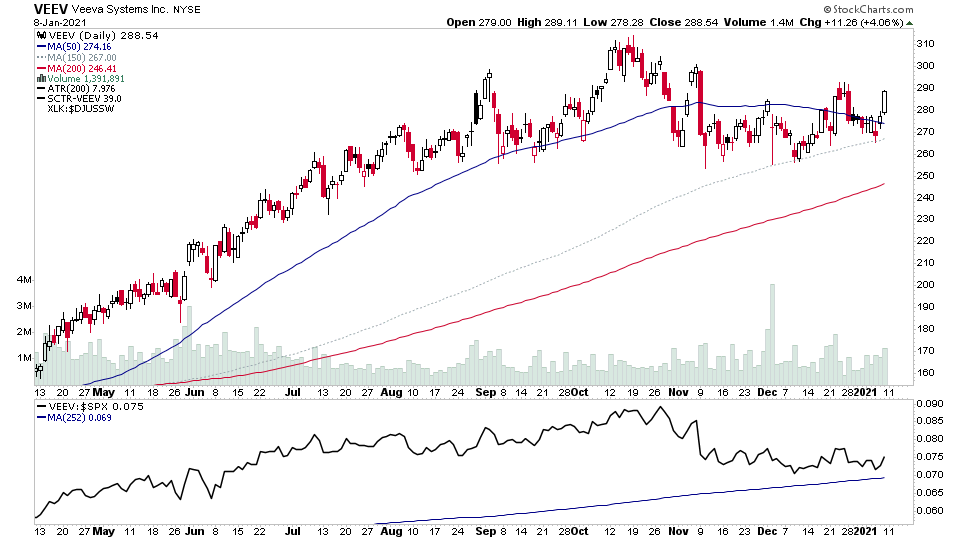
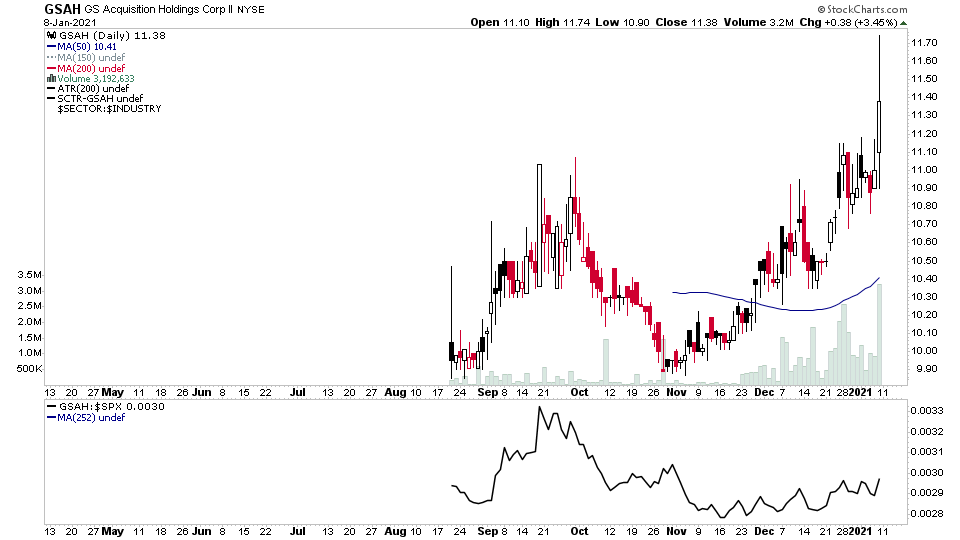
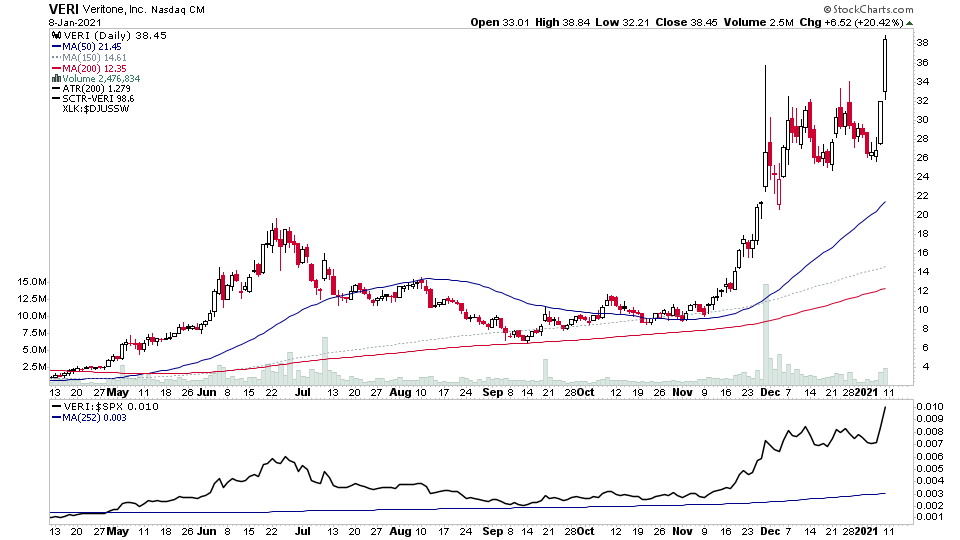
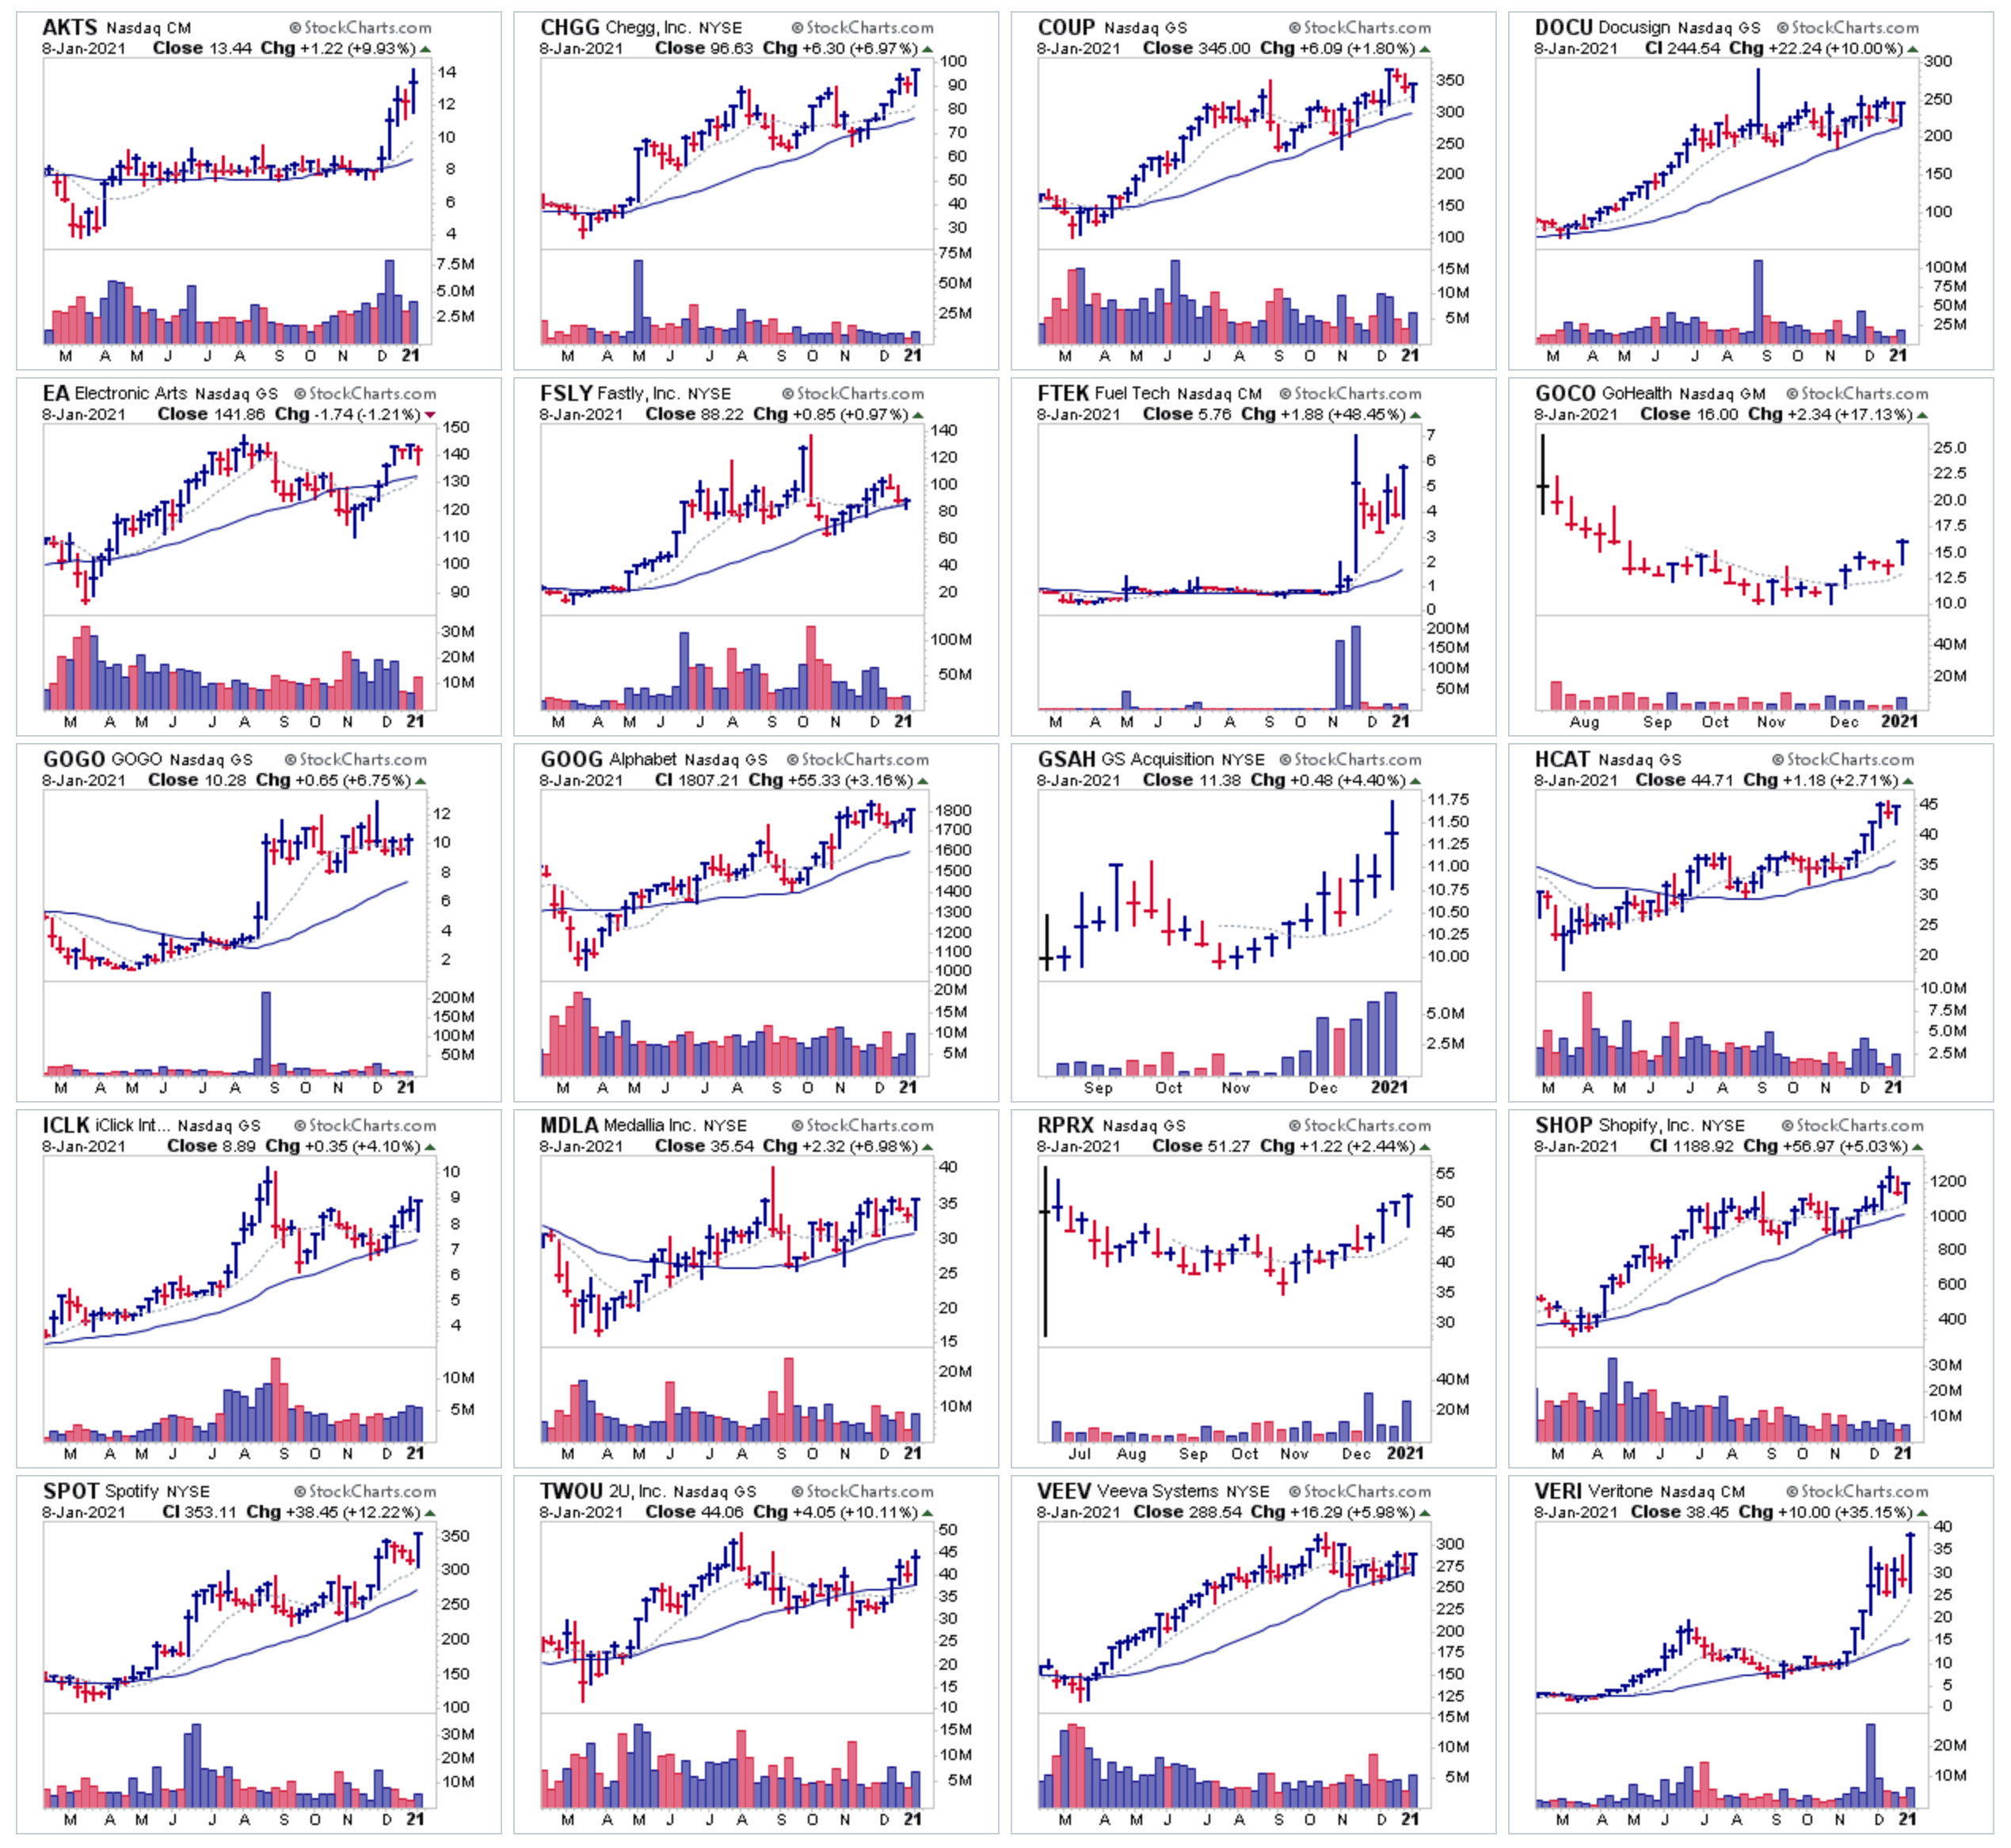
AKTS, CHGG, COUP, DOCU, EA, FSLY, FTEK, GOCO, GOGO, GOOG, GSAH, HCAT, ICLK, MDLA, RPRX, SHOP, SPOT, TWOU, VEEV, VERI

Daily Charts

Weekly Thumbnail Charts


Disclaimer: For educational purpose only. Not investment advice. Seek professional advice from a financial advisor before making any investing decisions.

Recent Articles

SPX W 23 3 23

US Stocks Watchlist – 23 March 2023

One of the primary purposes of the daily watchlist scans is as alternative form of market breadth, as by scanning the market daily and looking for stocks displaying the characteristics of Stage 1 and Stage 2. It gives a really good idea of the overall market health...
Read More
SPX D 21 3 23

S&P 500 Divergence and the US Stocks Watchlist – 21 March 2023

The S&P 500 moved strongly back above its 20 day EMA today. But as you can see in the above chart, there's a notable difference with the S&P 500 percentage of stocks above their 20 day EMA (middle indicator) which is at 36.60%, as with the S&P 500 index above its 20 day MA by almost 1%, you would expect at least 50% of S&P 500 to be doing the same...
Read More
SPX D 19 3 23

Stage Analysis Members Video – 19 March 2023 (1hr 20mins)

This weekends video begins with a detailed discussion of the IBD Industry Groups Bell Curve – Bullish Percent and the Market Breadth Indicators, in order to help to determine the weight of evidence, which is the most crucial aspect of Stan Weinstein's Stage Analysis method. The changes in the US Stocks Industry Groups RS Rankings are then discussed, as well as the Major Indexes Update and Futures, including the S&P 500, Nasdaq 100, Russell 2000, US Dollar Index, Gold etc. Followed by a review of the watchlist stocks from the weekend scans.
Read More