
Analysing the Stage 2 run in Ford (F)
It's hard to sit through an entire Stage 2 advance, as there are usually a number of significant pullbacks towards the 30 week moving average which try to shake people out of the stock. The following is a breakdown of Fords entire Stage 2 advance from late 2012 until the end of 2013 and I've shown the weekly chart at the lows of each significant pullback, so that you can see what it looks like and what the percentage moves were in this case on each pullback. As holding through the pullbacks is a necessary part of the investor method in order to capture the bulk of the Stage 2 move, but some people find it hard in practice as you often see gains that took months to accumulate wiped out, before it once again moves higher.
So lets start at the beginning of the Stage 2 advance in Ford...
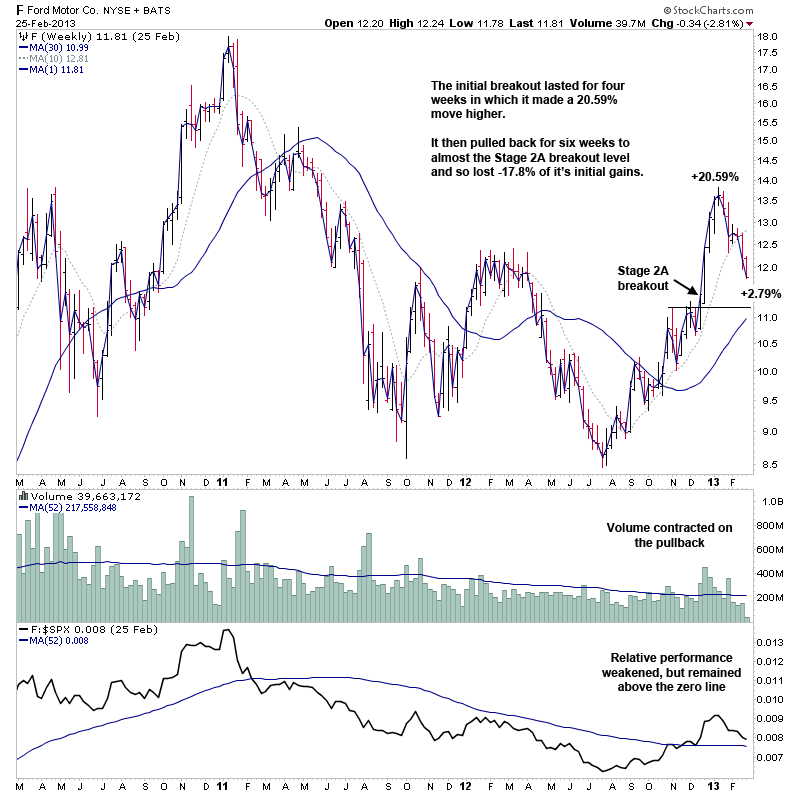
In December 2012 Ford (F) made it's Stage 2A breakout following a small head and shoulders bottom through the summer months, and then a brief Stage 1 consolidation in the Autumn above it's 30 week MA before breaking out on increasing volume in December.
The initial breakout lasted for four weeks in which it made a 20.59% move higher and then pulled back for six weeks to almost the Stage 2A breakout level and so lost -17.8% of it's initial gains
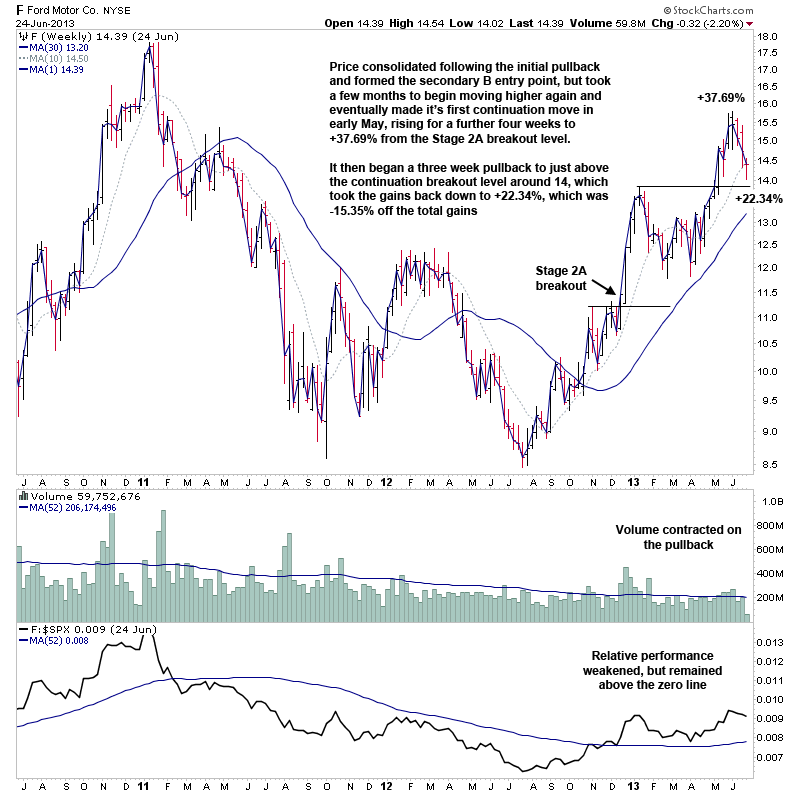
Price consolidated following the initial pullback and formed the secondary B entry point, but took a few months to begin moving higher again and eventually made it's first continuation move in early May, rising for a further four weeks to +37.69% from the Stage 2A breakout level.
It then began a three week pullback to just above the continuation breakout level around 14, which took the gains back down to +22.34%, which was -15.35% off the total gains
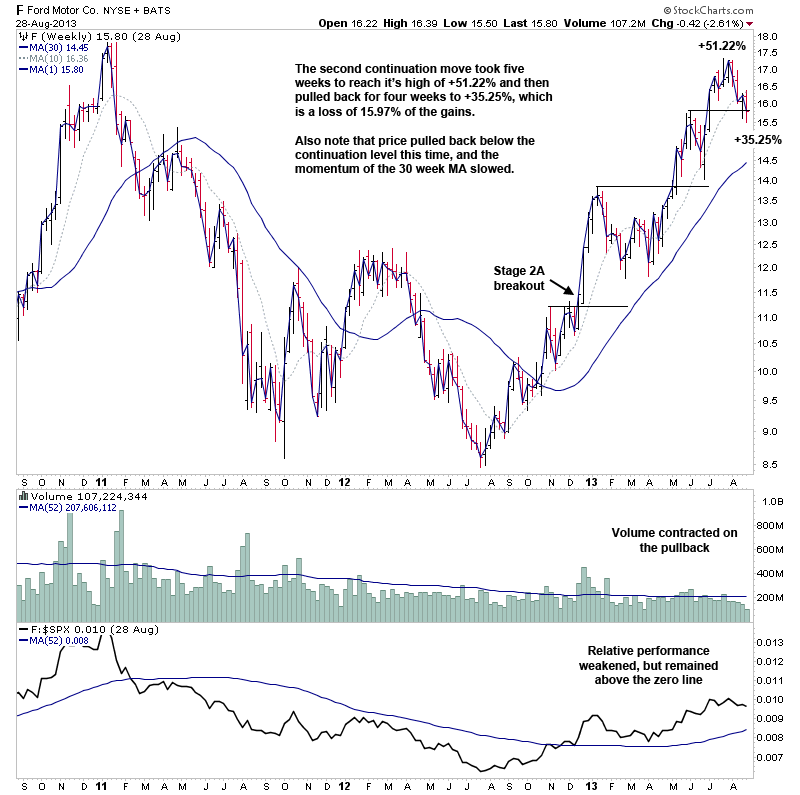
The second continuation move took five weeks to reach it's high of +51.22% and then pulled back for four weeks to +35.25%, which is a loss of -15.97% of the gains.
Also note that price pulled back below the continuation level this time, and the momentum of the 30 week MA slowed.
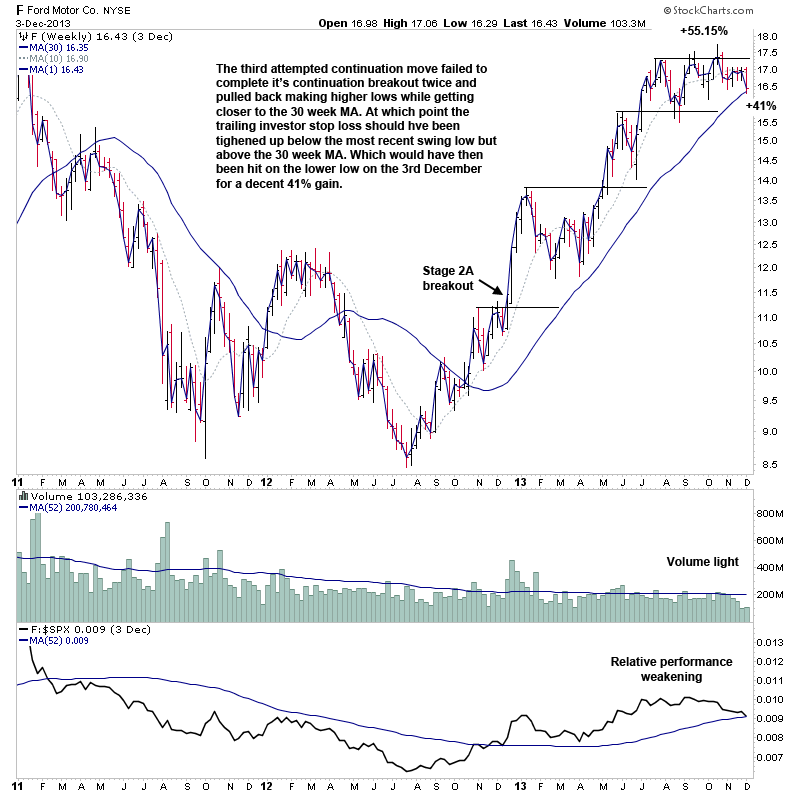
The third attempted continuation move failed to complete it's continuation breakout twice and pulled back making higher lows while getting closer to the 30 week MA. At which point the trailing investor stop loss should have been tightened up below the most recent swing low but above the 30 week MA. Which would have then been hit on the lower low on the 3rd December for roughly a 41% gain.
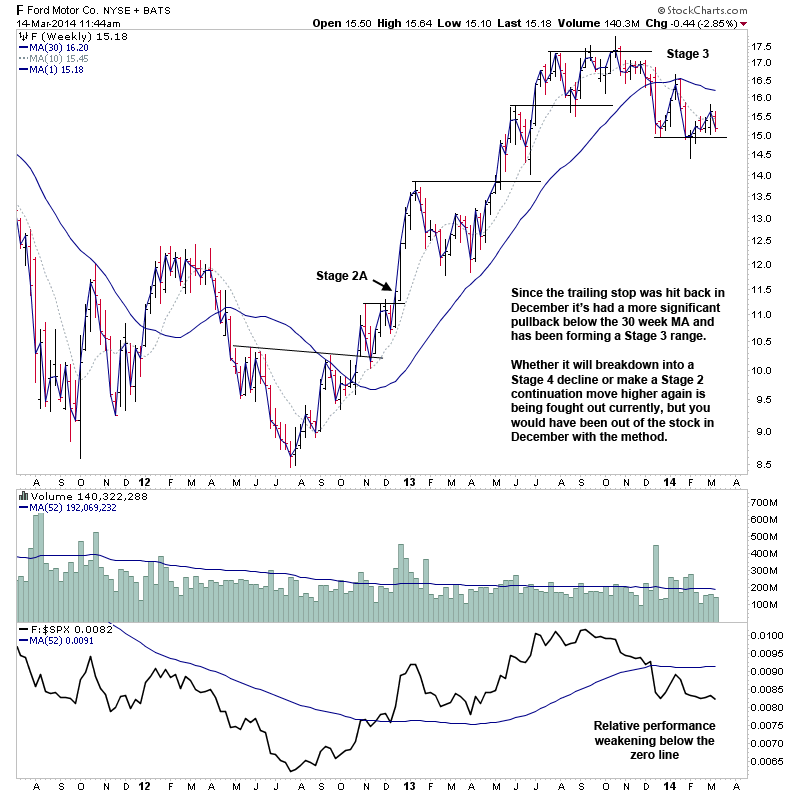
Since the trailing stop was hit back in December 2013 it then a more significant pullback below the 30 week MA and was beginning to form a Stage 3 range.
So in early 2014, whether it would breakdown into a Stage 4 decline or make a Stage 2 continuation move higher again was being fought out, but you would have been out of the stock in December 2013 with the Stan Weinstein's Stage Analysis method, and able to put your money to work in new stocks breaking out into Stage 2A or making Stage 2 continuation moves.
Become a Stage Analysis Member:
To see more like this – US Stocks watchlist posts, detailed videos each weekend, use our unique Stage Analysis tools, such as the US Stocks & ETFs Screener, Charts, Market Breadth, Group Relative Strength and more...
Join Today
Disclaimer: For educational purpose only. Not investment advice. Seek professional advice from a financial advisor before making any investing decisions.