
US Breakout Stocks Watchlist - 19 October 2020
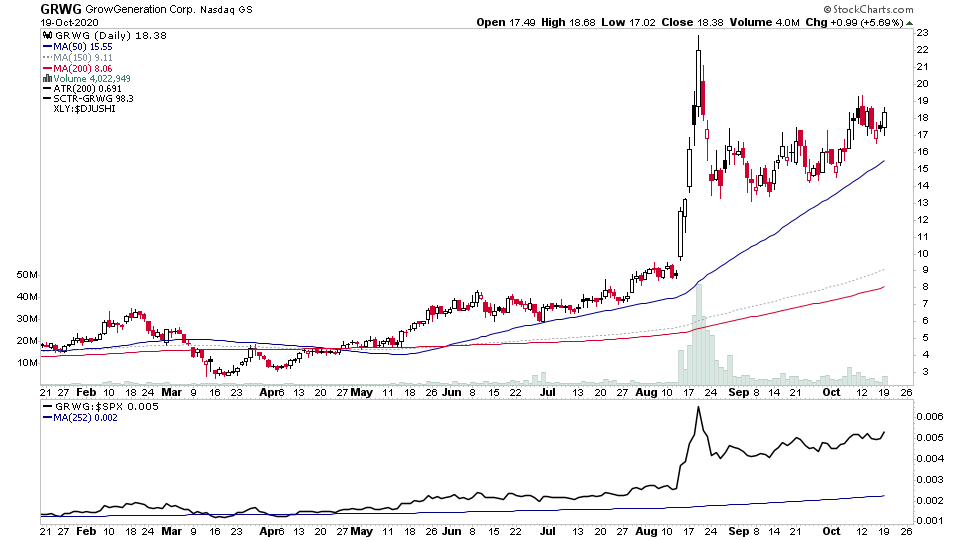
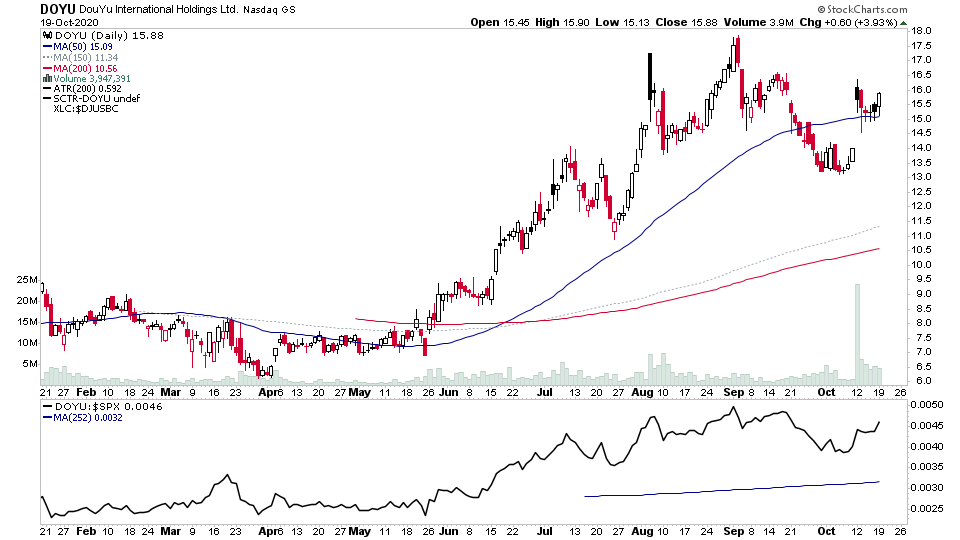
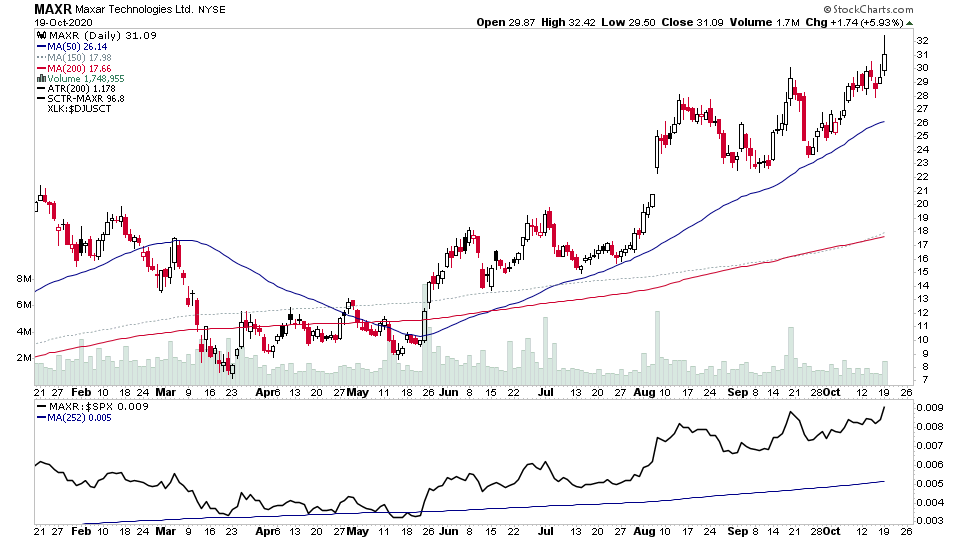
For the watchlist from Mondays scans - AXTI, DOYU, GRWG, MAXR

Disclaimer: For educational purpose only. Not investment advice. Seek professional advice from a financial advisor before making any investing decisions.