
Crypto Breadth: Percentage of Crypto Coins Above Short, Medium & Long Term Moving Averages
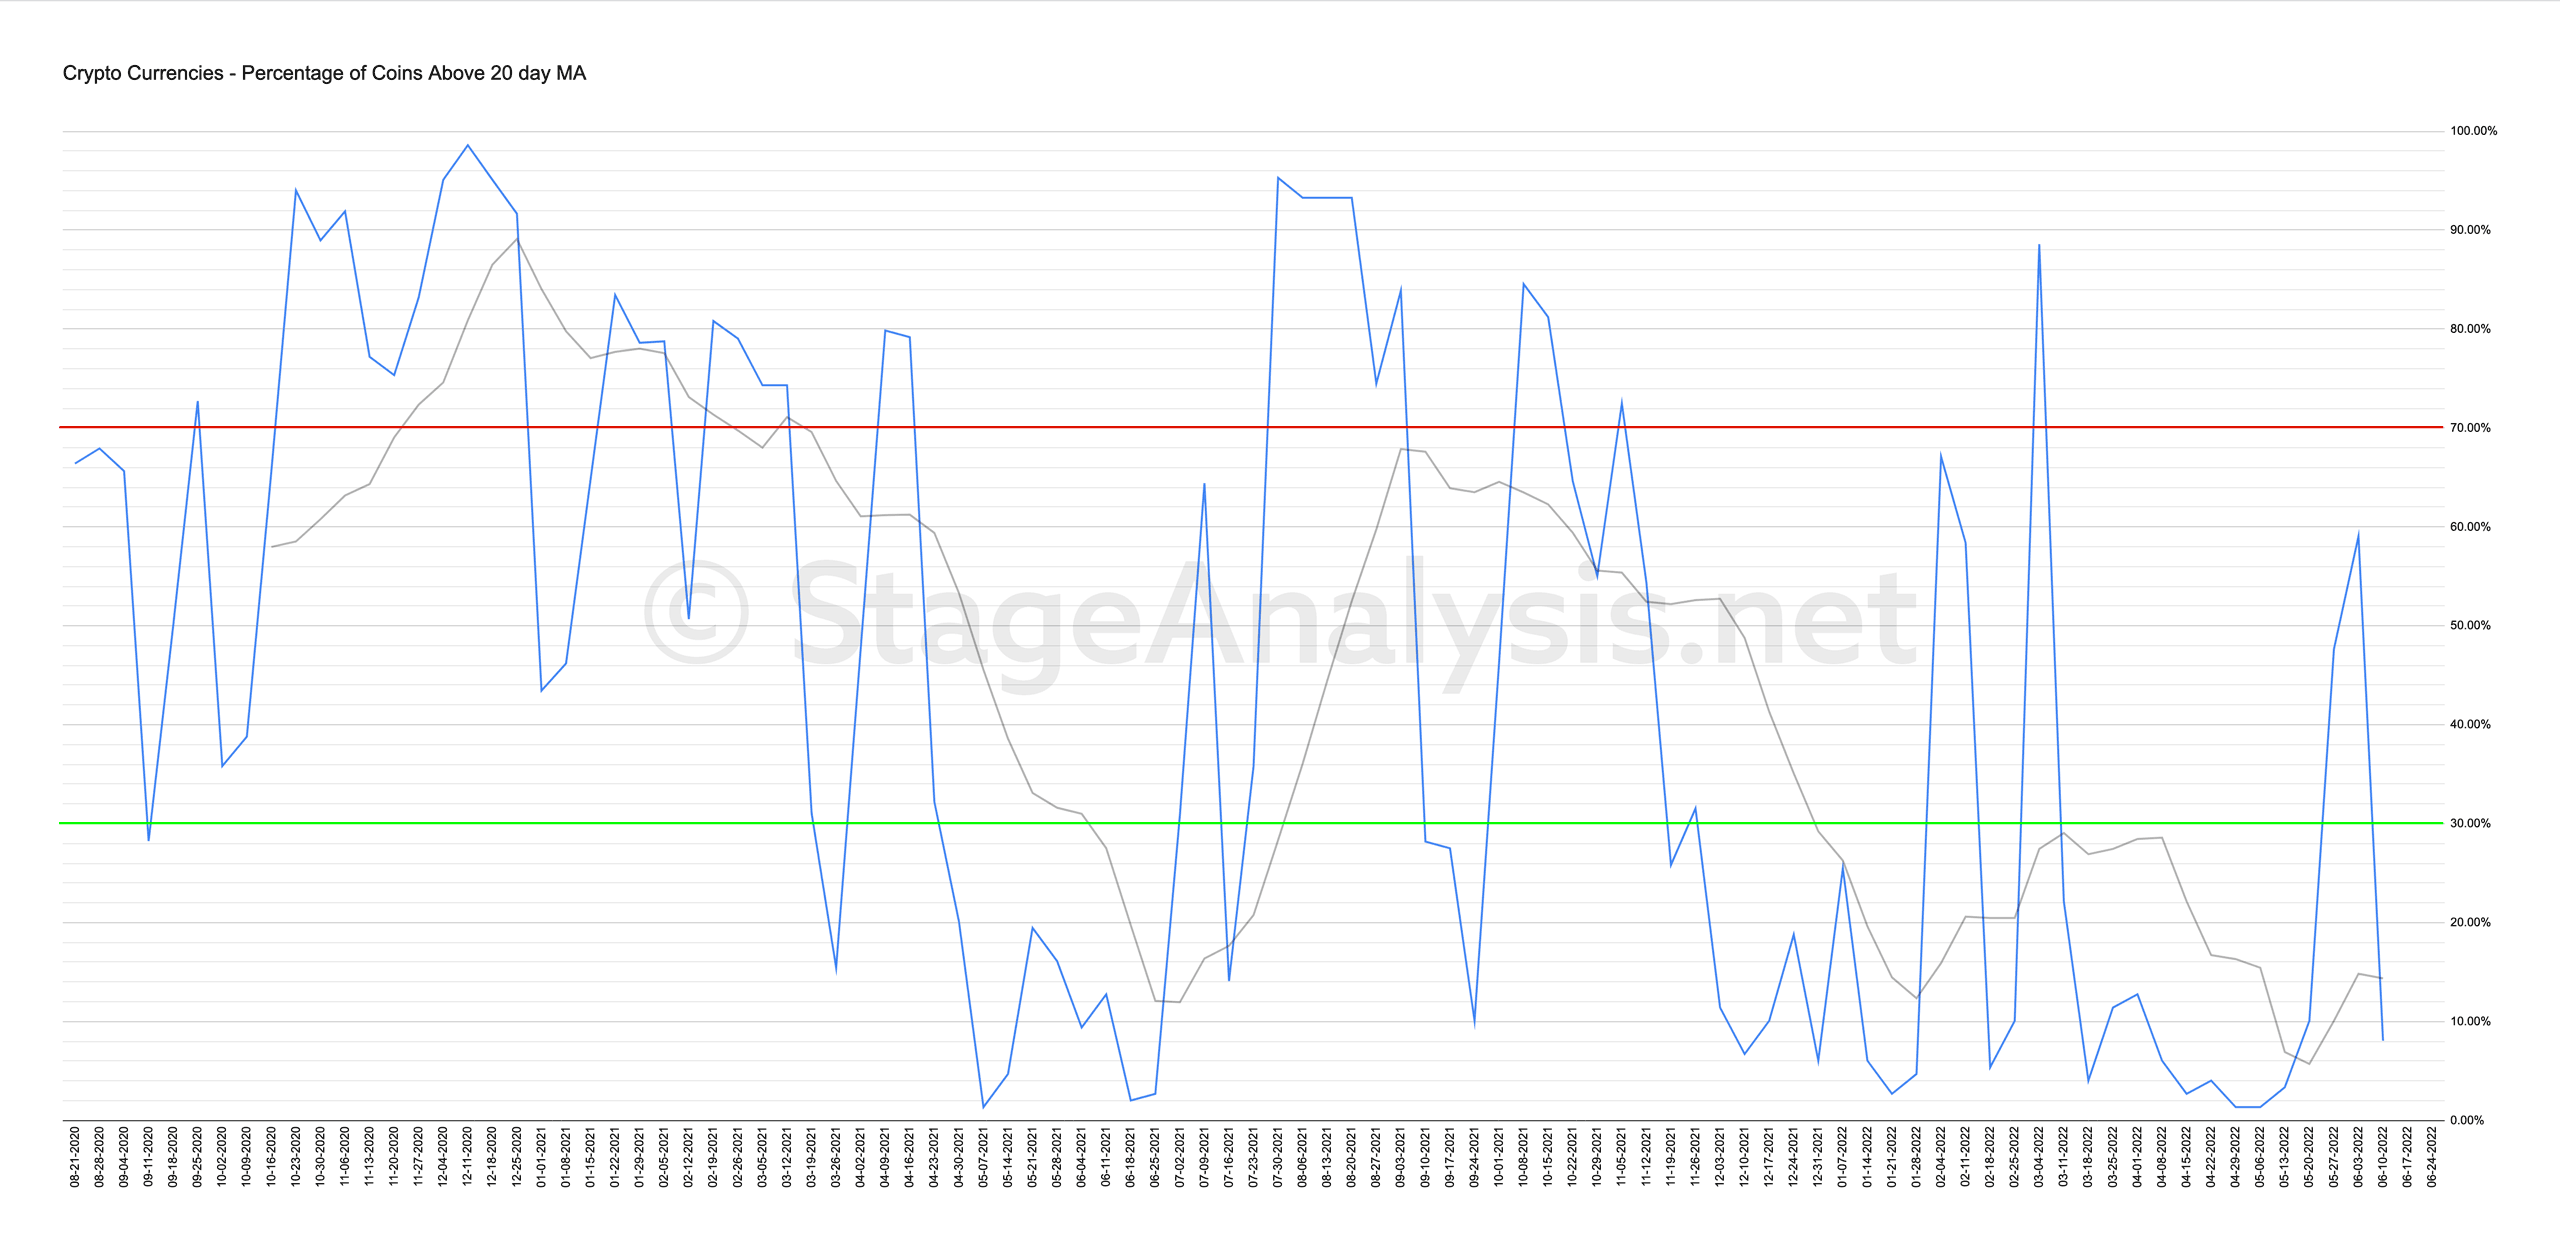
% Above 20 day MA: 8.05% (-51.01%)
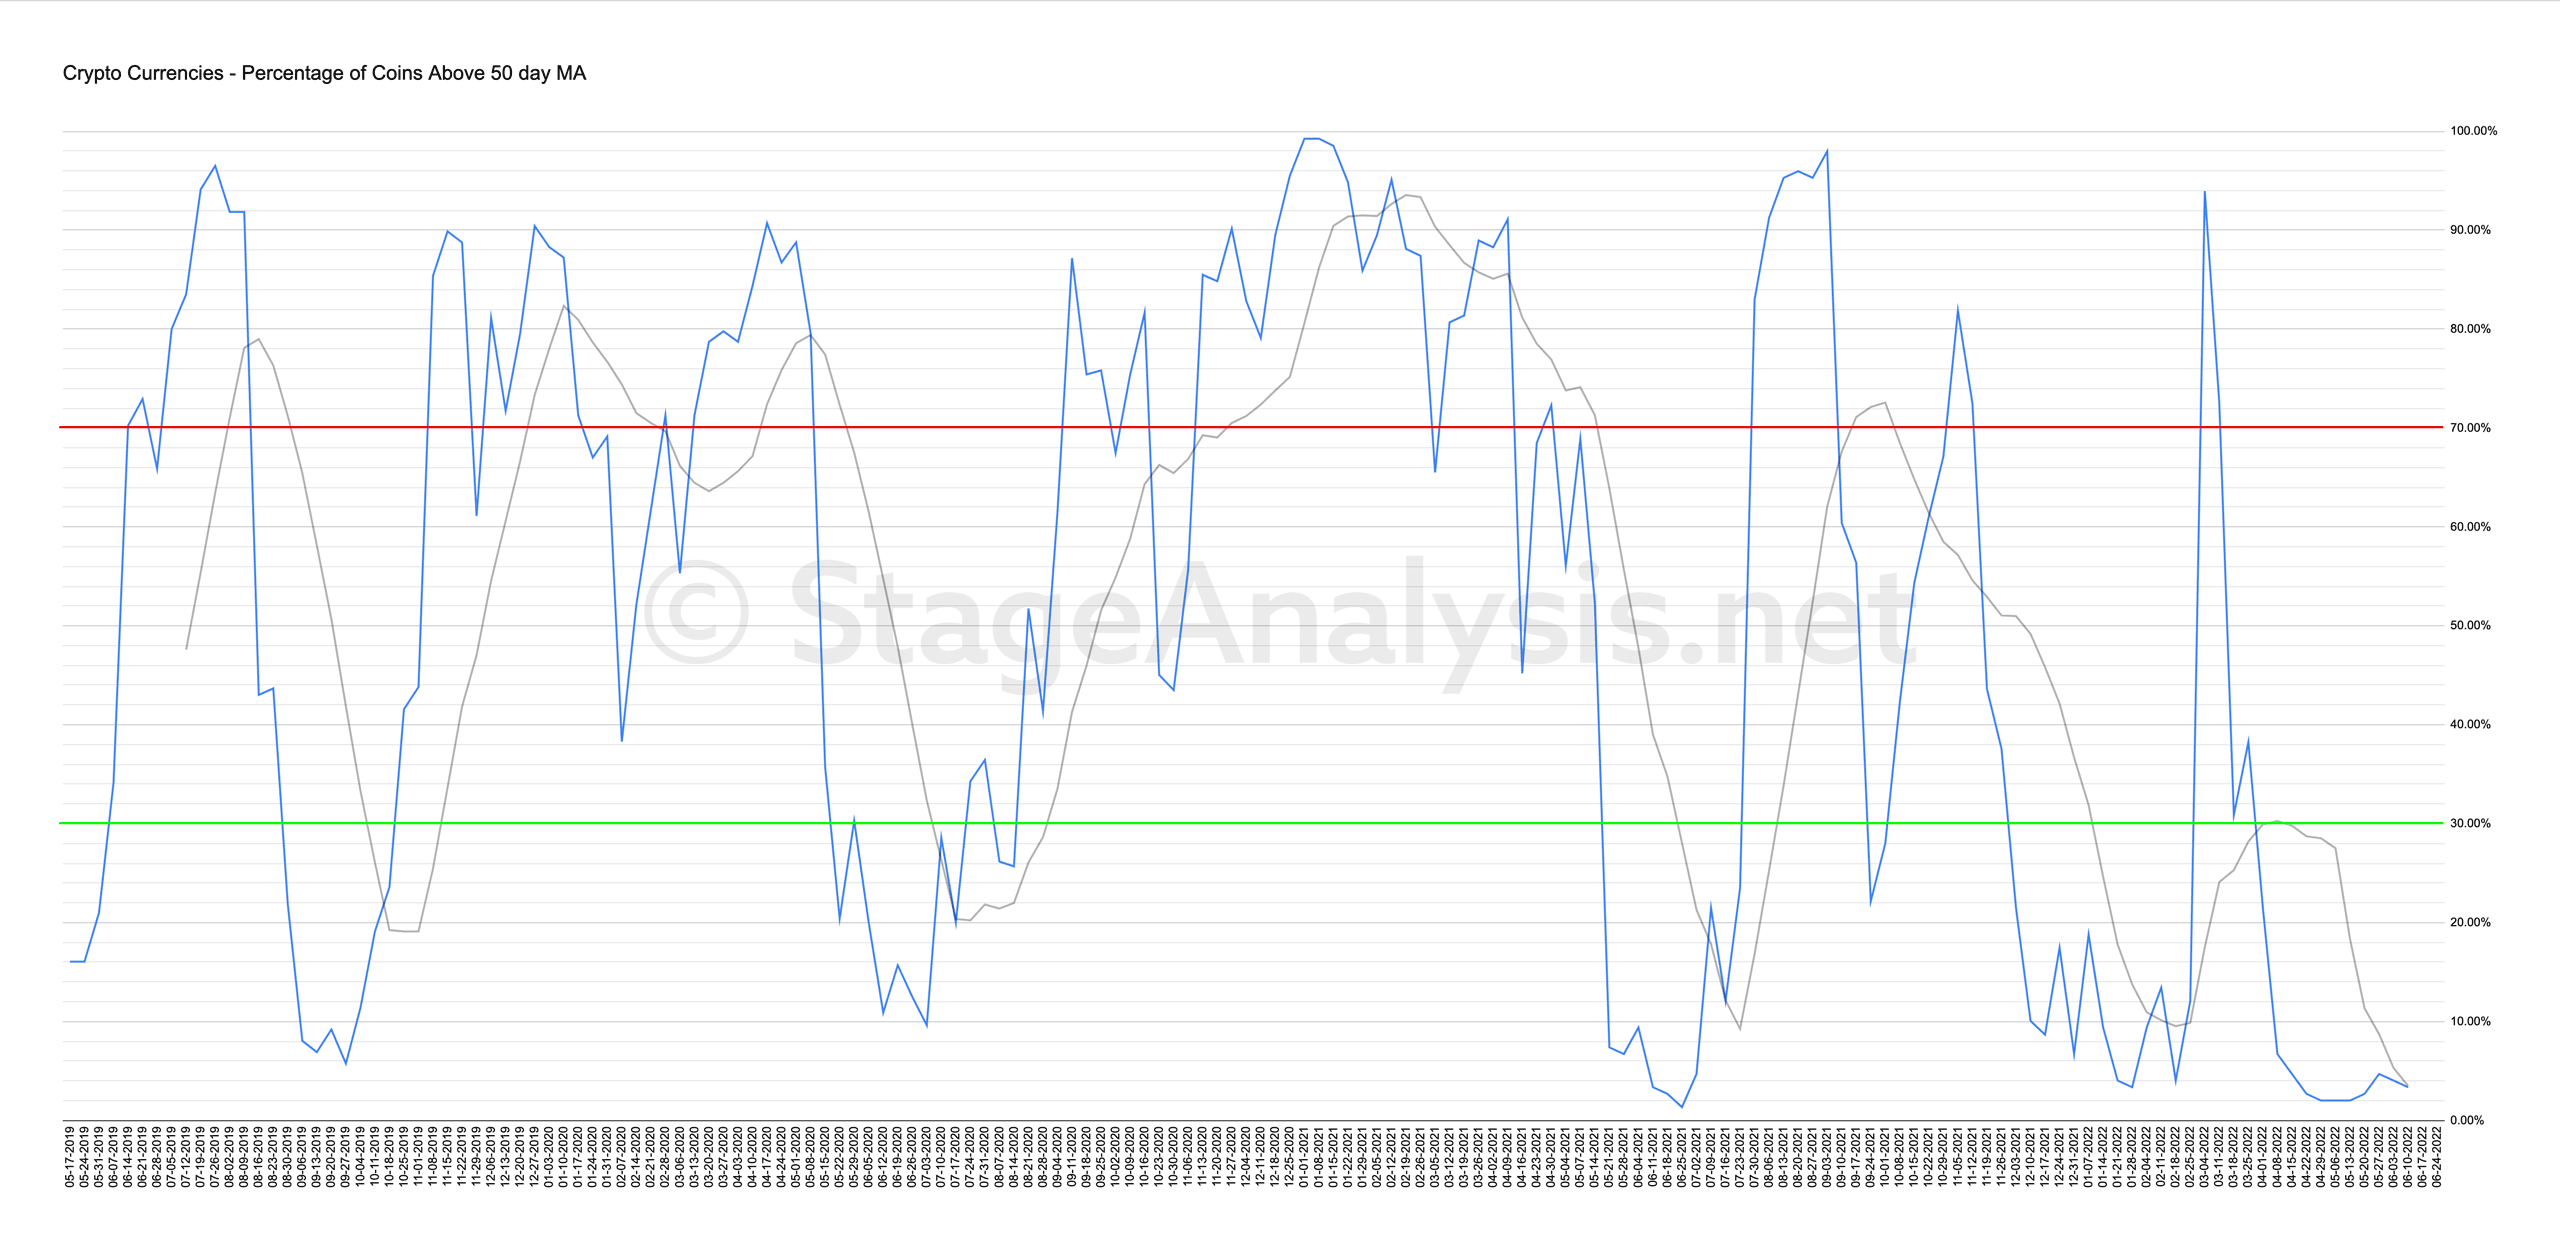
% Above 50 day MA: 3.36% (-0.67%)
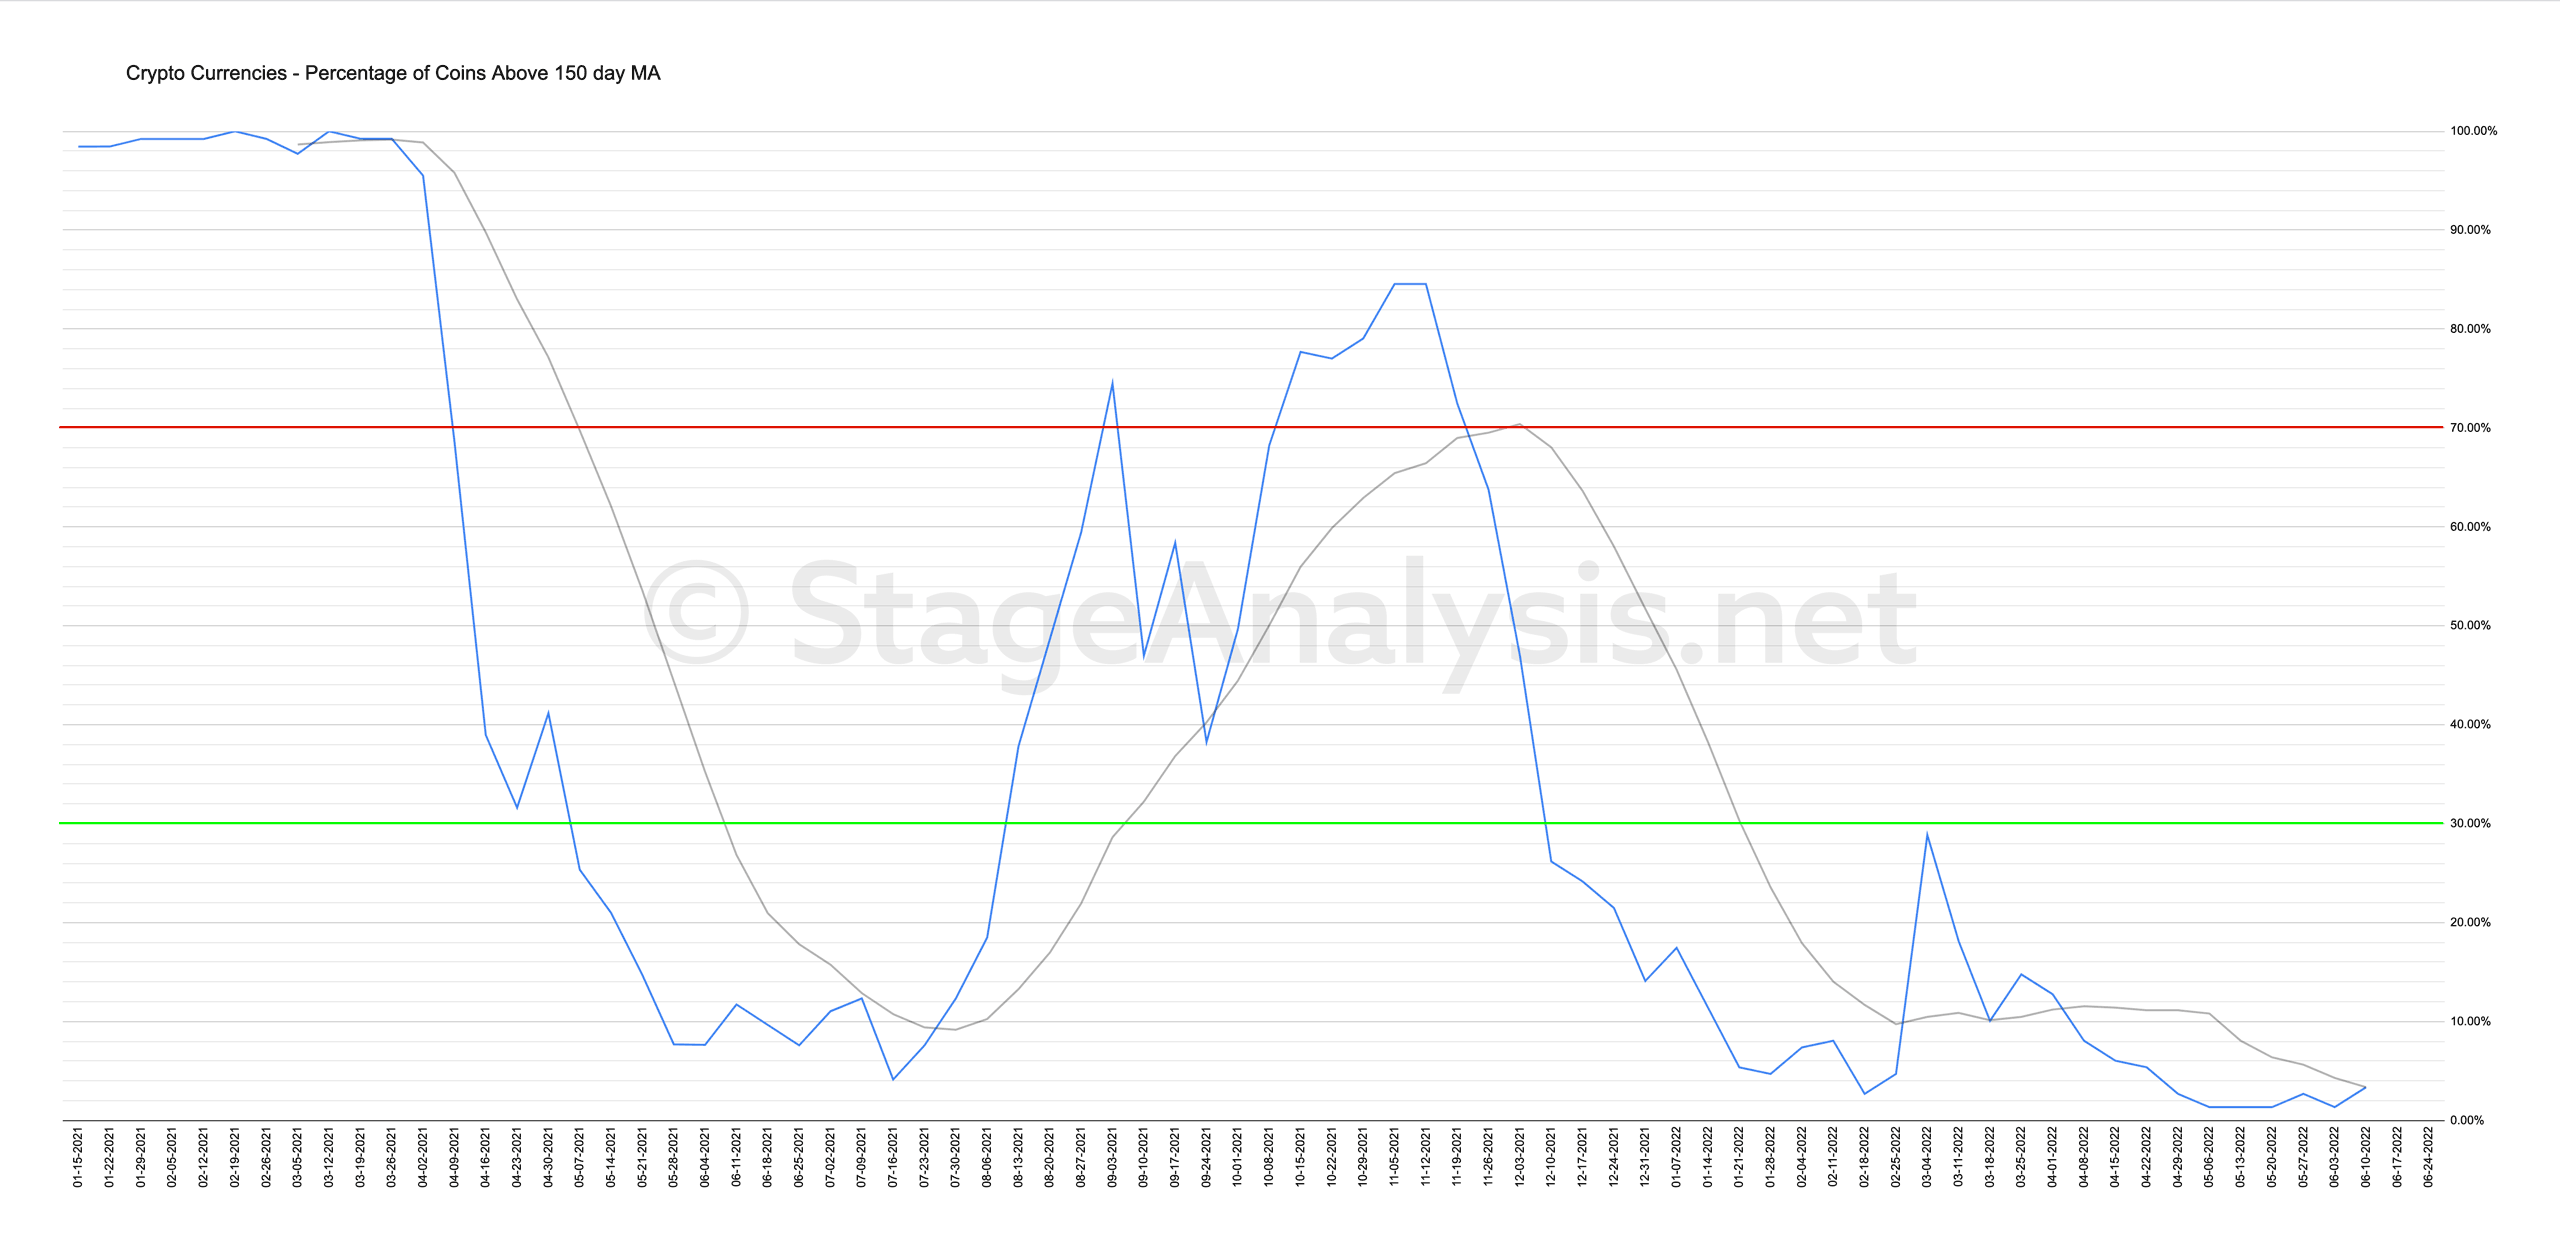
% Above 150 day MA: 3.36% (+2.01%)
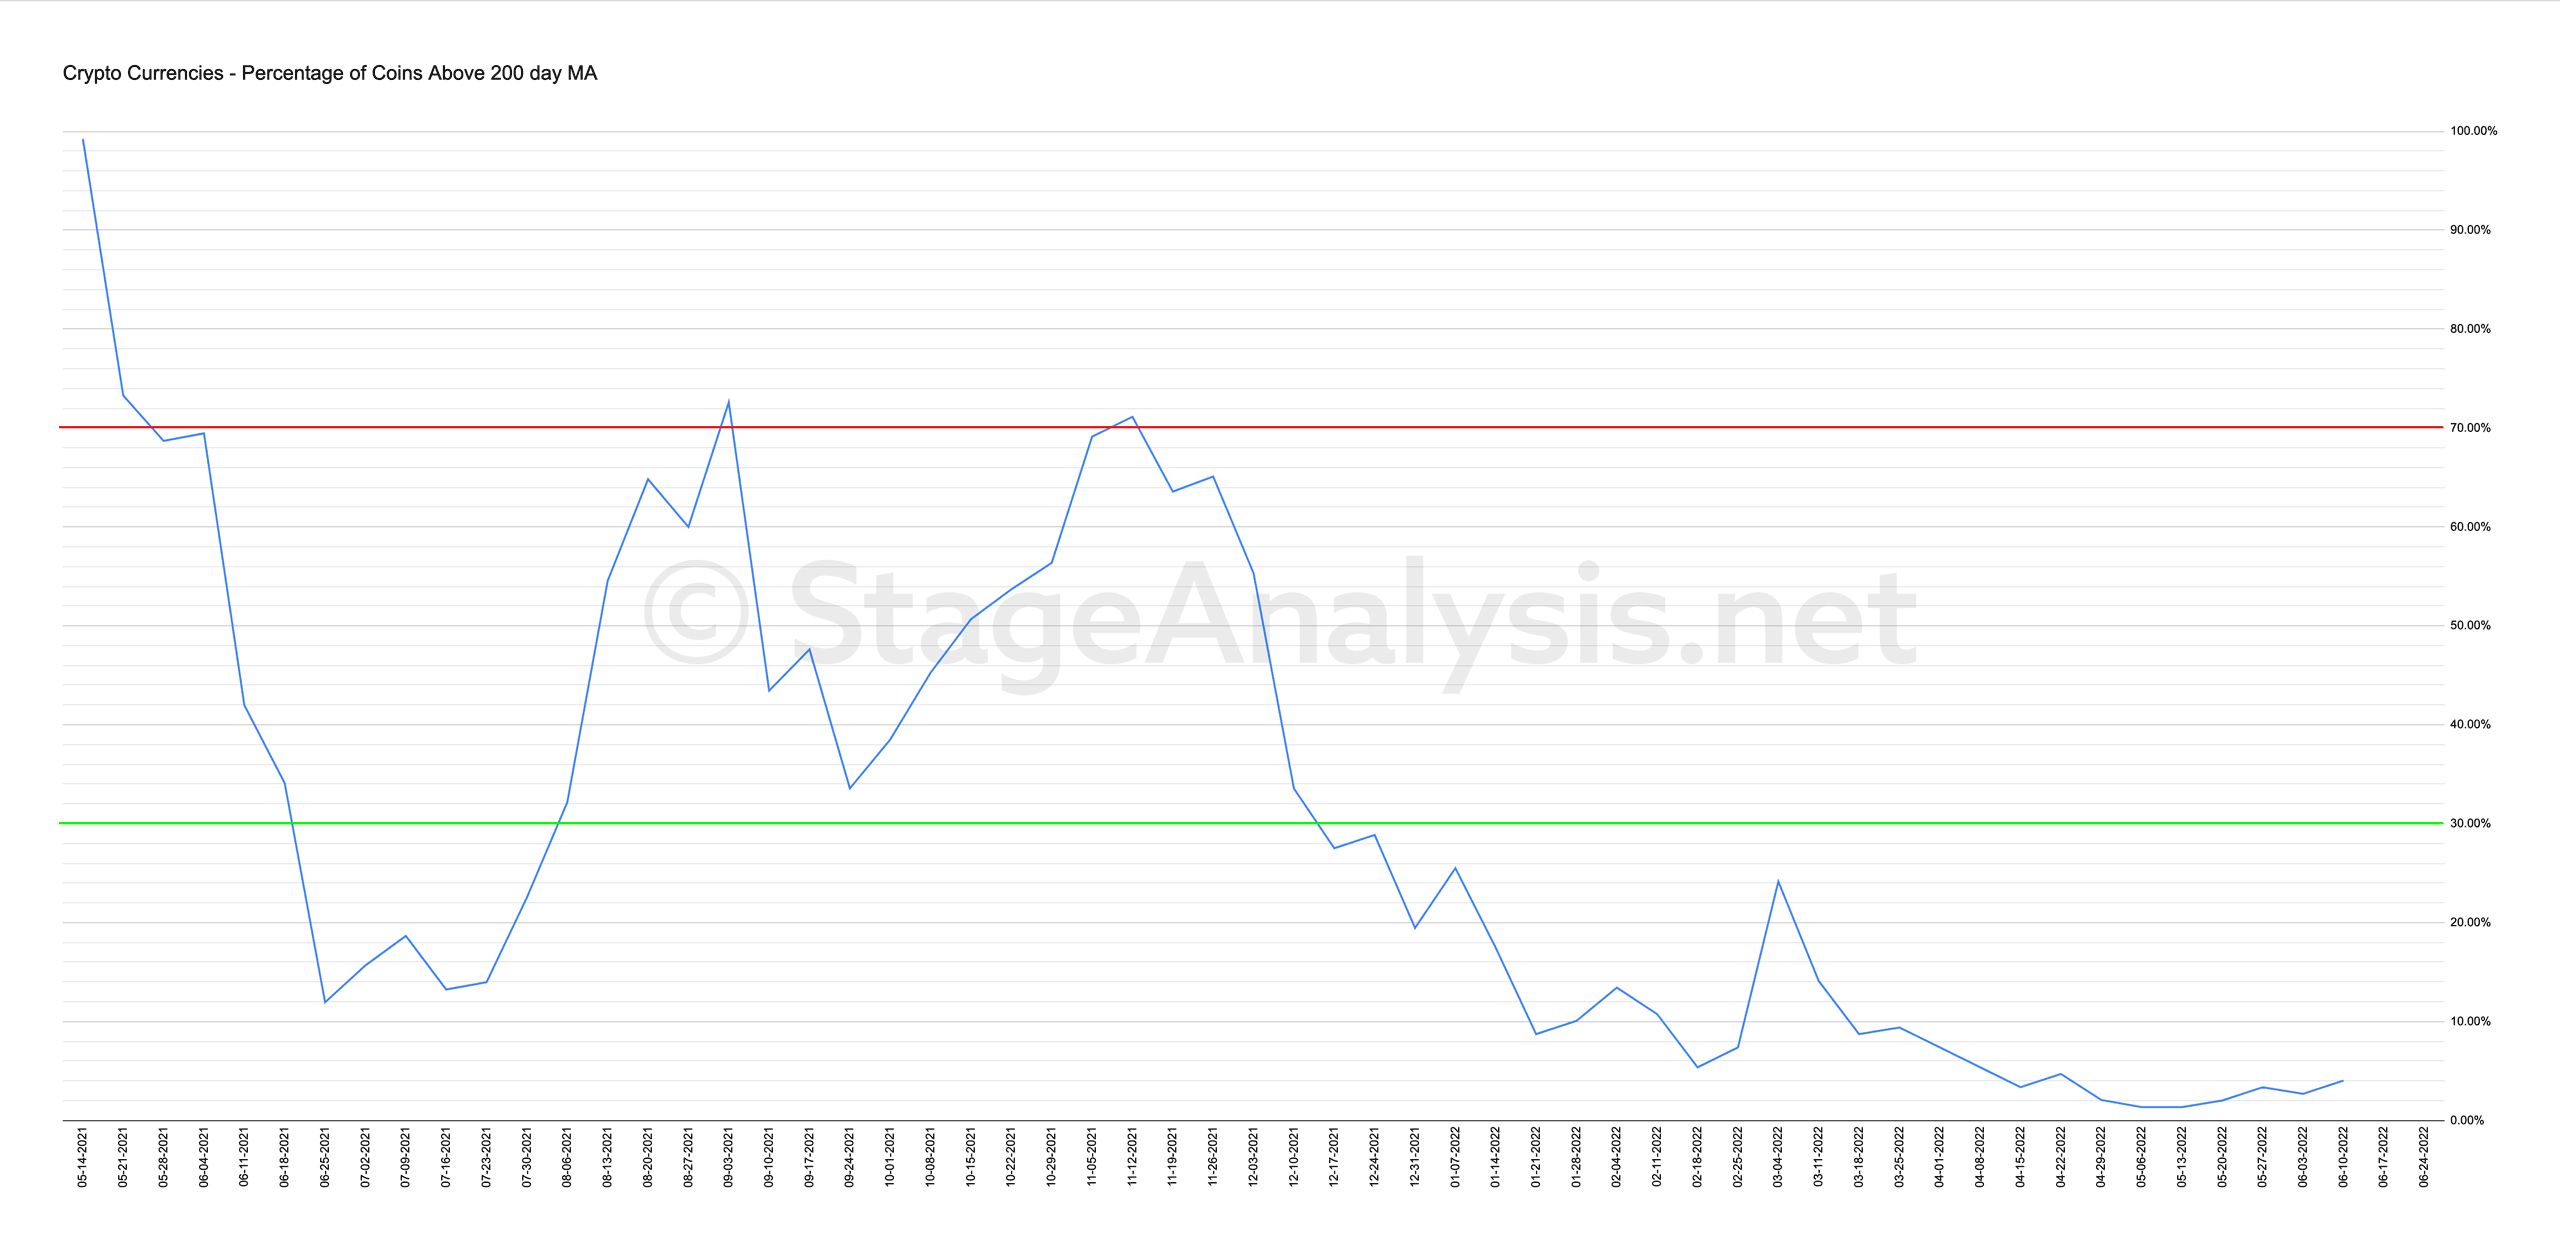
% Above 200 day MA: 4.03% (+1.34%)
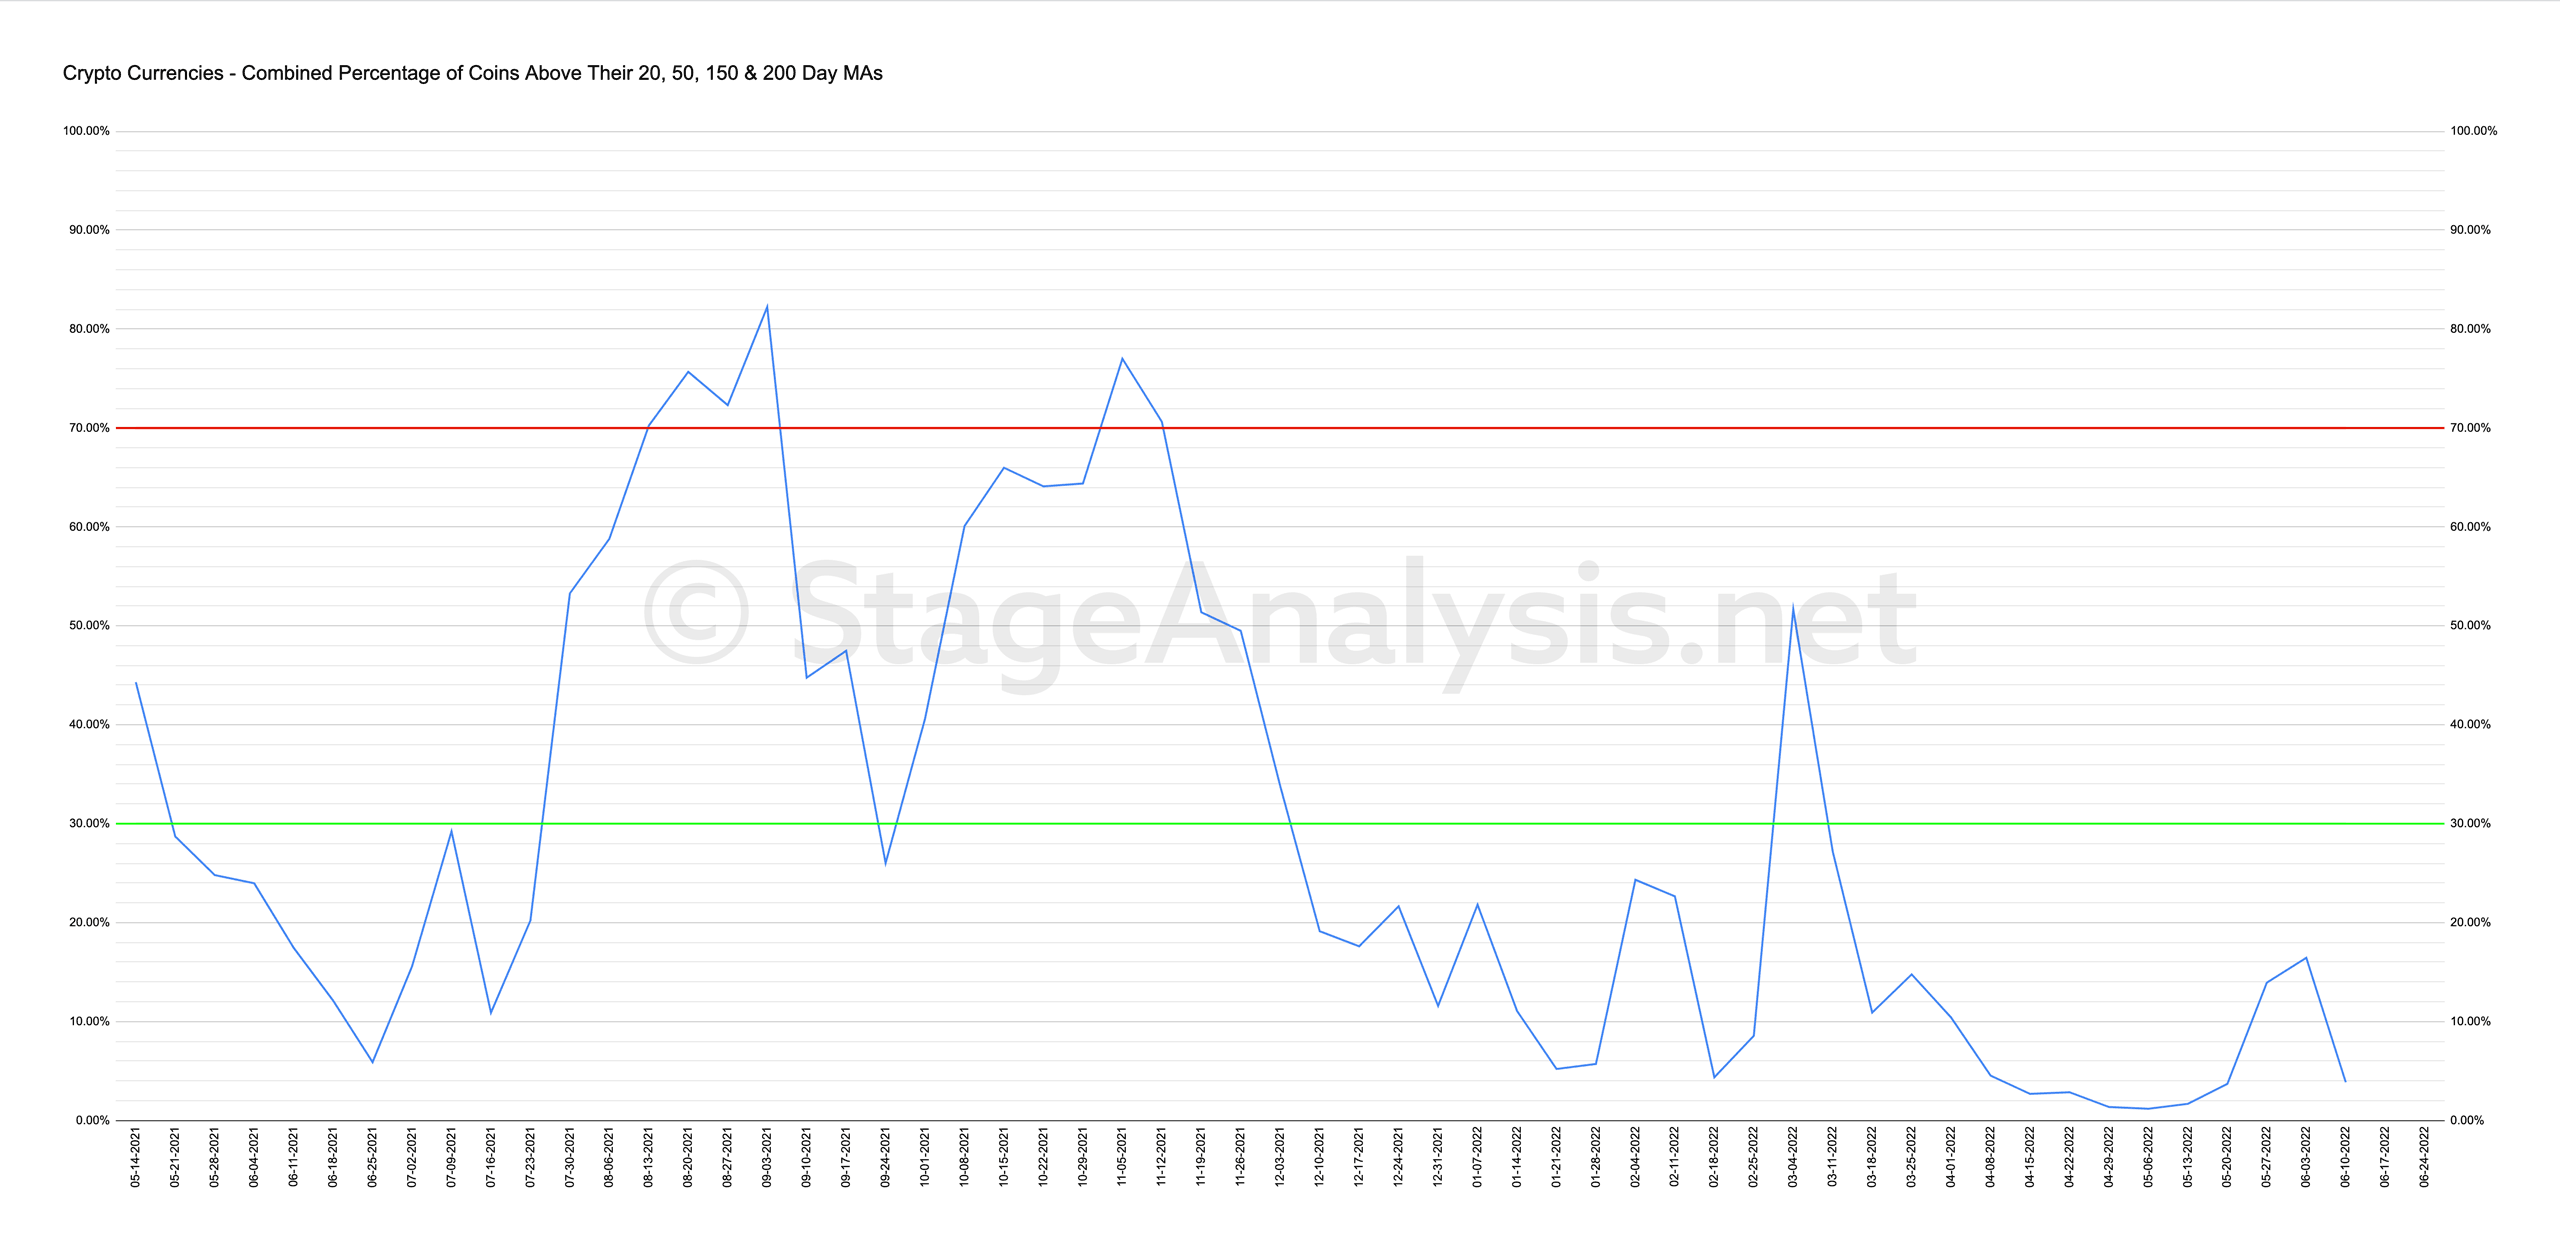
Average: 4.70% (-12.08% 1wk)
It's been a long time since I've posted the Crypto Coin breadth charts that cover the 149 crypto coins that stockcharts shows. But that's mainly because there's been very little change and they remain at the extreme lower end of the range, with only 4.70% of the crypto coins currently above their short, medium and long term MAs combined.
There was a brief spike in March when Bitcoin attempted to break out of the base structure it had been building for a few months at the time. But was strongly rejected at the 200 day MA and resumed the downtrend and took the altcoins with it. So currently the overall average remains at the lower extremes and hence continues to be on watch for a new signal, which would be a move back through the key 30% level.
Here's the individual charts
Become a Stage Analysis Member:
To see more like this – US Stocks watchlist posts, detailed videos each weekend, use our unique Stage Analysis tools, such as the US Stocks & ETFs Screener, Charts, Market Breadth, Group Relative Strength and more...
Join Today
Disclaimer: For educational purpose only. Not investment advice. Seek professional advice from a financial advisor before making any investing decisions.