The Stage Analysis members video discussing the latest US Watchlist Stocks in detail on multiple timeframes, Stage 2 Breakout attempts, Stages Summary, the Sector breadth and Sub-industries Bell Curves, Relative Strength Rankings, the key Market Breadth Charts to determine the Weight of Evidence, Bitcoin & Ethereum, the Major US Stock Market Indexes and ETF Summary. Plus a continued look at the upcoming new UK version of the Stage Analysis Screener.
Read More

Blog

09 November, 2025
Stage Analysis Members Video – 9 November 2025 (1hr 8mins)

02 November, 2025
Stage Analysis Members Video – 2 November 2025 (51mins)
The Stage Analysis members video beginning with a discussion of the latest US Watchlist Stocks in detail on multiple timeframes, Stage 2 Breakout attempts, Stages Summary, the Sector breadth and Sub-industries Bell Curves, Relative Strength Rankings, the key Market Breadth Charts to determine the Weight of Evidence, Bitcoin & Ethereum, the Major US Stock Market Indexes and ETF Summary. Plus a further look at the upcoming new UK version of the Stage Analysis Screener.
Read More
26 October, 2025
Stage Analysis Members Video – 26 October 2025 (42mins)
The Stage Analysis members video discussing of the latest US Watchlist Stocks in detail on multiple timeframes, Stage 2 Breakout attempts, Stages Summary, the Sector breadth and Sub-industries Bell Curves, Relative Strength Rankings, the key Market Breadth Charts to determine the Weight of Evidence, Bitcoin & Ethereum, the Major US Stock Market Indexes and ETF Summary. Plus a look at the upcoming new UK version of the Stage Analysis Screener.
Read More
19 October, 2025
Stage Analysis Members Video – 19 October 2025 (1hr 7mins)
The Stage Analysis members video beginning with a discussion of the latest US Watchlist Stocks in detail on multiple timeframes, Stage 2 Breakout attempts, Stages Summary, the Sector breadth and Sub-industries Bell Curves, Relative Strength Rankings, the key Market Breadth Charts to determine the Weight of Evidence, Bitcoin & Ethereum, the Major US Stock Market Indexes and ETF Summary.
Read More
12 October, 2025
Stage Analysis Members Video – 12 October 2025 (59mins)
The Stage Analysis members video discussing the Major US Stock Market Indexes on multiple timeframes, Breakouts and Breakdowns, Stages Summary, the Sector breadth and Sub-industries Bell Curves, Relative Strength Rankings, the key Market Breadth Charts to determine the Weight of Evidence, Bitcoin & Ethereum and ETF Summary.
Read More
05 October, 2025
Stage Analysis Members Video – 5 October 2025 (47mins)
The Stage Analysis members video beginning with a discussion of the latest US Watchlist Stocks in detail on multiple timeframes, Stage 2 Breakout attempts, Stages Summary, the Sector breadth and Sub-industries Bell Curves, Relative Strength Rankings, the key Market Breadth Charts to determine the Weight of Evidence, Bitcoin & Ethereum, the Major US Stock Market Indexes and ETF Summary.
Read More
28 September, 2025
Stage Analysis Members Video – 28 September 2025 (1hr 4mins)
The Stage Analysis members video discussing the latest US Watchlist Stocks in detail on multiple timeframes, then the Stage 2 Breakout attempts, Stages Summary, the Sector breadth and Sub-industries Bell Curves, Relative Strength Rankings, the key Market Breadth Charts to determine the Weight of Evidence, the Major US Stock Market Indexes and ETF Summary.
Read More
23 September, 2025
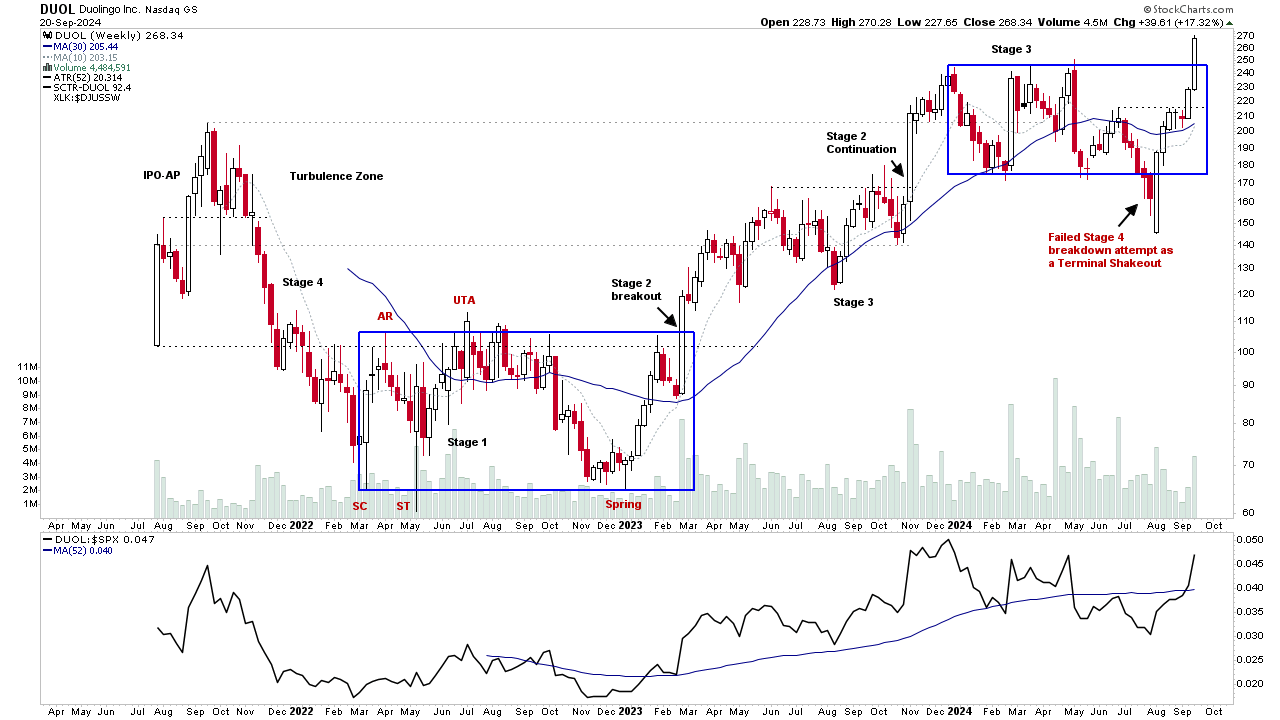
Learn Stage Analysis: DUOL – IPO to Late 2024
Detailed video walkthrough of the four Stages via the real world example of Duolingo (DUOL) from it's IPO in 2021 to late 2024 when it made a further Stage 2 continuation breakout to new all time highs at the time for the stock...
Read More
21 September, 2025
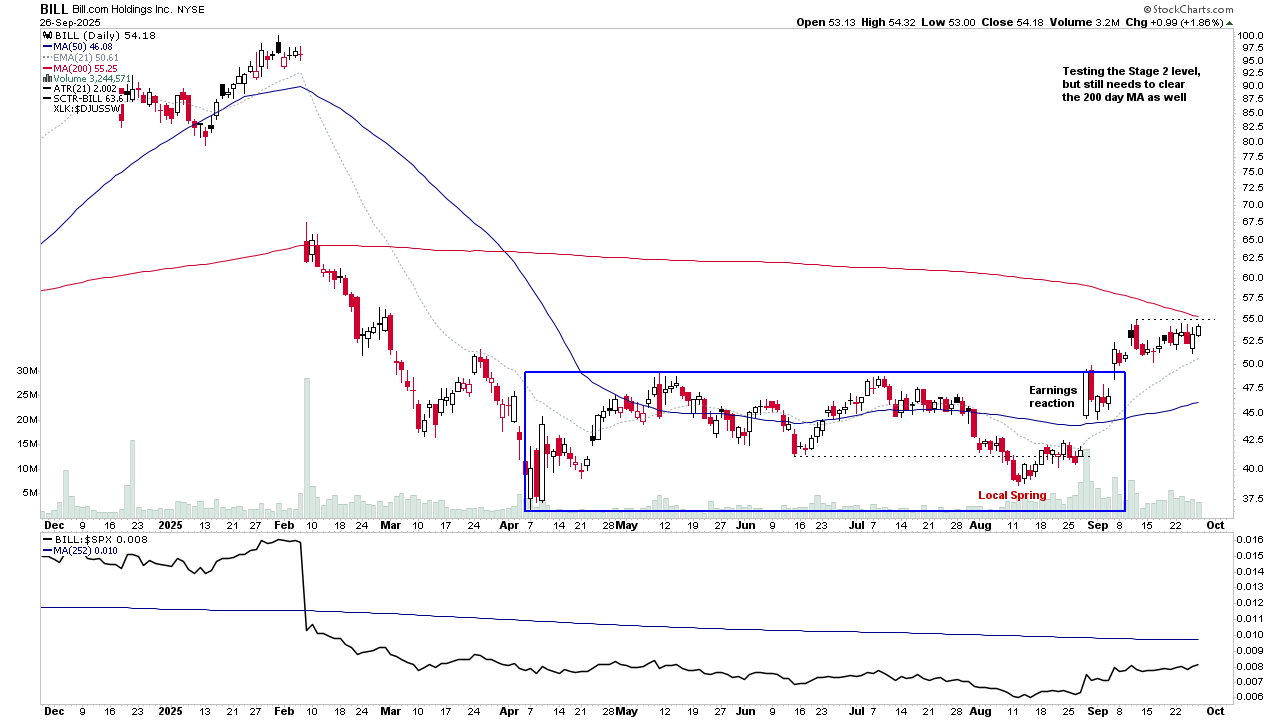
Stage Analysis Members Video – 21 September 2025 (53mins)
The Stage Analysis members video begins by discussing the latest US Watchlist Stocks in detail on multiple timeframes, then the Stage 2 Breakout attempts, Stages Summary, the Sector breadth and Sub-industries Bell Curves, Relative Strength Rankings, the key Market Breadth Charts to determine the Weight of Evidence, Bitcoin & Ethereum, the Major US Stock Market Indexes and ETF Summary.
Read More
07 September, 2025
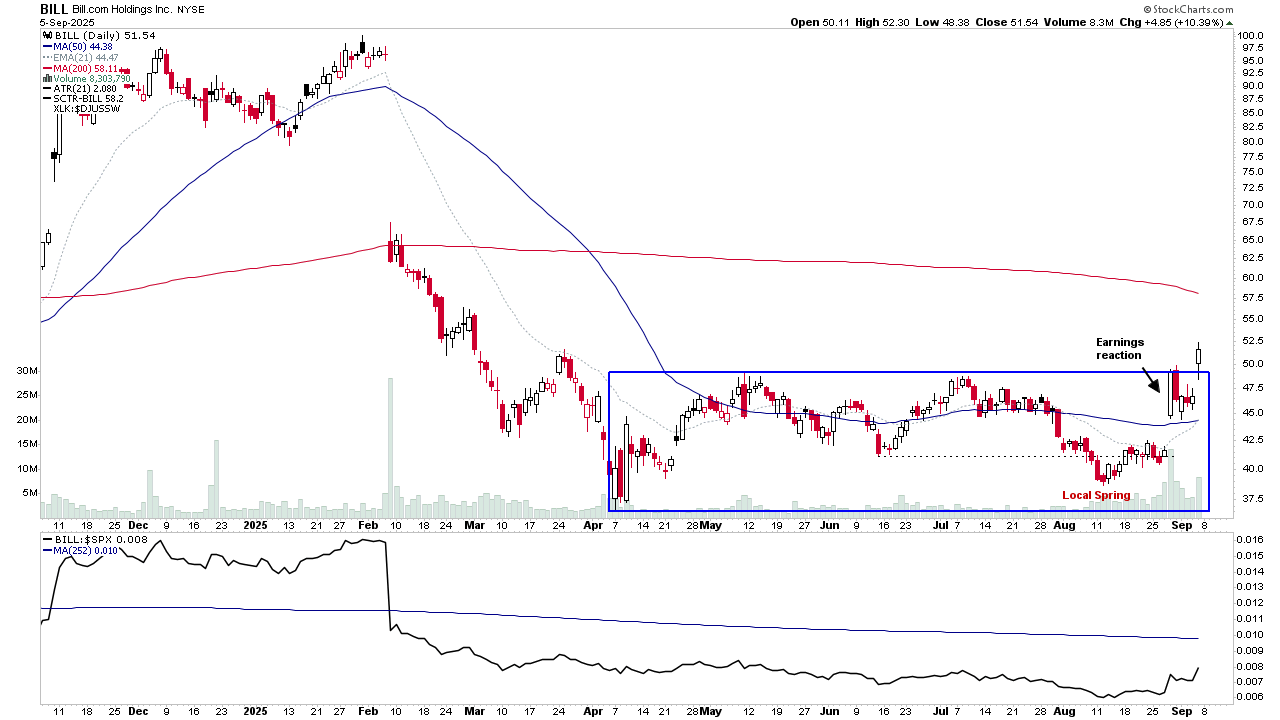
Stage Analysis Members Video – 7 September 2025 (1hr 13mins)
The Stage Analysis members video beginning by discussing the latest US Watchlist Stocks in detail on multiple timeframes, a look at new features in the Stage Analysis Screener, Stage 2 Breakout attempts, Stages Summary, the Sector breadth and Sub-industries Bell Curves, Relative Strength Rankings, the key Market Breadth Charts to determine the Weight of Evidence, Bitcoin & Ethereum, the Major US Stock Market Indexes and ETF Summary.
Read More