There were 23 stocks highlighted from the US stocks watchlist scans today...
Read More

Blog
06 December, 2023
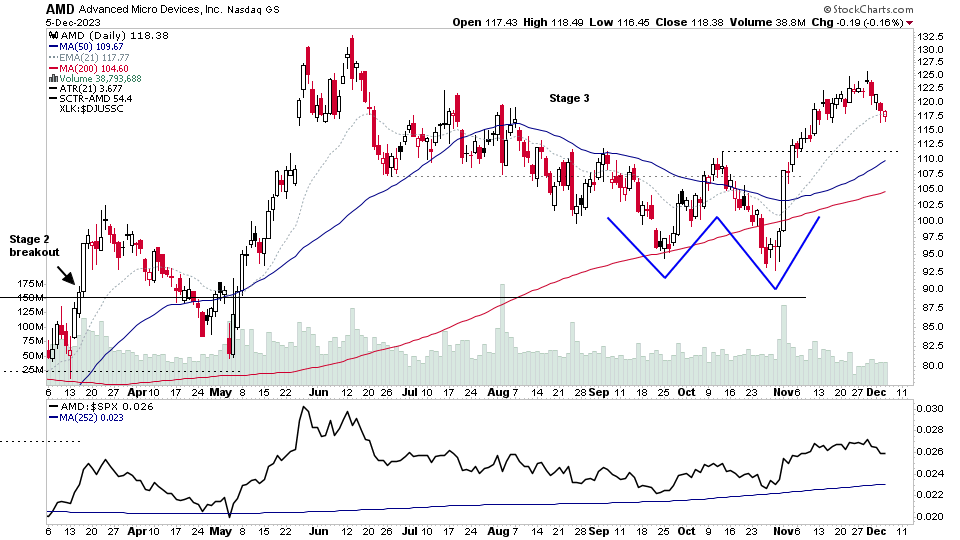
US Stocks Watchlist – 5 December 2023
04 December, 2023
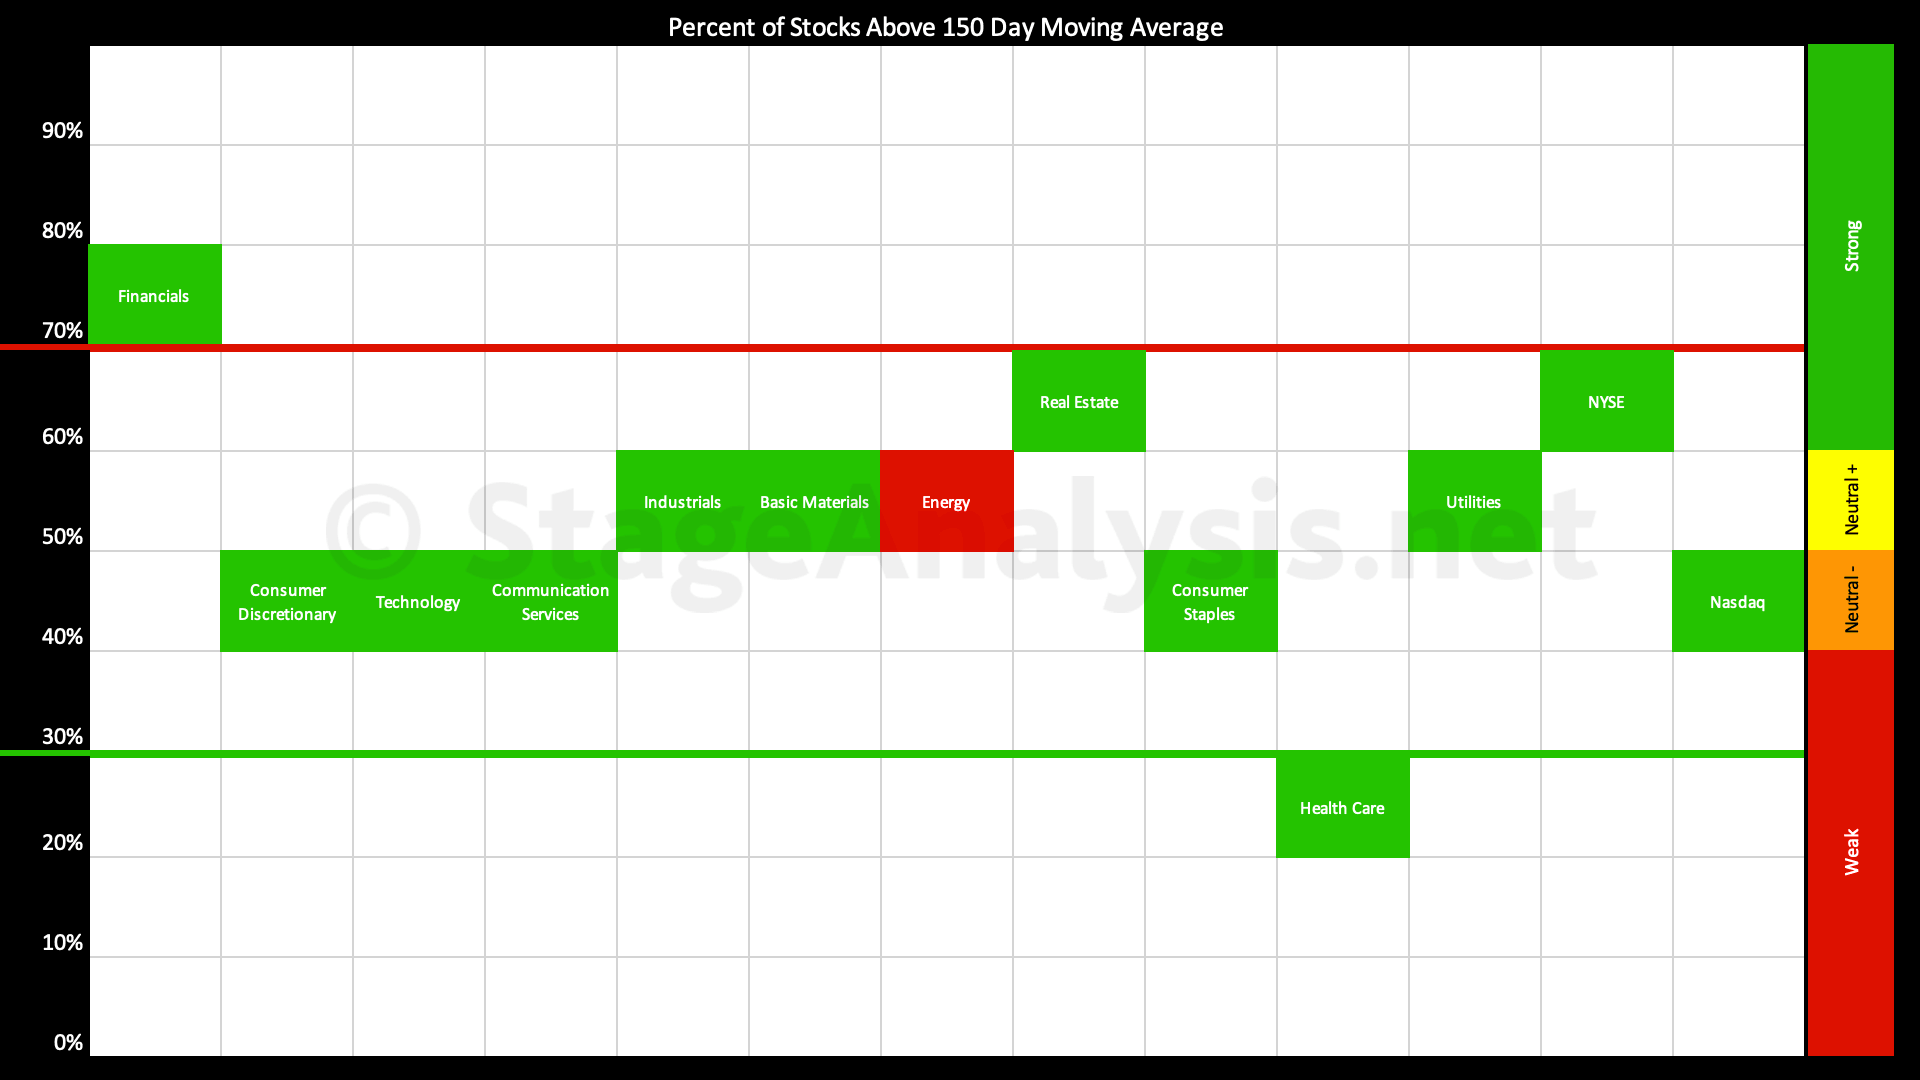
Sector Breadth: Percentage of US Stocks Above Their 150 day (30 Week) Moving Averages
The percentage of US stocks above their 150 day moving averages in the 11 major sectors increased by +9.41% since the previous post on the 20th November 2023, moving the overall average into the middle of the chart at 51.65%, which is a very neutral position.
Read More
03 December, 2023
Stage Analysis Members Video – 3 December 2023 (1hr 18mins)
Stage Analysis members weekend video beginning with a discussion of some of strongest moving stocks in Stage 2, followed by the regular members content on the Major US Stock Market Indexes, Industry Groups Relative Strength (RS) Rankings, IBD Industry Group Bell Curve – Bullish Percent, the key Market Breadth Charts to determine the Weight of Evidence, Bitcoin & Ethereum Update, and the US watchlist stocks in detail on multiple timeframes.
Read More
03 December, 2023
US Stocks Watchlist – 3 December 2023
There were 26 stocks highlighted from the US stocks watchlist scans today...
Read More
02 December, 2023
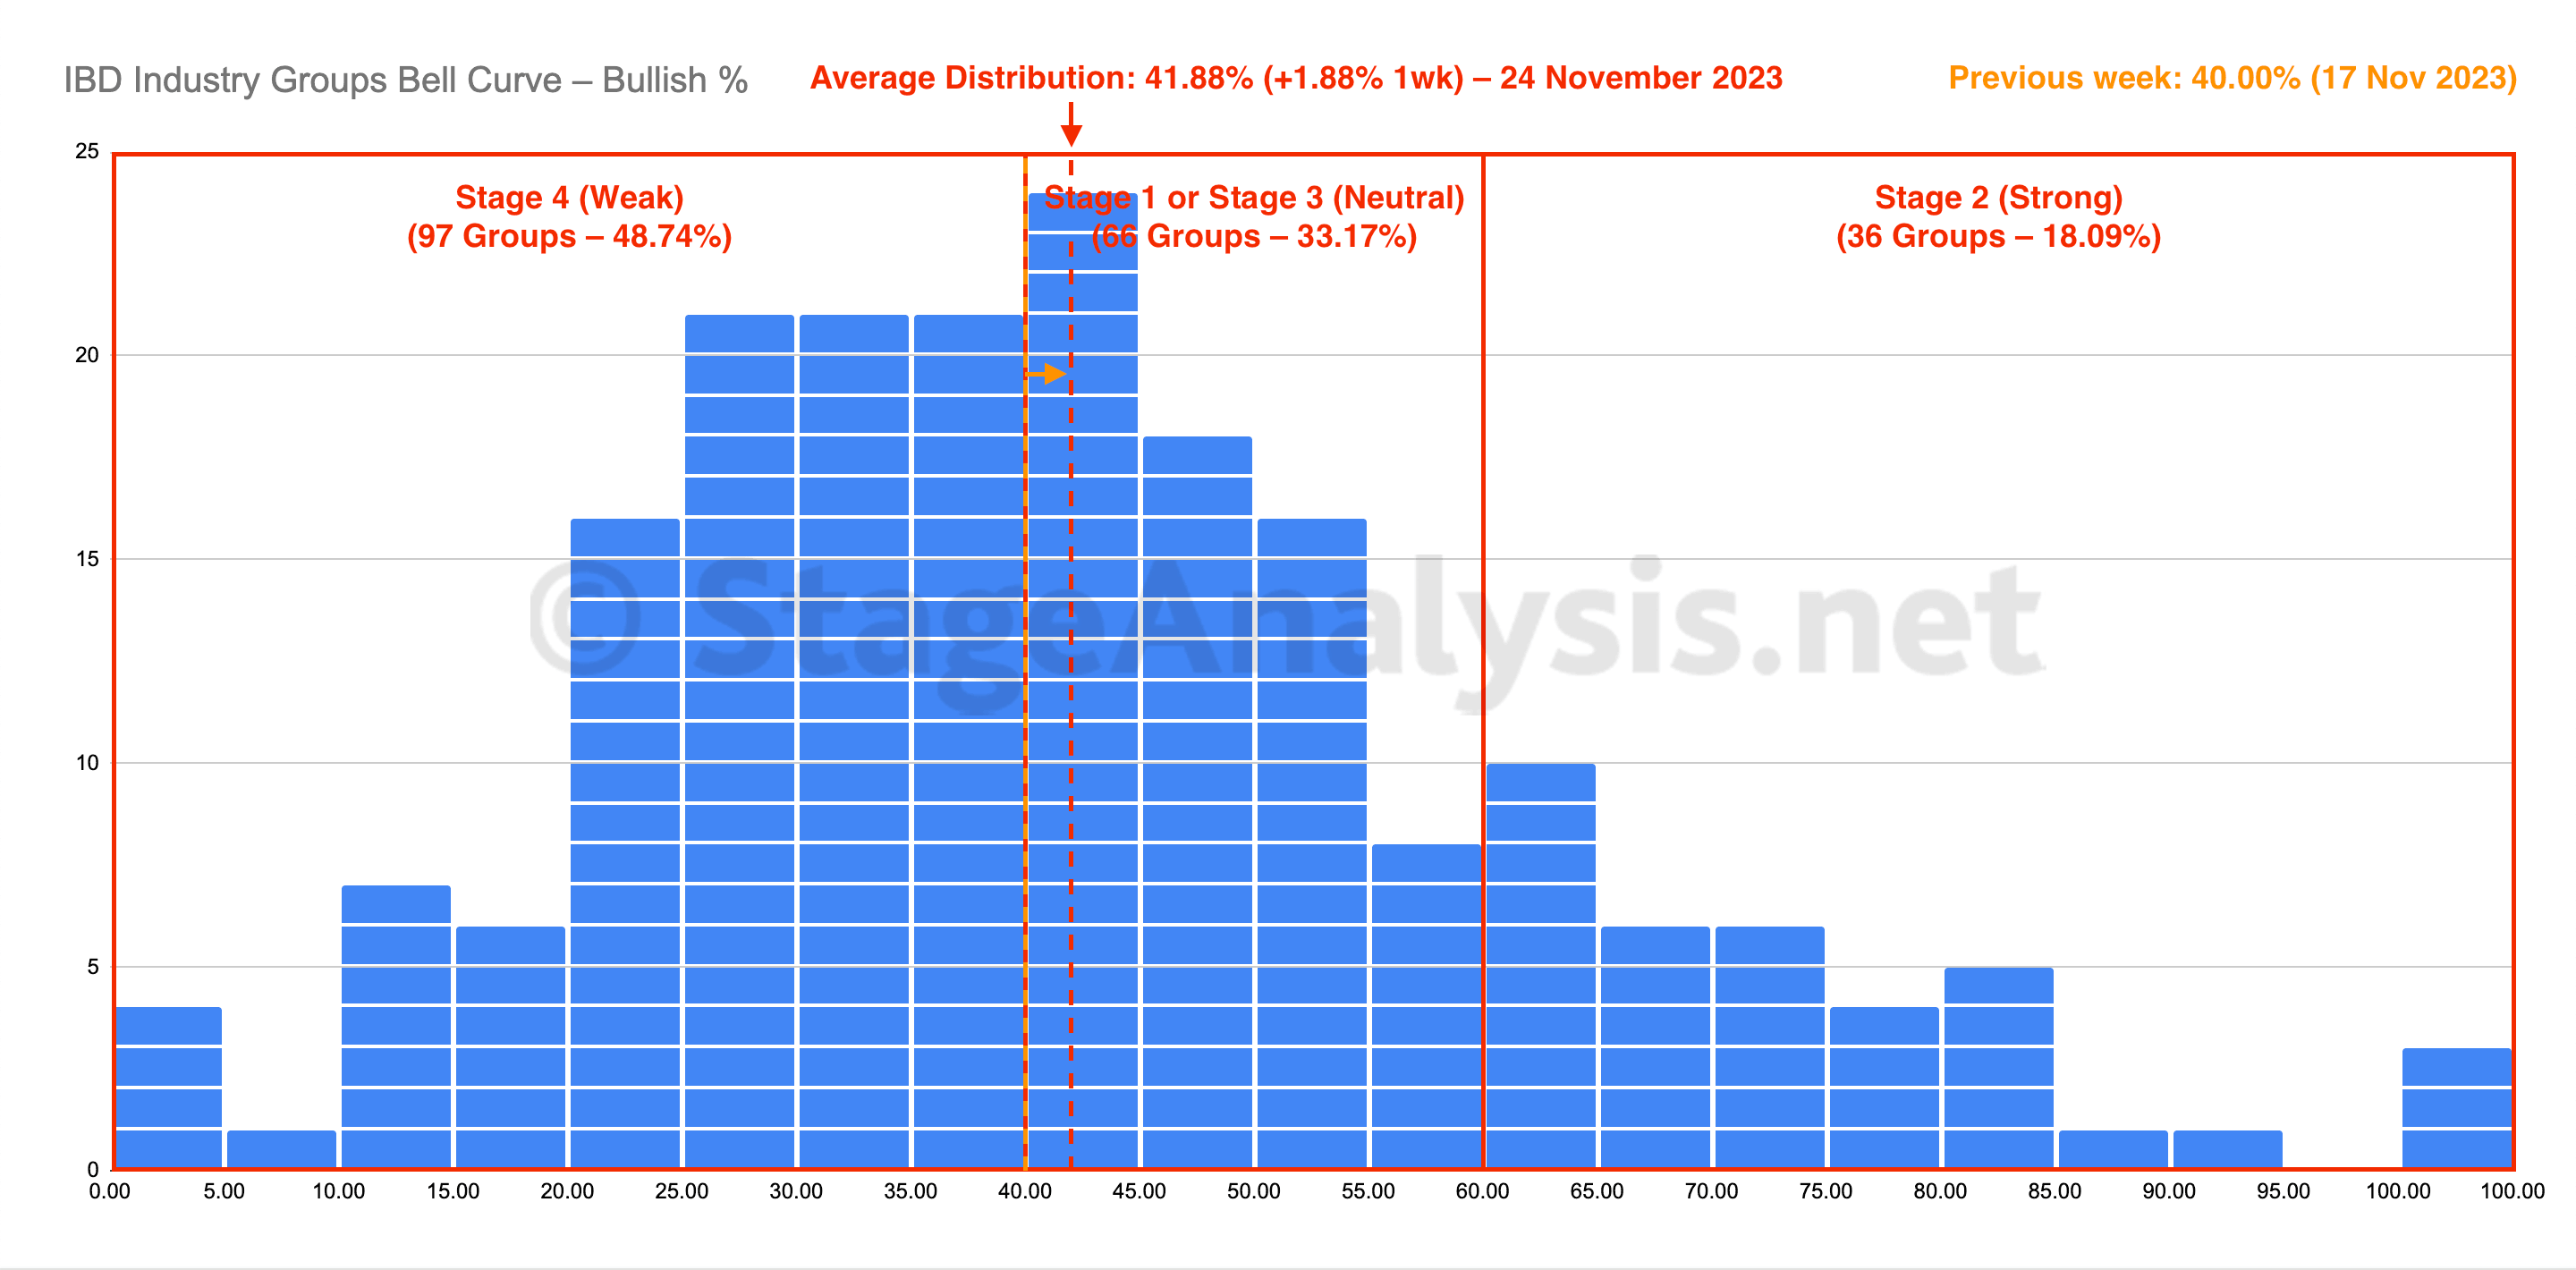
IBD Industry Groups Bell Curve – Bullish Percent
The IBD Industry Groups Bell Curve – Bullish Percent shows the few hundred industry groups plotted as a histogram chart and represents the percentage of stocks in each group that are on a point & figure (P&F) buy signal...
Read More
02 December, 2023
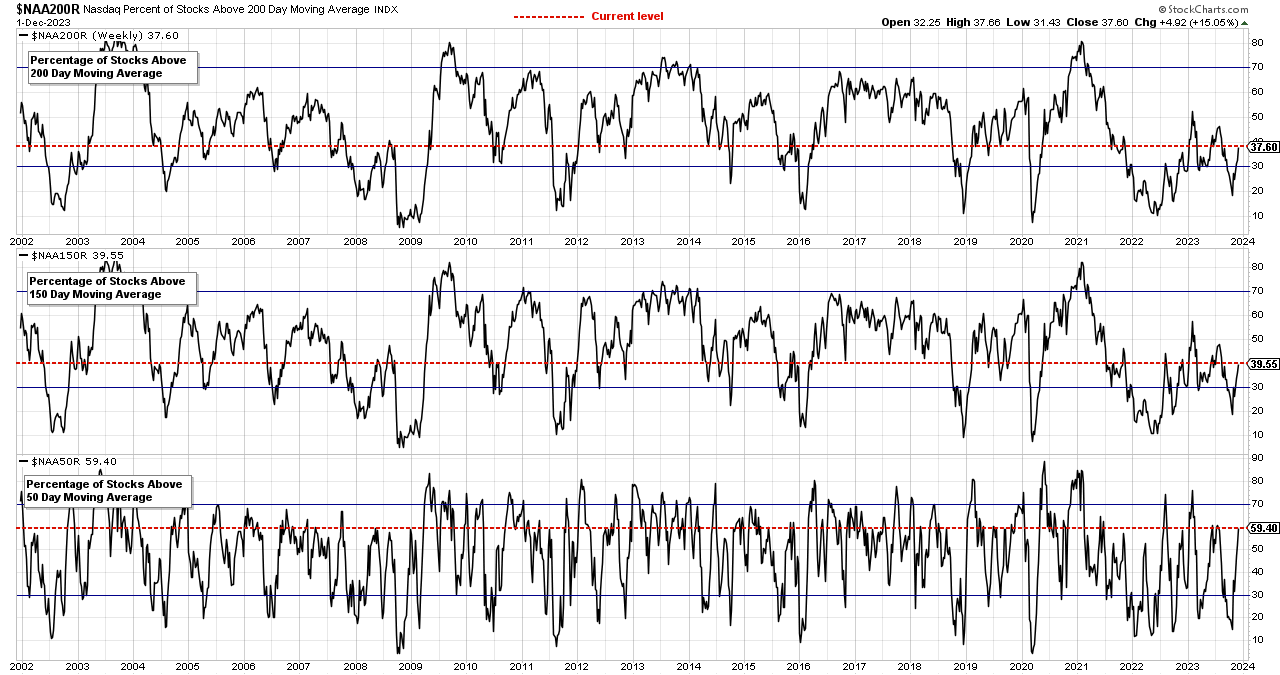
Market Breadth: Percentage of Stocks Above their 50 Day, 150 Day & 200 Day Moving Averages Combined
Custom Percentage of Stocks Above Their 50 Day, 150 Day & 200 Day Moving Averages Combined Market Breadth Charts for the Overall US Market, NYSE and Nasdaq for Market Timing and Strategy.
Read More
01 December, 2023
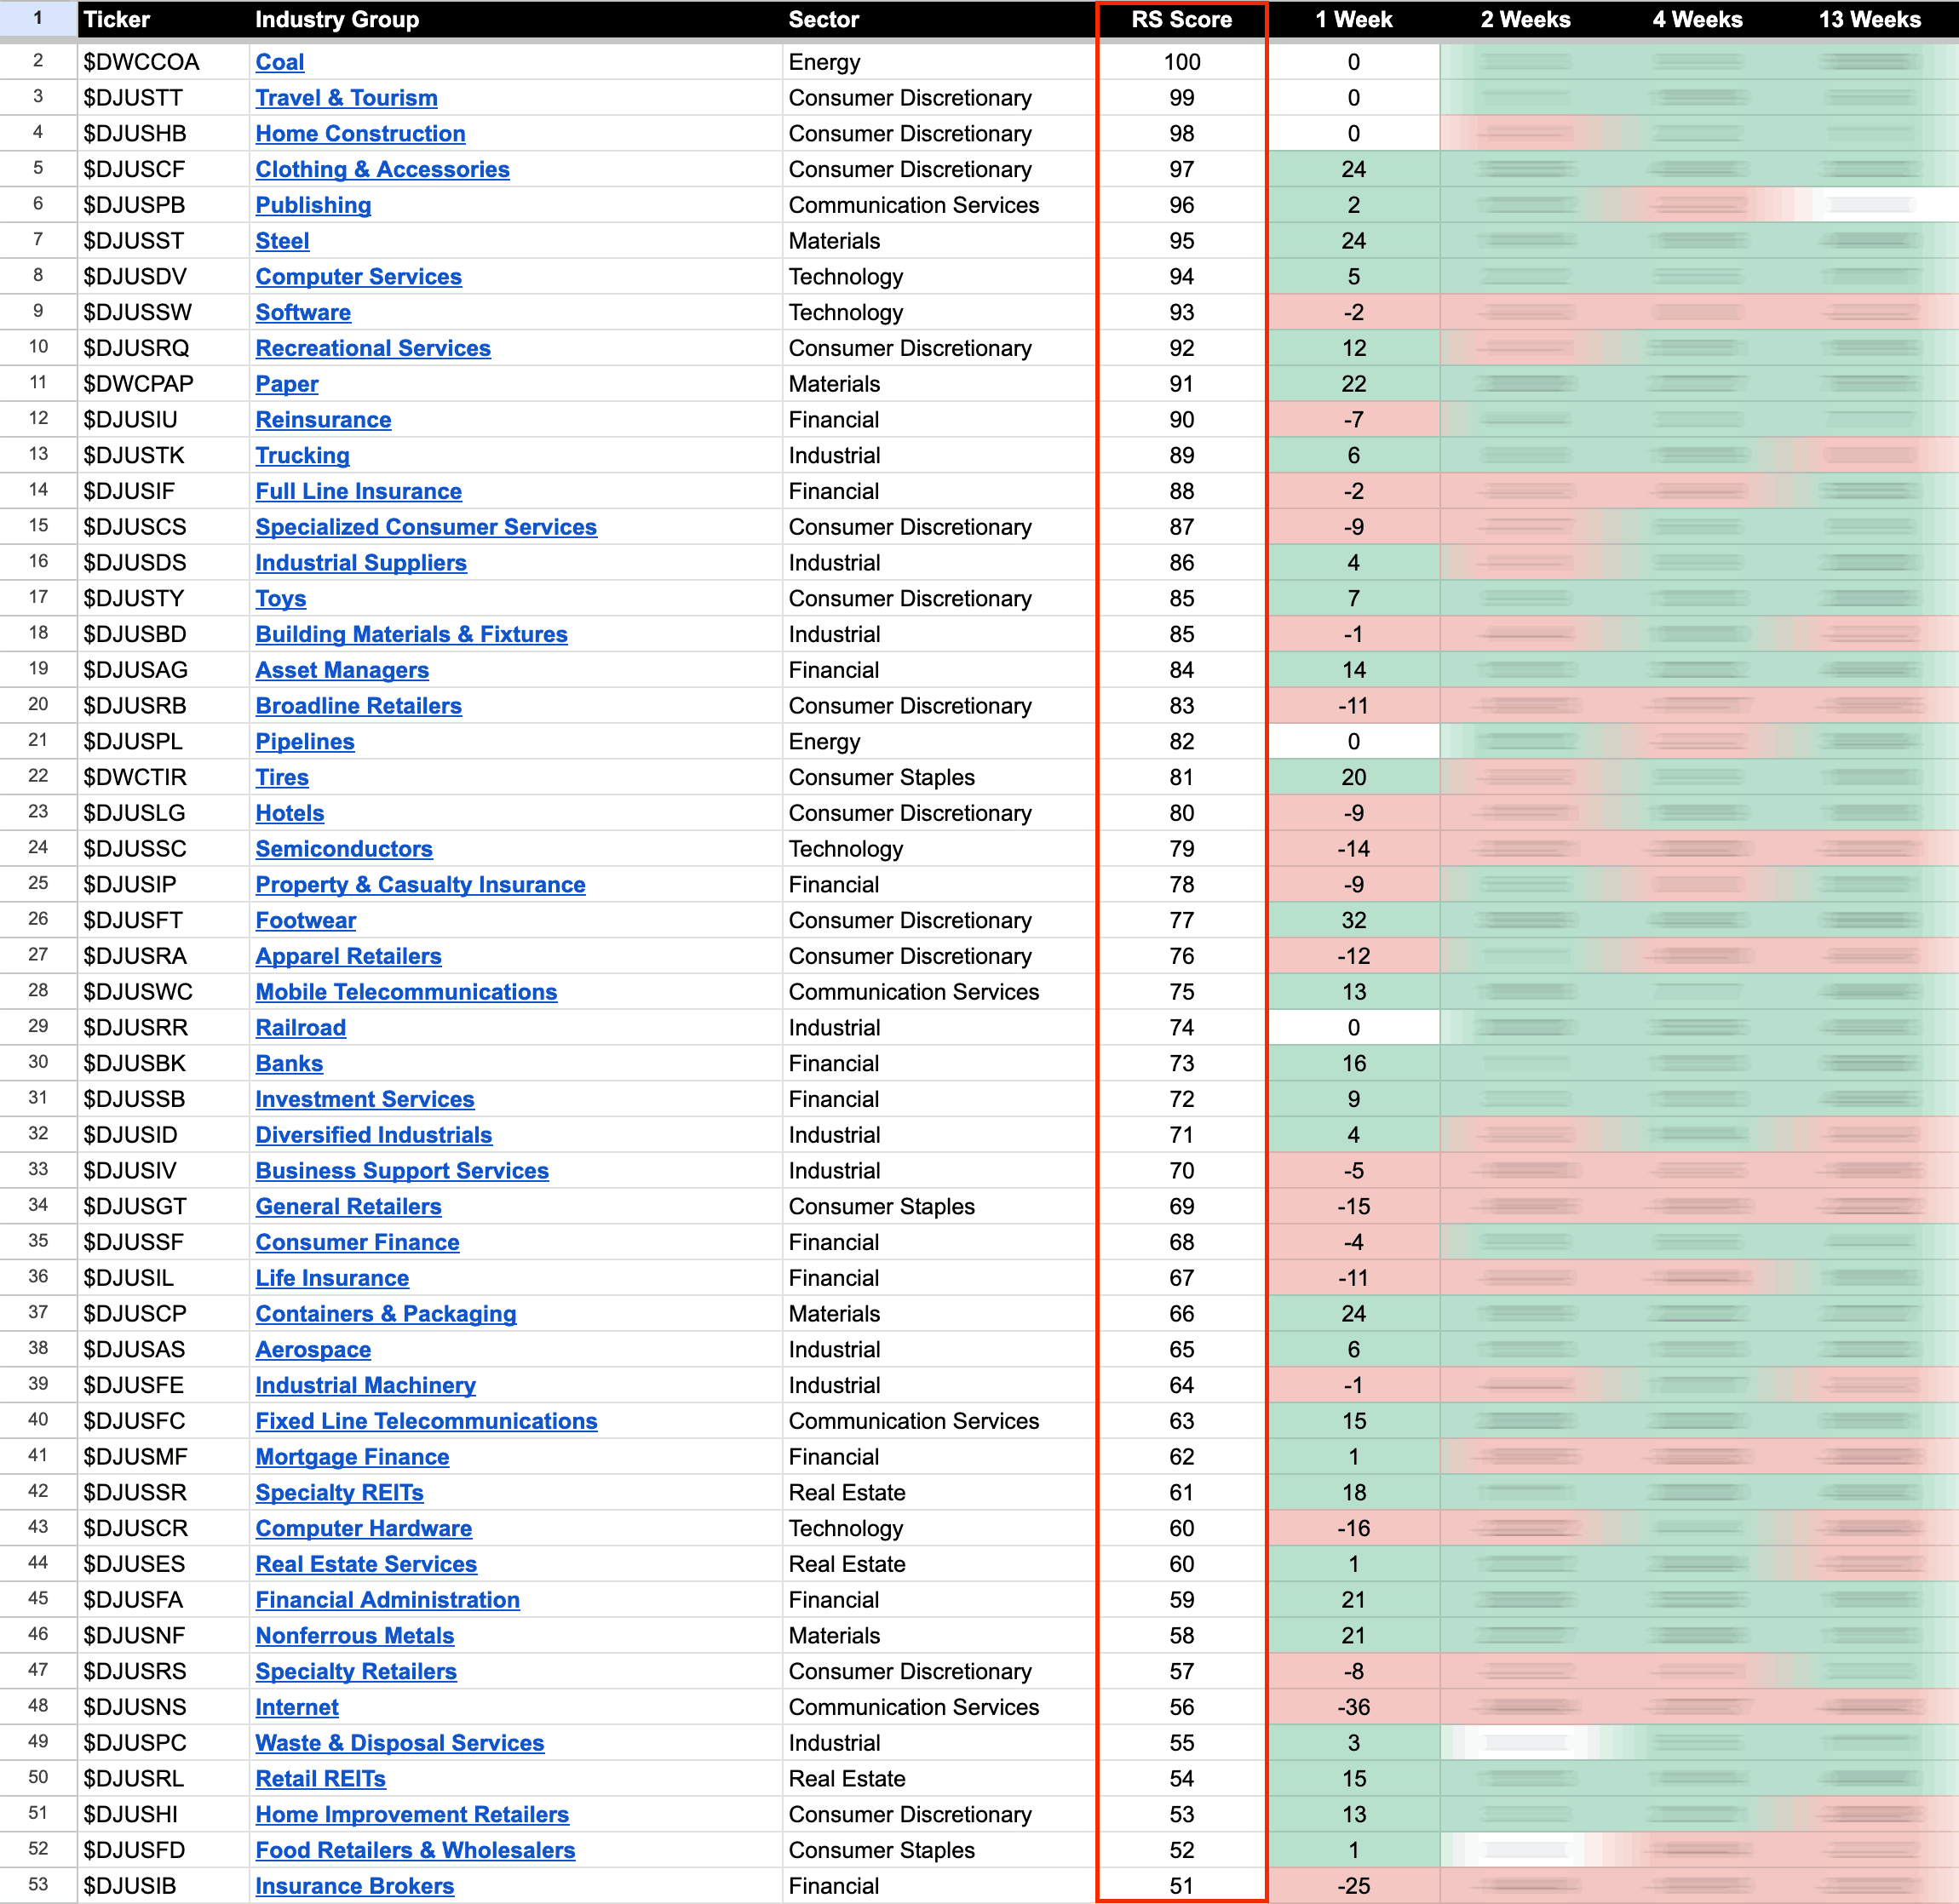
US Stocks Industry Groups Relative Strength Rankings
The purpose of the Relative Strength (RS) tables is to track the short, medium and long term RS changes of the individual groups to find the new leadership earlier than the crowd...
Read More
30 November, 2023
US Stocks Watchlist – 30 November 2023
There were 22 stocks highlighted from the US stocks watchlist scans today...
Read More
29 November, 2023
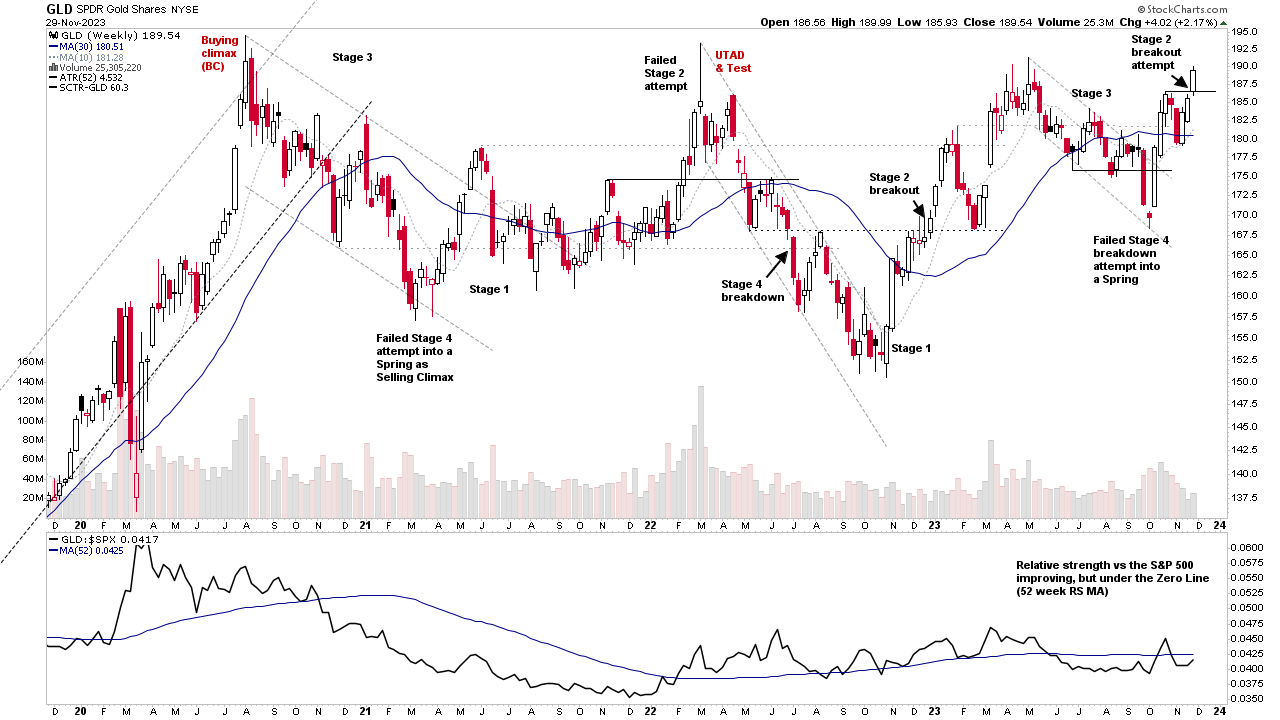
Group Focus Video: Gold & Silver Miners – 29 November 2023 (38mins)
Special group focus video discussing the Gold, Silver and the Miners as physical gold attempts to move into Stage 2 for a second time this year.
Read More
28 November, 2023
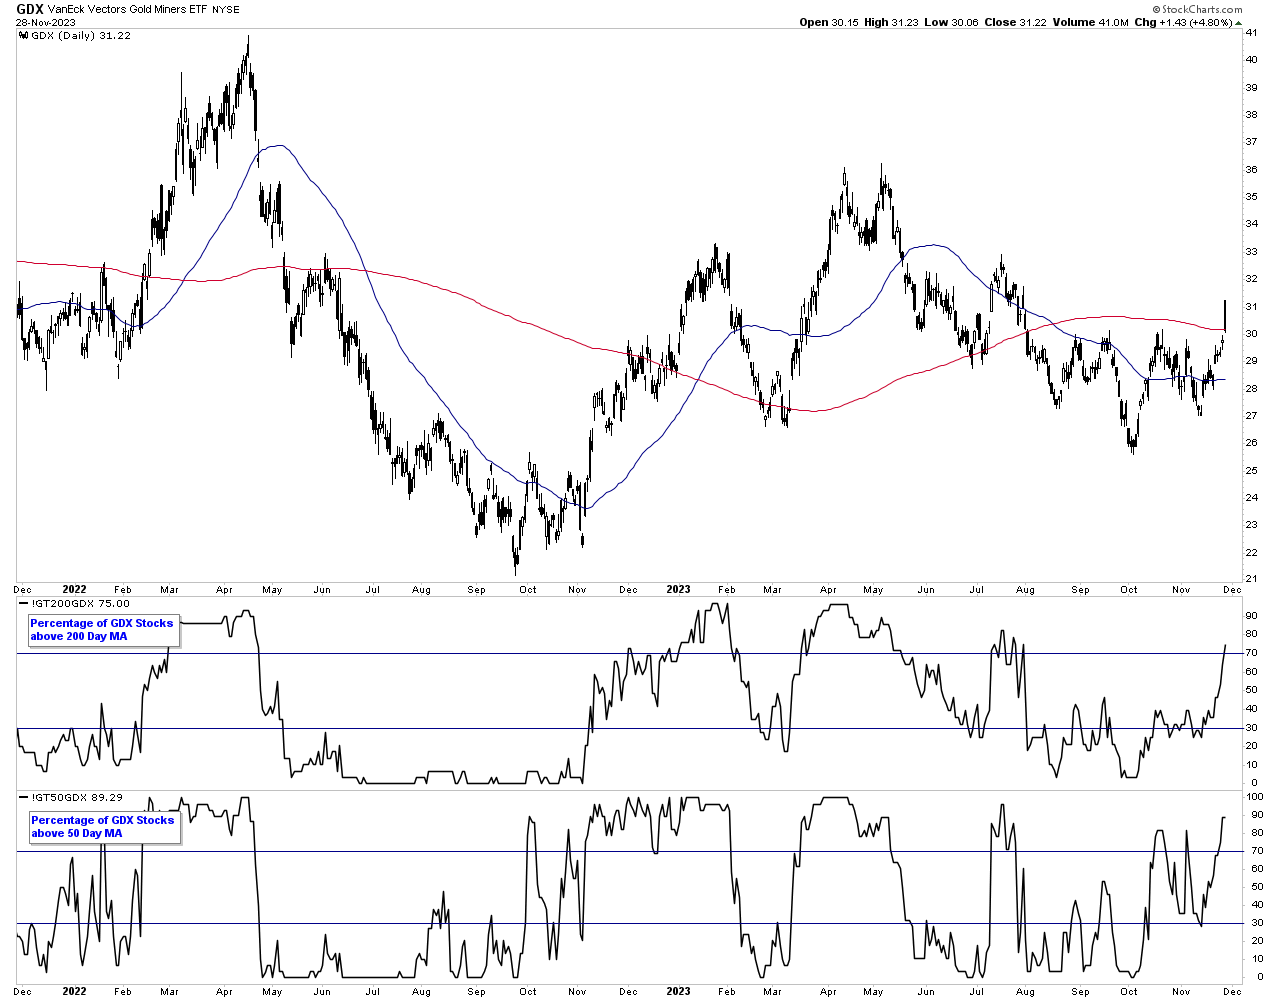
Gold Miners Breakout Attempt and the US Stocks Watchlist – 28 November 2023
The Gold miners group has been coming back into focus over the last few weeks, with a point and figure double top breakout in the IBD industry group chart (Percentage above 30 week MA) on the 16th November and strong expansion in the moving average breadth with 75% of the GDX etf stocks now above their long-term 200 day MAs...
Read More