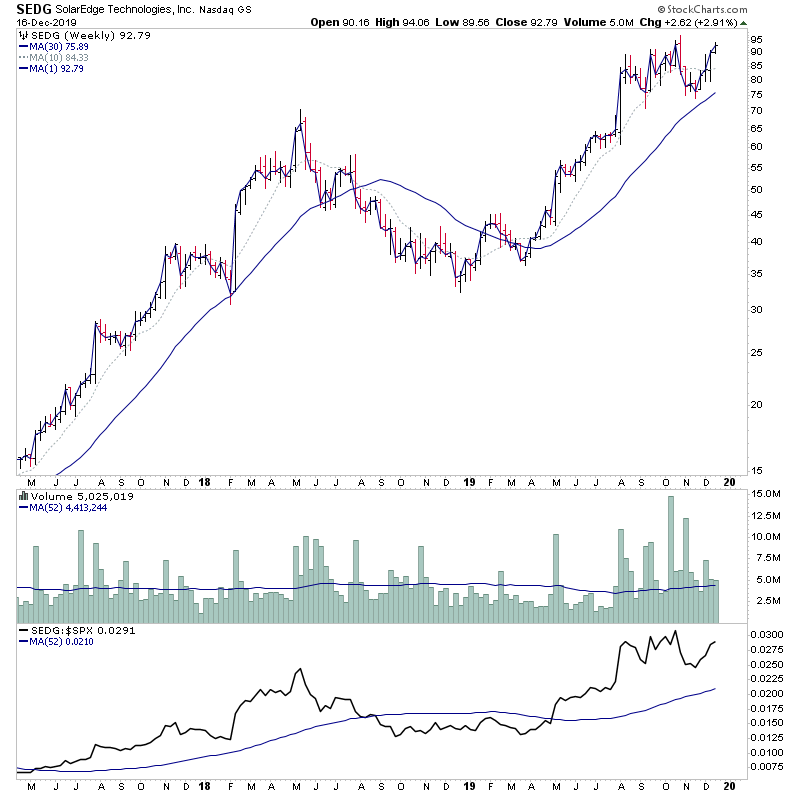
For the watchlist from Mondays scans - ARDX, CPRT, CRNC, DYA.V, HMI, LASR, MU, PERI, SEA, SEDG, SGH, TPTX, VERU
Read More

Blog
16 December, 2019
Stocks Watchlist - 16th December 2019
16 December, 2019
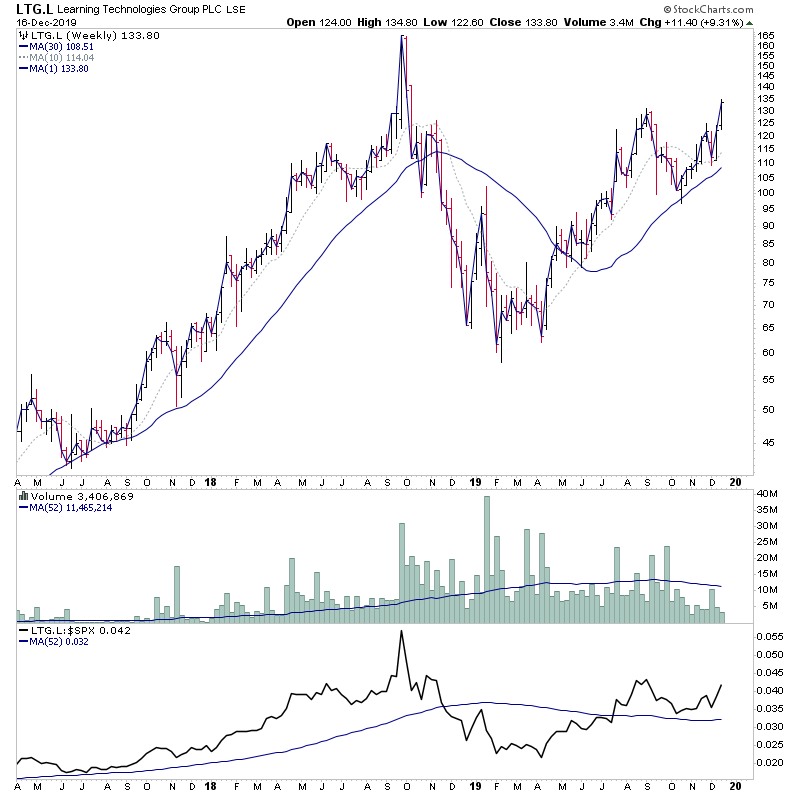
UK Stocks Watchlist - 16th December 2019
For the UK watchlist from Mondays scans - BIFF, BOWL, CCC, CHG, LTG, PHTM, YOU.L
Read More
15 December, 2019
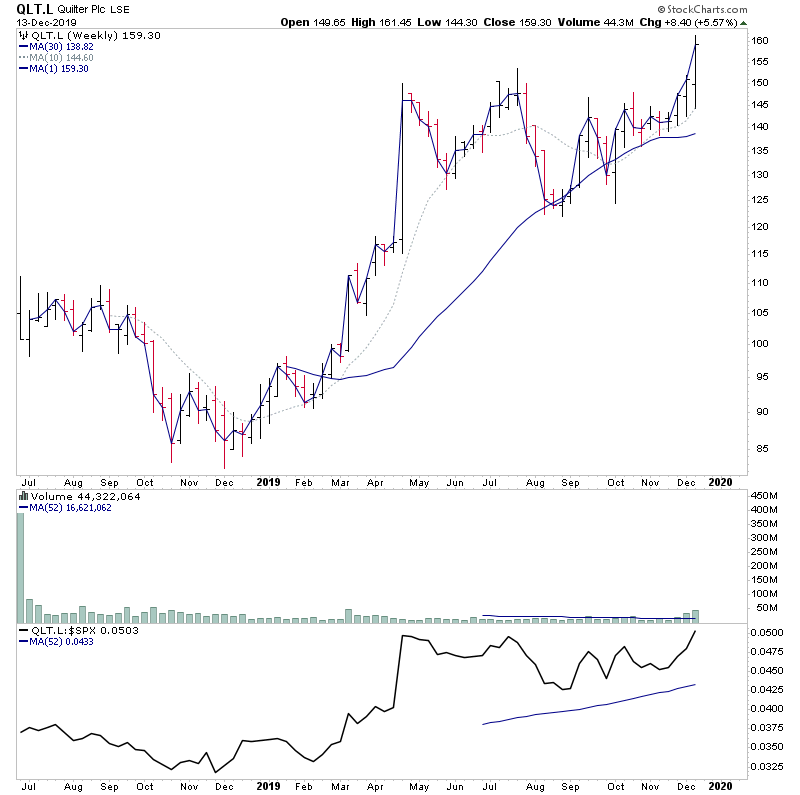
UK Stocks Watchlist - 15th December 2019 - Part 2
For the UK watchlist from the weekend scans – part 2: GOOD.L, GYM.L, HEAD.L, HYVE.L, IHP.L, INL.L, KLR.L, MARS.L, MGP.L, NG.L, NUM.L, OTB.L, QLT.L, QQ.L, RBS.L, RCH.L, SPI.L, SUMO.L, SVT.L, UU.L, WIN.L
Read More
15 December, 2019
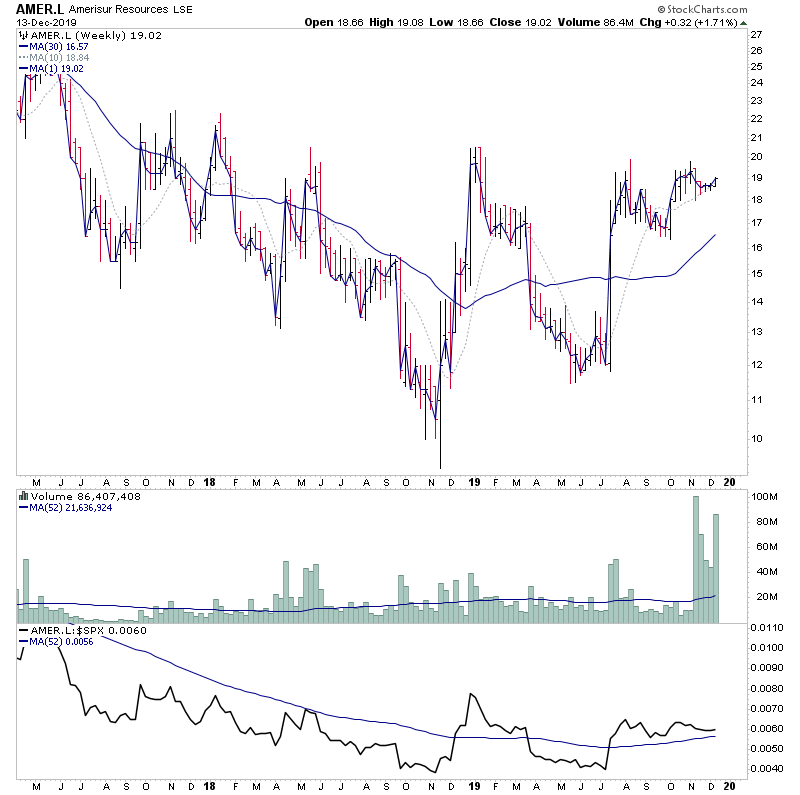
UK Stocks Watchlist - 15th December 2019 - Part 1
For the UK watchlist from the weekend scans – part 1: AIR.L, AJB.L, AMER.L, BARC.L, BDEV.L, BKG.L, BLND.L, BREE.L, BRW.L, BVS.L, BWY.L, CDM.L, COB.L, CPI.L, CRST.L, FORT.L, FOXT.L, GFRD.L, GLE.L
Read More
15 December, 2019
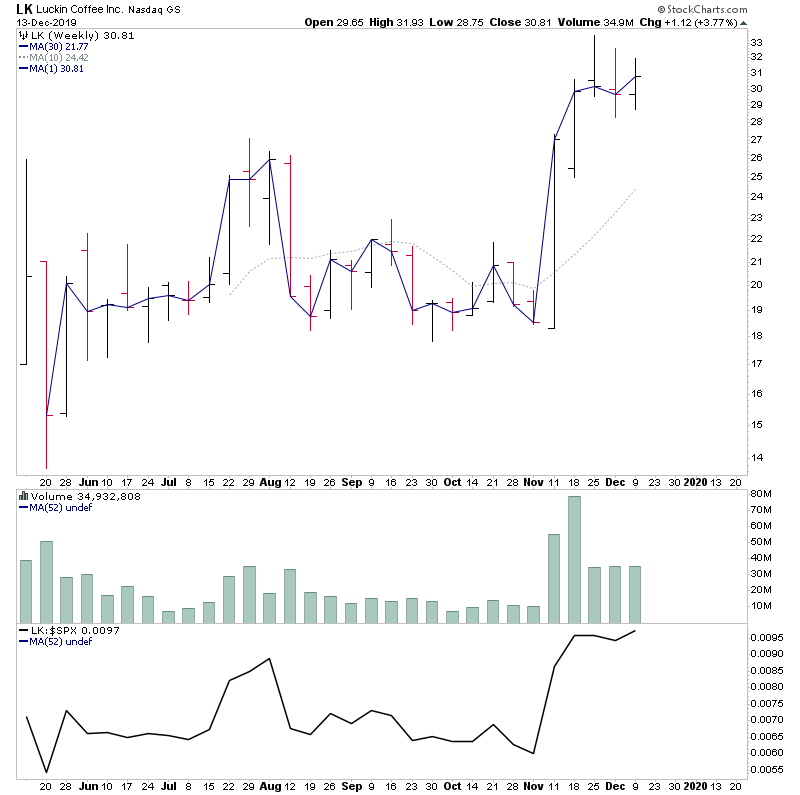
Stocks Watchlist - 15th December 2019
For the watchlist from the weekend scans - ADBE, AIA, AMRN, BORR, CROX, CRTX, EPAY, EUFN, EWU, FTNT, IPHI, LK, LTM, PFNX, QURE, ROBO, SHOP, TGTX, TSLA, TTD, WPP, WRTC, YETI, YNDX
Read More
15 December, 2019
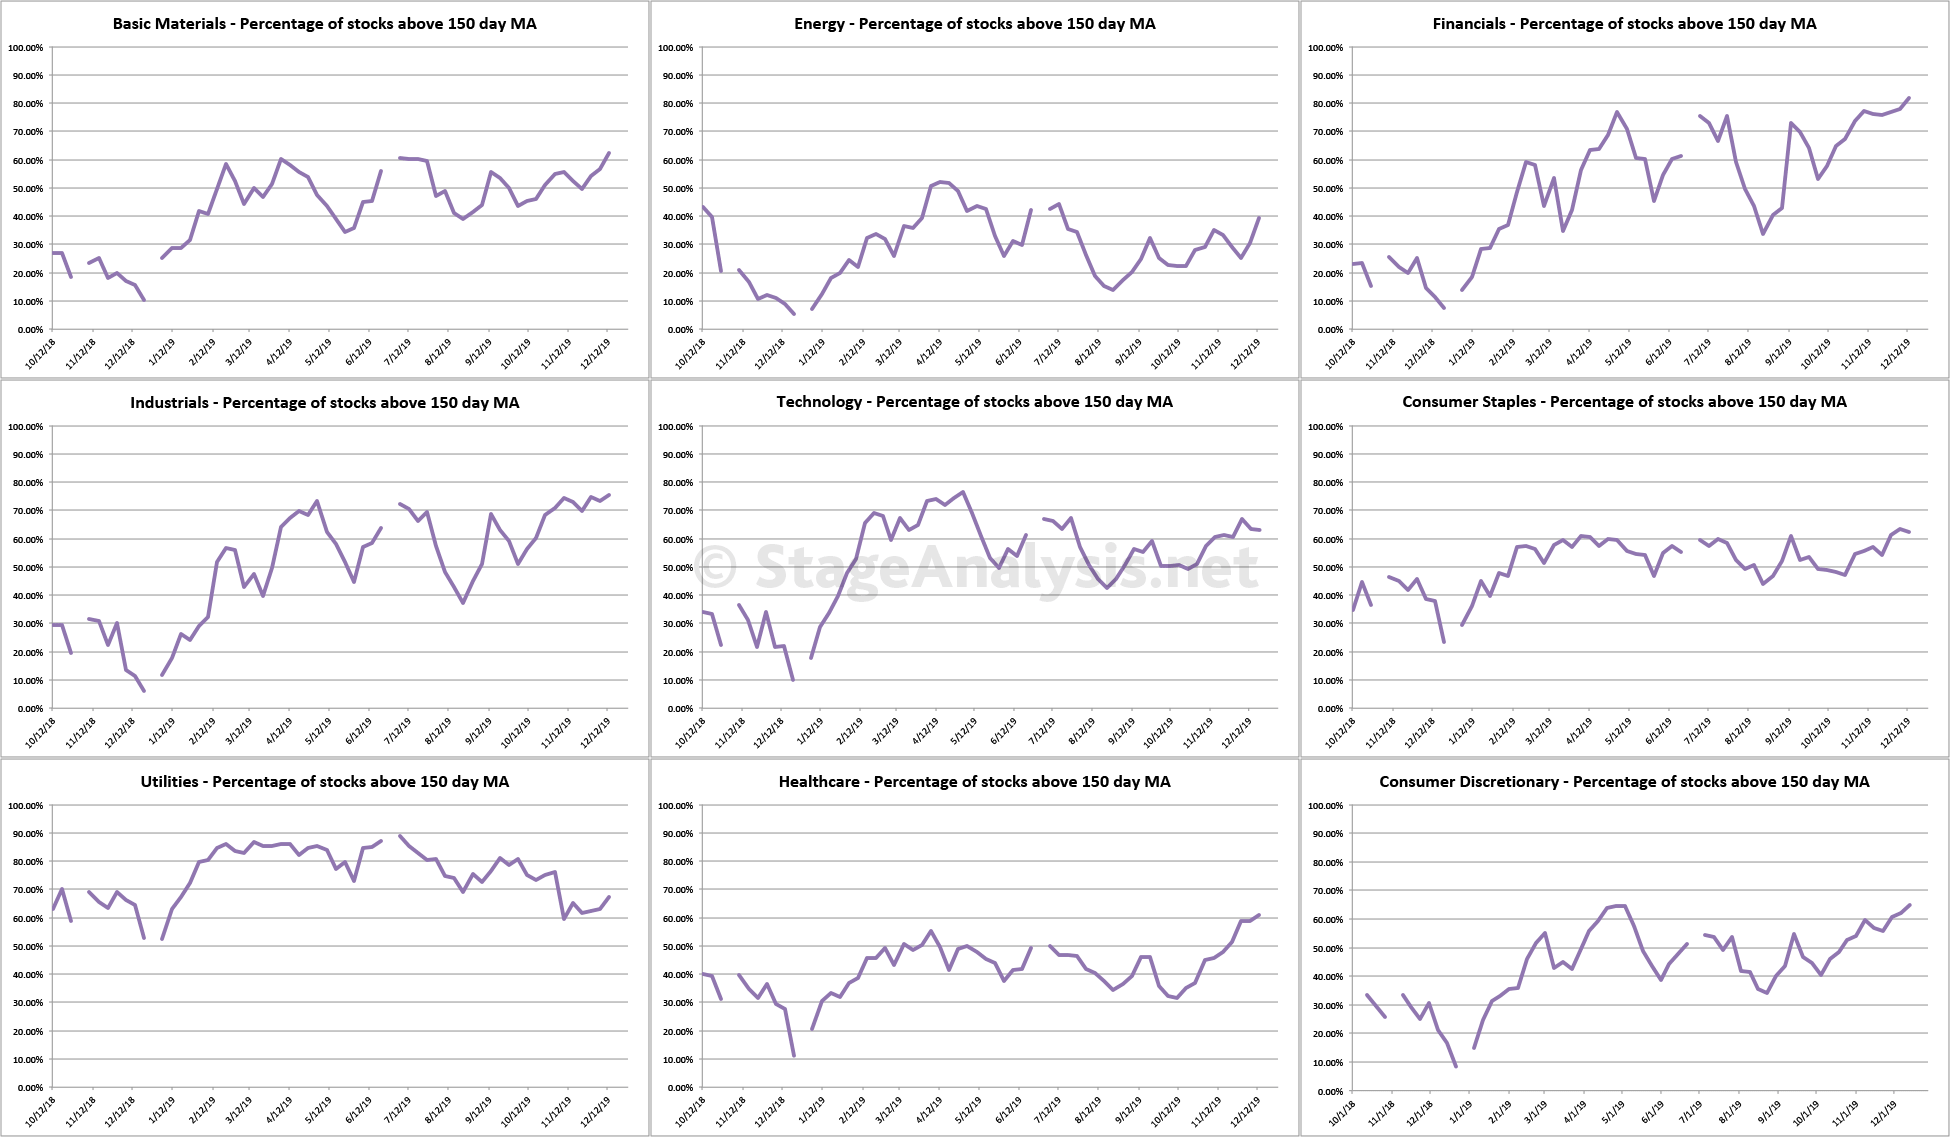
US Sectors - Percent of Stocks Above their 150 Day Moving Average - Individual Charts
US Sectors - Percent of Stocks Above their 150 Day Moving Average - Individual Charts
Read More
15 December, 2019
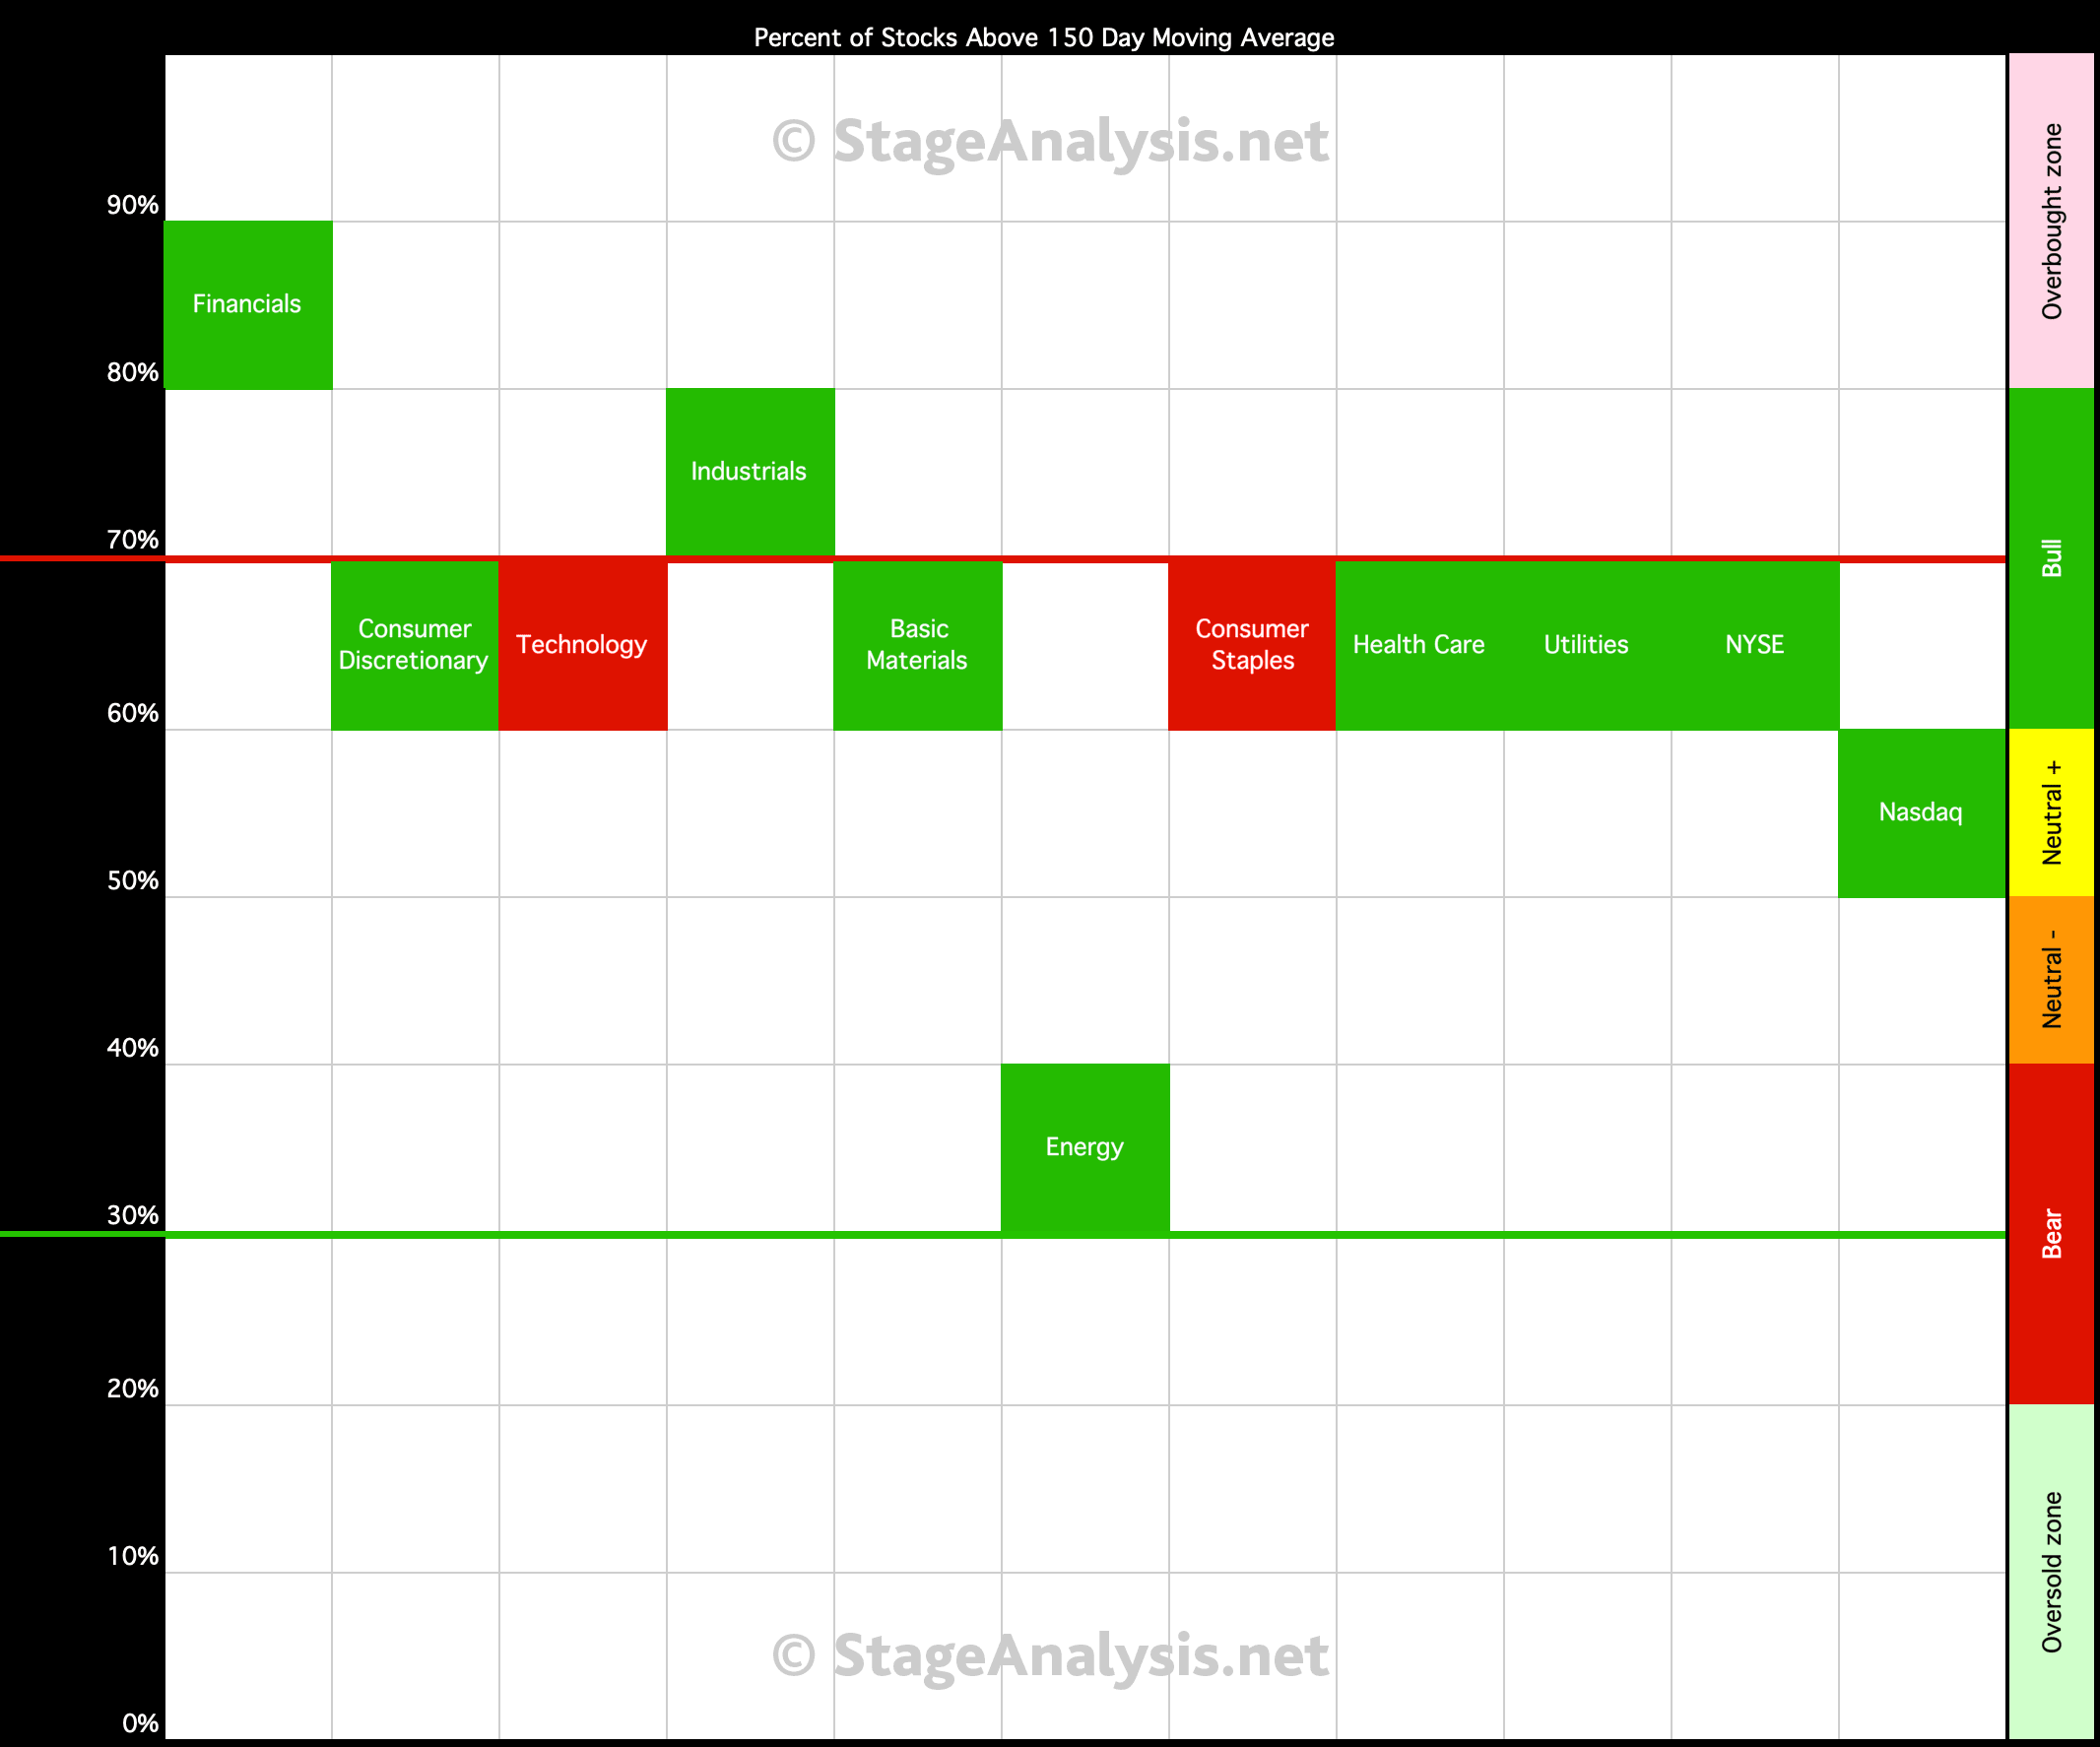
US Sectors - Percent of Stocks Above their 150 Day Moving Average
Percent of Stocks Above their 150 Day Moving Average table in each sector, which is ordered by overall health.
Read More
15 December, 2019
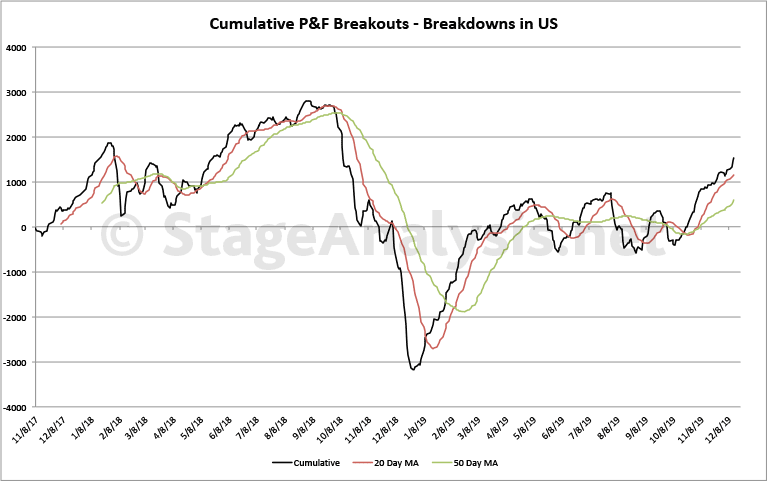
Cumulative P&F Breakouts - Breakdowns custom Breadth charts
Updated custom breadth charts that I do based on the daily point and figure double top breakouts and double bottom breakdowns.
Read More
15 December, 2019
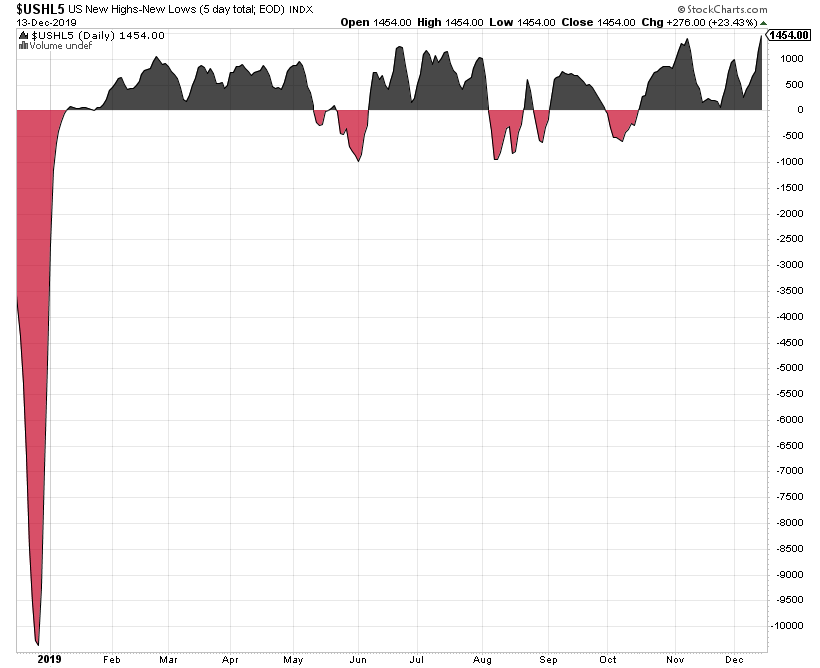
US New Highs - New Lows Charts
Updated US New Highs - New Lows Charts
Read More
15 December, 2019
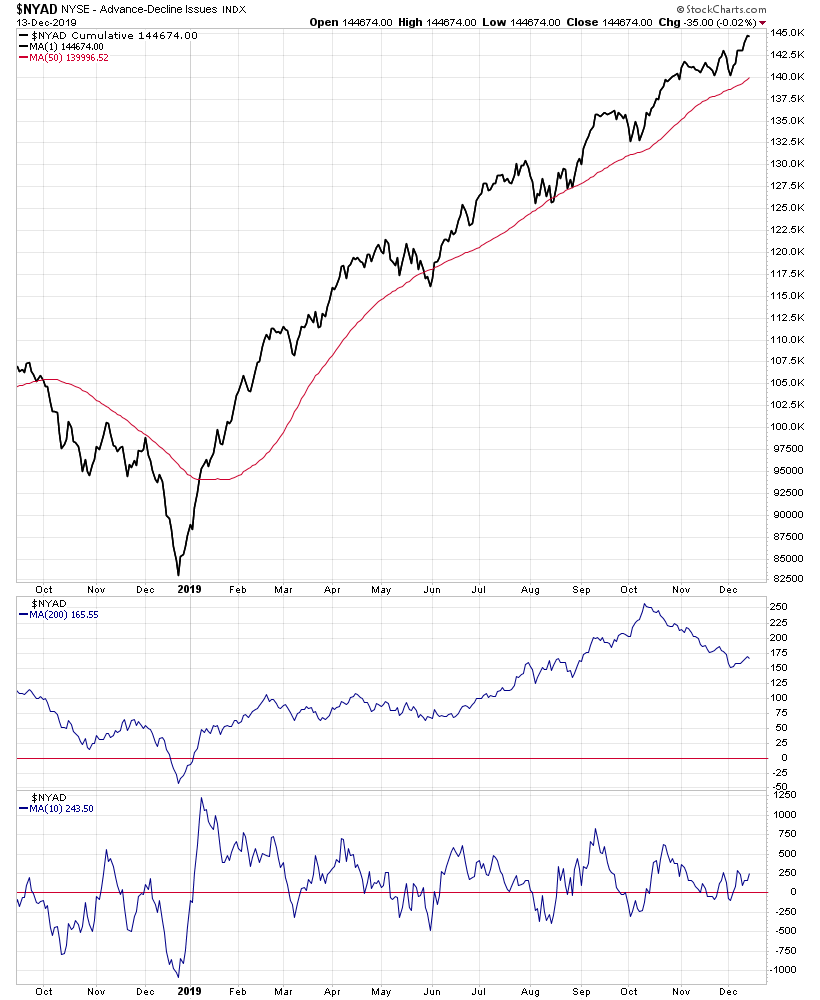
NYSE and Nasdaq Advance Decline Charts
Updated NYSE and Nasdaq Advance Decline Breadth Charts, including the cumulative AD line, momentum index, cumulative AD volume line, 10 Day AD oscillator and the McClellan Oscillator and Summation Index.
Read More