
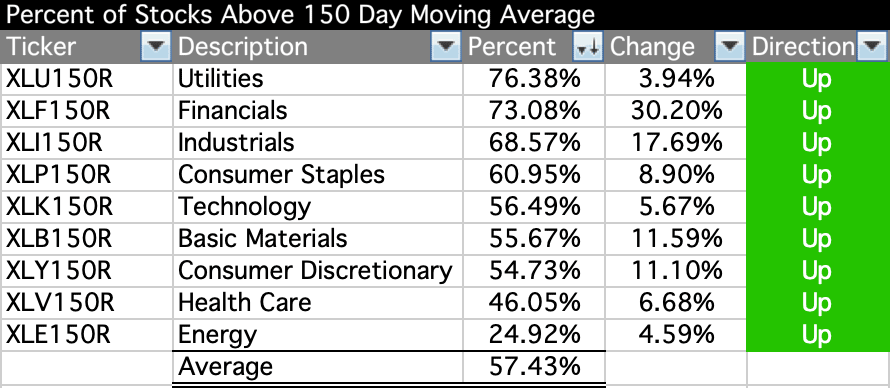
US Sectors - Percent of Stocks Above their 150 Day Moving Average
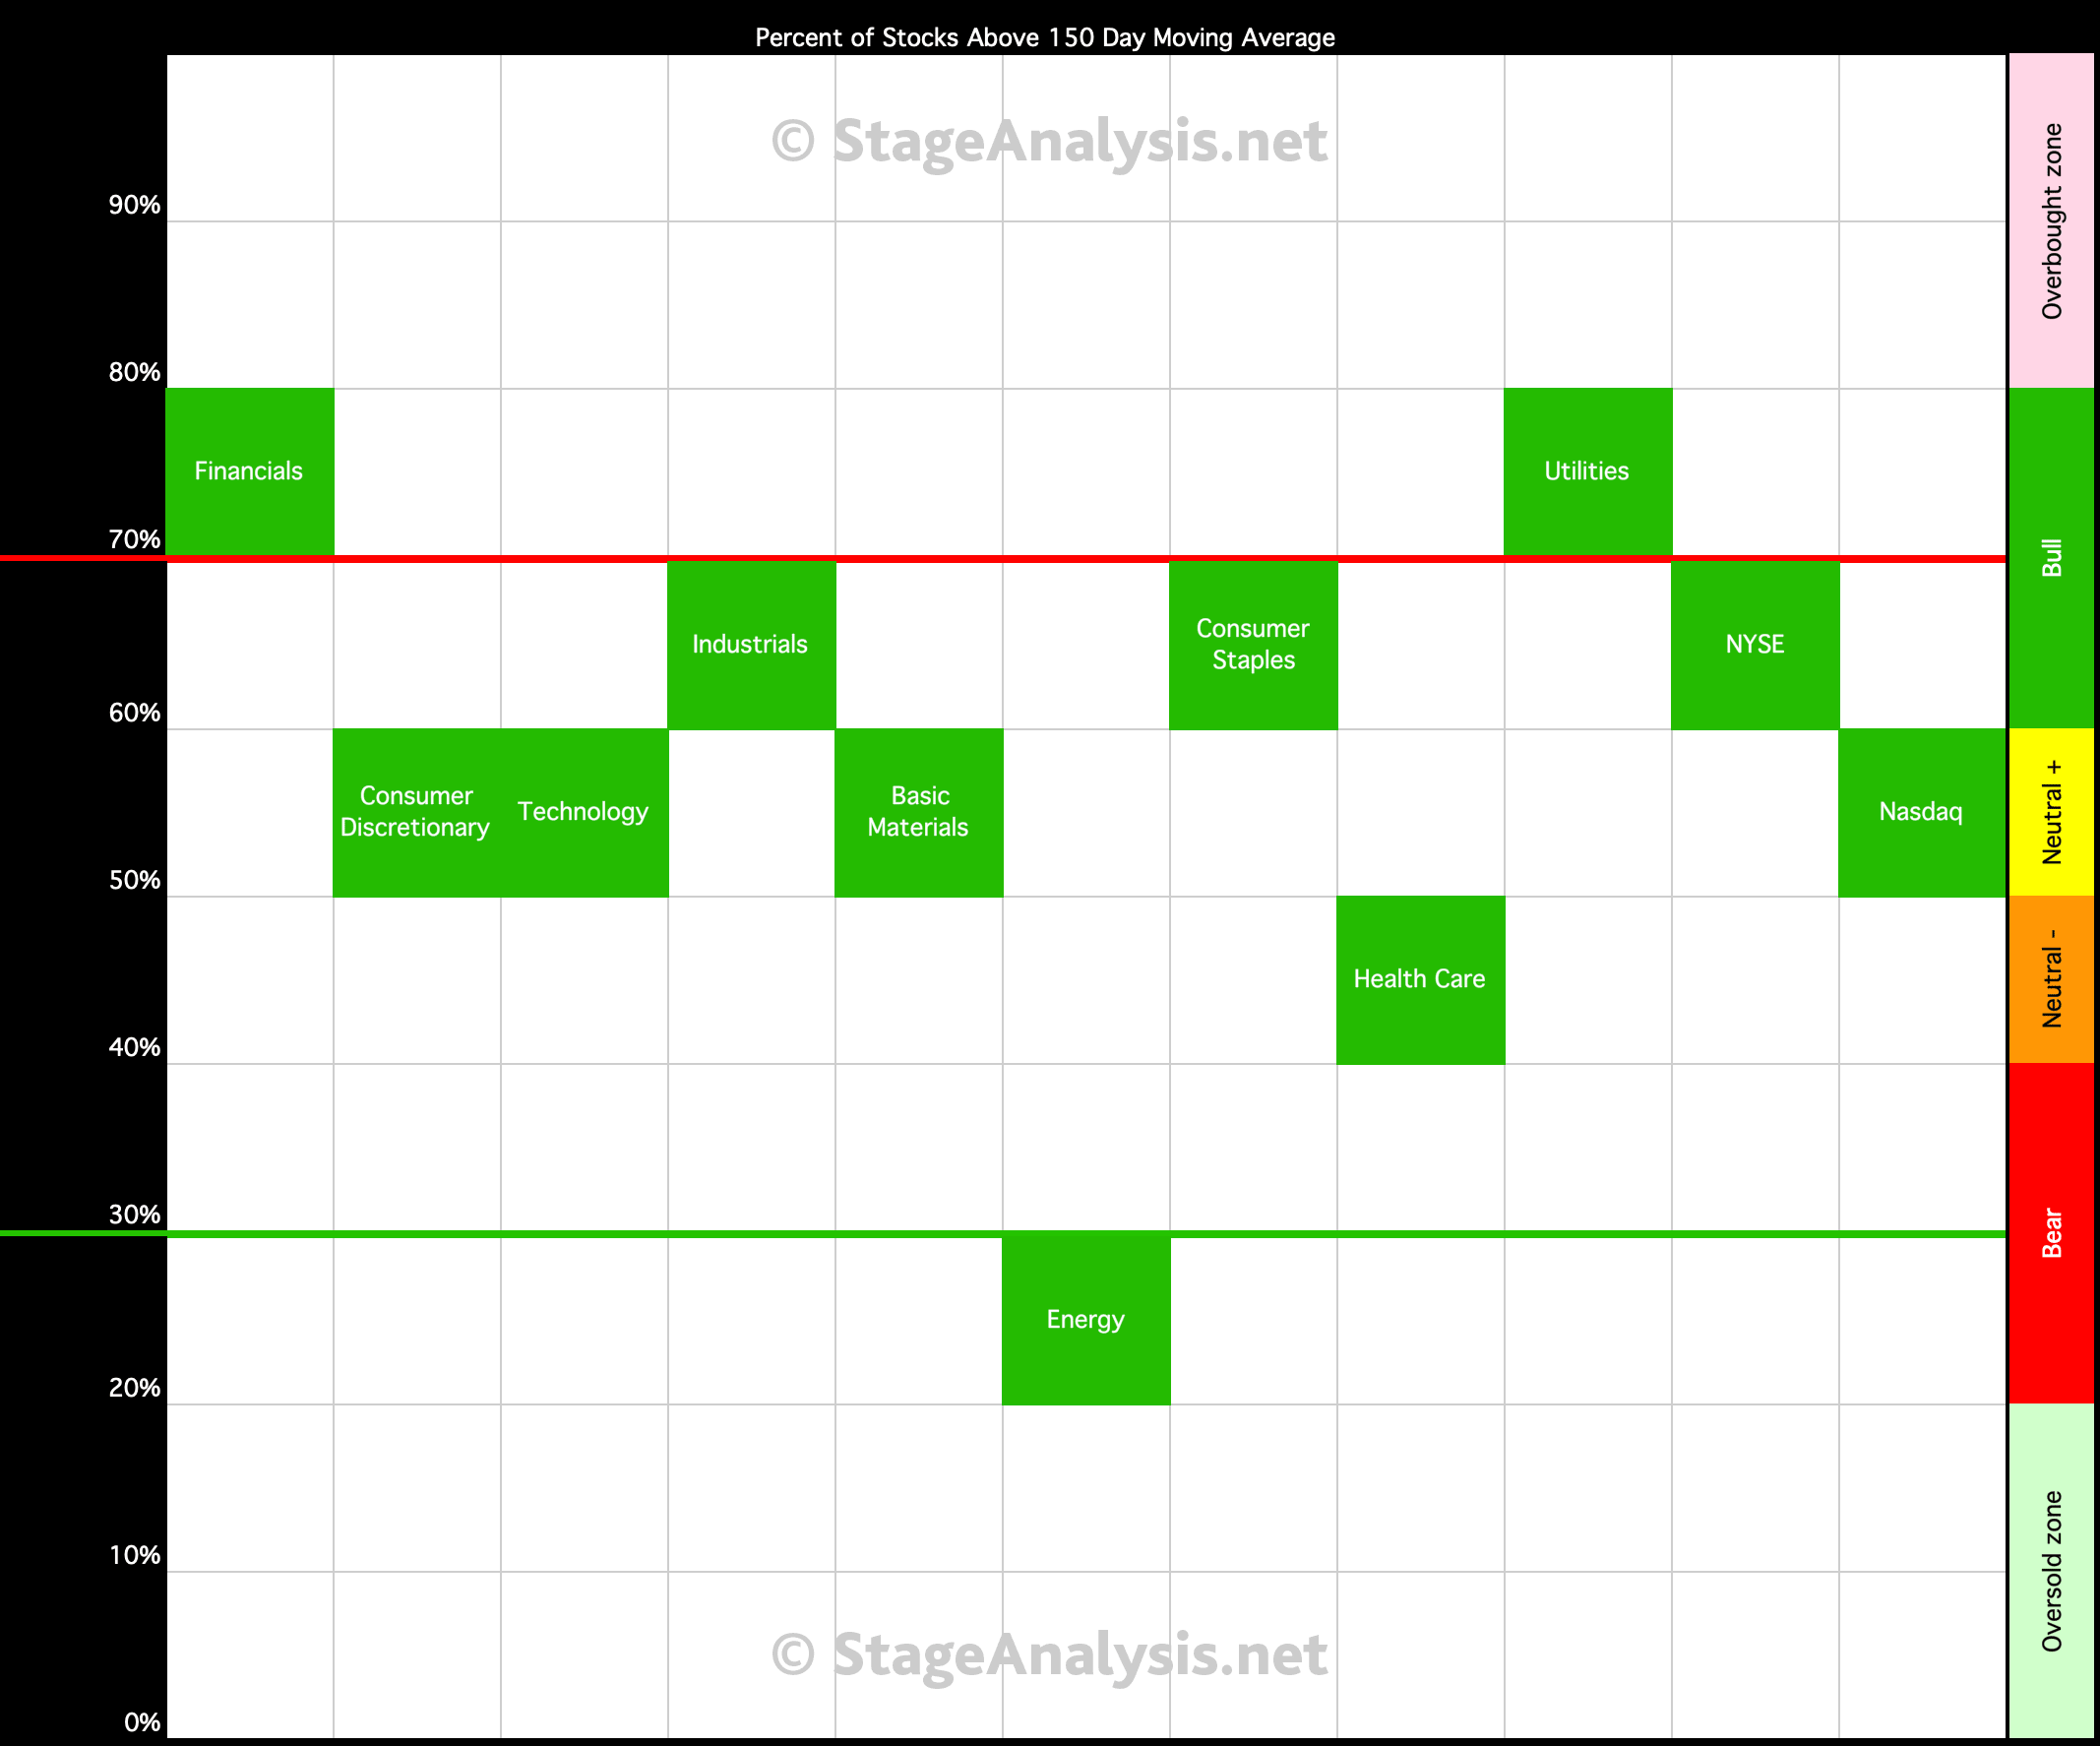
Below is the Percent of Stocks Above their 150 Day Moving Average table in each sector, which is ordered by overall health. Also attached is the visual diagram of the 9 sectors and the two major exchanges that make up the sectors that shows a snapshot of the overall health of the US market.
Note: the overall sector average is at 57.43% currently and advanced +11.15% since last week, which is the biggest weekly move that I can remember. The move was mostly down to a huge move in the Financials sector which jumped a massive +30.20% since last week, and made me double check the figures. But that combined with big moves in Industrials, Consumer Discretionary and Basic Materials has led to a big move up this week in the amount of stocks above their 150 Day Moving Average and bullish territory for around half the sectors now.
Disclaimer: For educational purpose only. Not investment advice. Seek professional advice from a financial advisor before making any investing decisions.