Stage Analysis Video Training Course

Stan Weinstein's Stage Analysis and Market Breadth - Technical Analysis - Page 67

Dow Jones US Sub Sectors

Attached is the US Sub Sectors ordered by the weekly percentage change. To see the full list sectioned by major sector, with links through to individual stocks in each sector, go to: http://stockcharts.com/freecharts/indust...ECTOR_SPDR


Attached Files Thumbnail(s)
       
isatrader

Fate does not always let you fix the tuition fee. She delivers the educational wallop and presents her own bill - Reminiscences of a Stock Operator.

UK FTSE 350 Sectors Relative Performance

Attached is the Relative performance tables for the UK FTSE 350 Sectors.

FTSE 350 Sectors - Ordered by Overall RS Score


FTSE 350 Sectors - Ordered by Weekly Change


FTSE 350 Sectors - Ordered by Monthly Change


isatrader

Fate does not always let you fix the tuition fee. She delivers the educational wallop and presents her own bill - Reminiscences of a Stock Operator.

Margin Debt at Extreme Levels

It's been a long time since I last looked at the the Free Credit less Total Margin Debt charts, which show how leveraged traders are in the market. And as you can see these are the highest levels they've been since 2000 now and so a very strong down move in the market could trigger a lot of margin calls as people are highly leveraged right now.


Attached Files Thumbnail(s)
       
isatrader

Fate does not always let you fix the tuition fee. She delivers the educational wallop and presents her own bill - Reminiscences of a Stock Operator.

RE: Market Breadth Extra

Isatrader thanks for all your insights. I would also appreciate anyone's analysis of my comments because I am new to this and using free charts.

Footnotes on pg 76 of the book talks about calculating Stan Weinstein's survey of NYSE, he says an excellent Gallup Poll is to do this for the sectors.

I put the health of the Sectors at 75% (the percentage of stage 1 &2 sectors)


What I find most interesting is that the Utilities Sector is the most unhealthiest sector (1 in stage 2, 1 in stage 3, and 3 in stage 4). The health of the utilities sector is only 20%.

In Stan Weinstein's 1997 interview (page 446) he says, "When your start to see things getting out of gear, that is a sign of a trend reversal. The sequence usually goes in this order - fist you have the utilities go. Then usually you start to usually see the Transportations go. The A/D line should come next. Then the speculative issues should top out. The last thing to top out are usually the blue chip averages."

I assume the sectors have changed since the book was written, it seems the transportation sector that Stan Weinstein referred to is now included in the Industrial Sector. Appreciate any thoughts.

RE: Market Breadth Extra

(2013-10-28, 06:01 AM)JimStudent Wrote: Footnotes on pg 76 of the book talks about calculating Stan Weinstein's survey of NYSE, he says an excellent Gallup Poll is to do this for the sectors.

I put the health of the Sectors at 75% (the percentage of stage 1 &2 sectors)

This is the purpose the previous post on the sector breadth, as the Percentage of Stocks above their 150 day (30 week) moving averages in each sector gives a very close approximation of what you'd get from a Stages survey like you did, as it covers around 4500 stocks in the whole US market. And as I've said previously it has a very good correlation with the stages survey.

So as you can see from the table if you average the sector percentages it came to 76.01% this week.


(2013-10-28, 06:01 AM)JimStudent Wrote: What I find most interesting is that the Utilities Sector is the most unhealthiest sector (1 in stage 2, 1 in stage 3, and 3 in stage 4). The health of the utilities sector is only 20%.

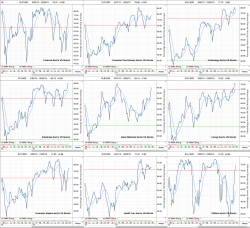
You seem to have a very small sample size of the Utilities sector. In my sector breadth data it covers 182 utilities stocks in the US, and although it was the weakest sector a month ago, it's been recovering strongly the last few weeks and has moved from below 35% in September to 74.18% now. See below:
   

(2013-10-28, 06:01 AM)JimStudent Wrote: In Stan Weinstein's 1997 interview (page 446) he says, "When your start to see things getting out of gear, that is a sign of a trend reversal. The sequence usually goes in this order - fist you have the utilities go. Then usually you start to usually see the Transportations go. The A/D line should come next. Then the speculative issues should top out. The last thing to top out are usually the blue chip averages."

I assume the sectors have changed since the book was written, it seems the transportation sector that Stan Weinstein referred to is now included in the Industrial Sector. Appreciate any thoughts.

The Utilities and Transports charts he was referring to I believe were the Dow Jones Utility Average ($UTIL) and the Dow Jones Transportation Average ($TRAN)
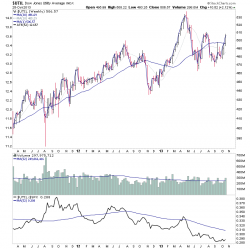
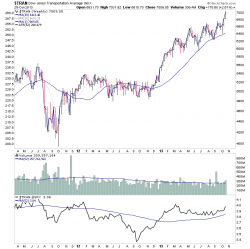
       

The Utilities average is in Stage 3 and the Transports made a Stage 2 continuation move to new highs two weeks ago.

The A/D line also just broke out to fresh new highs after consolidating for most of the summer in a Stage 3 range, so has made a Stage 2 continuation move.
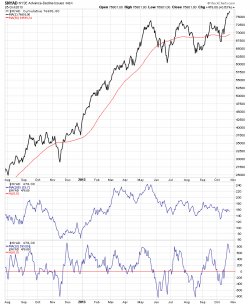
   

So keep an eye on these as Stan said, as when you start to see things breaking down in these measures you'll know to be a bit more defensive in your trading.

Hope that helps.

isatrader

Fate does not always let you fix the tuition fee. She delivers the educational wallop and presents her own bill - Reminiscences of a Stock Operator.

S&P 500 Cumulative P&F Breakouts - Breakdowns

Attached is the exclusive S&P 500 Cumulative P&F Breakouts - Breakdowns charts.

There was 47 breakouts and 17 breakdowns this week, taking the total for the month of October to 223 breakouts and 59 breakdowns.


Attached Files Thumbnail(s)
           
isatrader

Fate does not always let you fix the tuition fee. She delivers the educational wallop and presents her own bill - Reminiscences of a Stock Operator.

Advance Decline Breadth Charts

Attached is the updated Advance Decline Breadth Charts, including the cumulative AD line, momentum index, cumulative AD volume line, 10 Day AD oscillator and the McClellan Oscillator and Summation Index.


Attached Files Thumbnail(s)
                   
isatrader

Fate does not always let you fix the tuition fee. She delivers the educational wallop and presents her own bill - Reminiscences of a Stock Operator.

New Highs New Lows

Attached is the New Highs / New Lows charts.


Attached Files Thumbnail(s)
           
isatrader

Fate does not always let you fix the tuition fee. She delivers the educational wallop and presents her own bill - Reminiscences of a Stock Operator.


Forum Jump:


Users browsing this thread: 7 Guest(s)